Google Stackdriver provides powerful monitoring, logging, and diagnostics. OpsRamp integration supports to accept incidents from Stackdriver as alerts.
OpsRamp configuration
Step 1: Install the integration
- From All Clients, select a client.
- Navigate to Setup > Account.
- Select the Integrations and Apps tab.
- The Installed Integrations page, where all the installed applications are displayed. Note: If there are no installed applications, it will navigate to the Available Integrations and Apps page.
- Click + ADD on the Installed Integrations page. The Available Integrations and Apps page displays all the available applications along with the newly created application with the version.
- Search for the application using the search option available. Alternatively, use the All Categories option to search.
- Click ADD on the Stackdriver tile.
Inbound (Optional):
To configure the inbound, follow these steps:
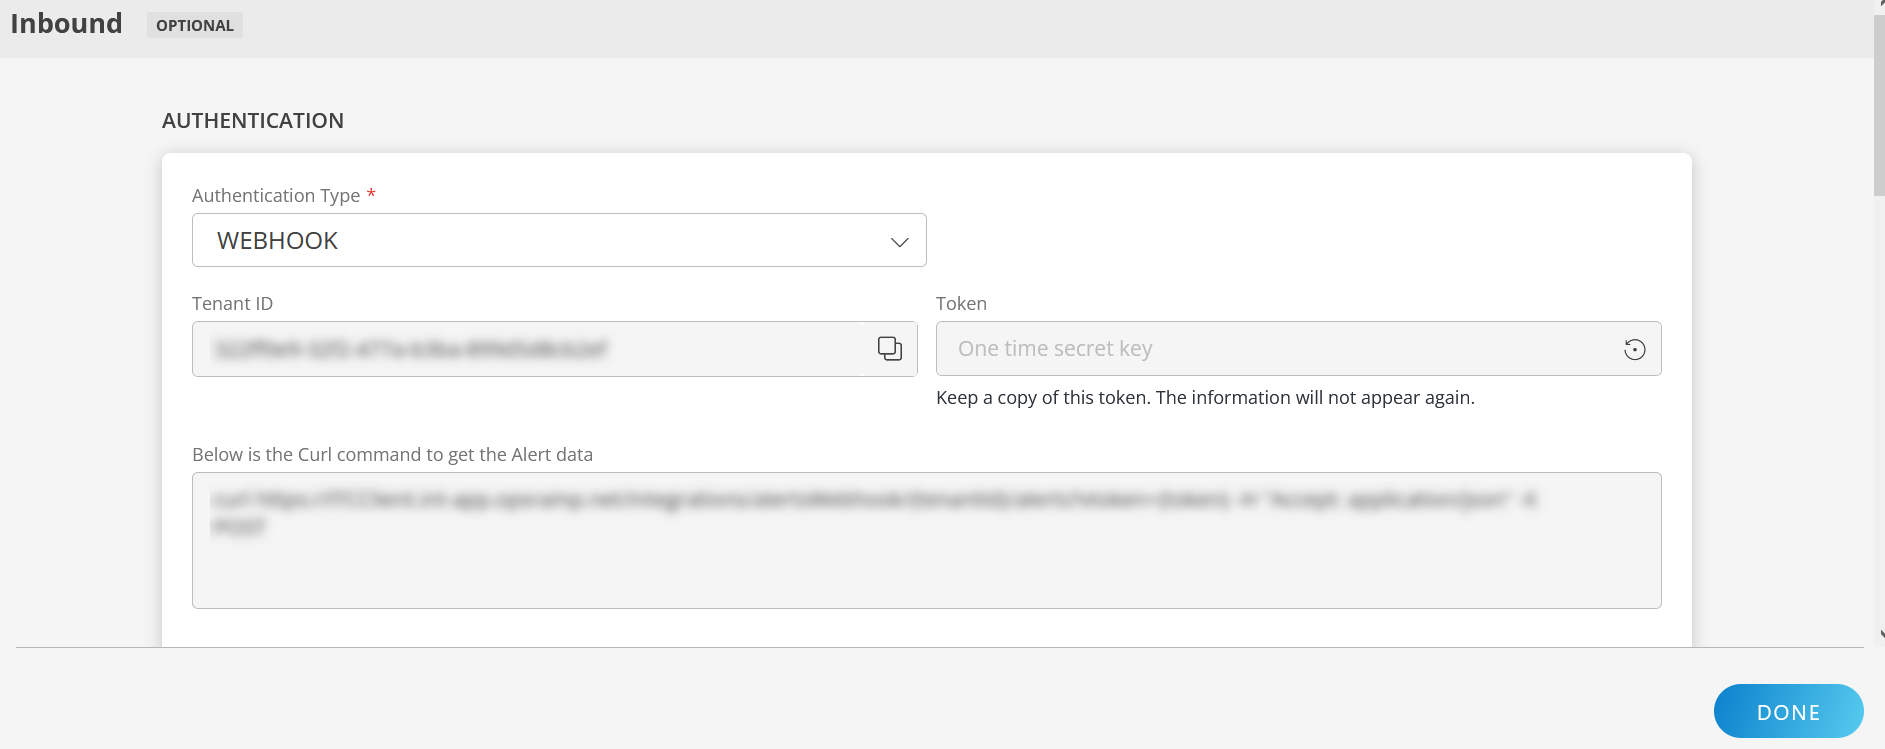
Authentication:
Select the Authentication Type as Webhook.
- Webhook: By default, Webhook is selected as the Authentication Type.
Make a note of Tenant ID, Token and Webhook URL.
These details are used while creating an HTTP Request template during Stackdriver configuration.
- Webhook: By default, Webhook is selected as the Authentication Type.
Map Attributes: Map OpsRamp entity attributes with Stackdriver attributes.
Click +Add from the Map Attributes section.
From the Add Map Attributes window, enter the below information:
- OpsRamp Entity: Select Alert from the dropdown.
- OpsRamp Property: Select the OpsRamp property from the dropdown.
- Stackdriver Entity: Enter the Stackdriver entity value in the box and click the +value from the dropdown to add it. You can add multiple values.
- Stackdriver Property: Enter the Stackdriver property.
Parsing Condition:
- Click +Add and provide the parsing condition:
- Select an operator from the dropdown and enter a value in the fields accordingly. Based on the operator selected, the fields vary.
- Click Save. Click +Add to add more conditions.
Property Values:
- Click +Property Value.
- Enter a value in the Stackdriver Property Value box and select the appropriate value from the OpsRamp Property Value dropdown.
The options in the OpsRamp Property Value dropdown appear based on the OpsRamp Property selected. - Click Save.
- Click +Property Value to add more property values.
Default Value: Alternatively, you can enter/select a default value in the box.
Note: To map more attributes, click +Entity.
Click Add Map Attributes. The mapped attributes list is added.
- Click the three dots icon at the end of each row to edit or remove the map attributes.
- Use the Filter option to filter the map attributes.
Additional Settings: Select the Drop alerts from unmanaged resources checkbox if you do not want to trigger alerts from unmanaged resources.
Enrich and Create Alert: Select a process definition from the dropdown. You can customize the incoming alerts according to the properties defined in the process definition.
Click Finish.
Attributes can be modified at any time.
The following table shows attribute mappings.
| Stackdriver Property | OpsRamp Property | ||||||
|---|---|---|---|---|---|---|---|
| incident.started_at | Alert time | ||||||
| incident.state | Alert state
| ||||||
| incident.policy_name | Alert metric | ||||||
| incident.resource_name | Alert resource name | ||||||
| incident.condition_name | Alert description | ||||||
| incident.summary | Alert subject |
Example payload
{
  "incident": {
        "incident_id": "0.kojklrfwei9s",
        "resource_id": "",
        "resource_name": "gce-integration Uptime Monitoring URL labels{host = opsramp.dev-instance.com}",
        "state ": "open",
        "started_at ": 1518762381,
        "ended_at ": null,
        "policy_name ": "Staging Uptime Check Policy ",
     "condition_name ": "Generic HTTPS check on opsramp.dev-instance.com at / login.do ",
     "url ": "https: //app.google.stackdriver.com/incidents/0.kojklrfwei9s?project=gce-integration",
     "summary": "An uptime check on gce-integration Uptime Monitoring URL labels { host=opsramp.dev-instance.com } is failing."
     },
  "version": "1.1"
}
Stackdriver configuration
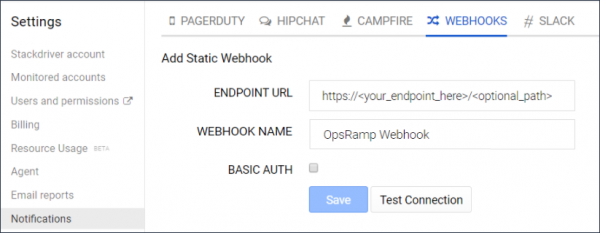
Step 1: Create Webhook notification
- Log into Stackdriver.
- Go to Account Settings > Notifications > Webhooks, click Add Webhook.
- Configure the Webhook details:
- ENDPOINT URL:
https://{Your_OpsRamp_domain}/integrations/alertsWebhook/{tenantId}/alerts?vtoken={token}
Enter the TenantId and Token from the OpsRamp configuration. - Webhook name: Enter name for Webhook. Example: OpsRamp Webhook
- Basic Auth: Not required
- ENDPOINT URL:
- Click Save. This Webhook is used while creating an Alerting policy.
Step 2: Create uptime check
Stackdriver checks the availability of your service by accessing it from different geographical locations. An uptime check periodically makes an automated request to a URL, or a resource on regular basis. If the resource fails to respond to a request sent from at least two geographical locations, then the uptime check fails thereby creating an incident in Stackdriver. The incident is notified to OpsRamp as an alert.
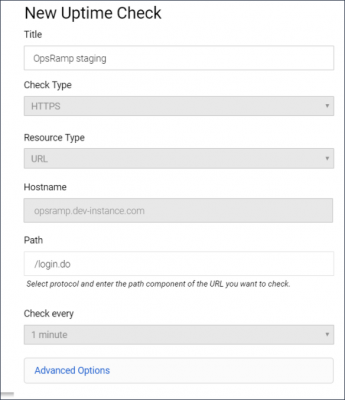
To create an uptime check:
- From Uptime Checks, click Add Uptime Check. A New Uptime Check window is displayed.
- Configure the following for the check:
- Title: Enter name for uptime check. Example: OpsRamp Staging
- Check Type: Select a protocol: HTTP, HTTPS, TCP. Example: HTTPS
- Resource Type: Select resource type. Example: URL
- Hostname: Enter the name of the host you want to add uptime check.
This field is applicable only if the resource type is URL. - Path: Enter a path in the host or use the default path.
- Check every: Select the time-frequency at which the check should send requests to the resource. Example: Five minutes. Each geographic location attempts to reach the resource every five minutes.
- Click Test to ensure Uptime Check works correctly.
- Click Save to save the Uptime Check.
Uptime check is created and is available on the Uptime Checks page. Create an alerting policy for the check to send notifications to OpsRamp.
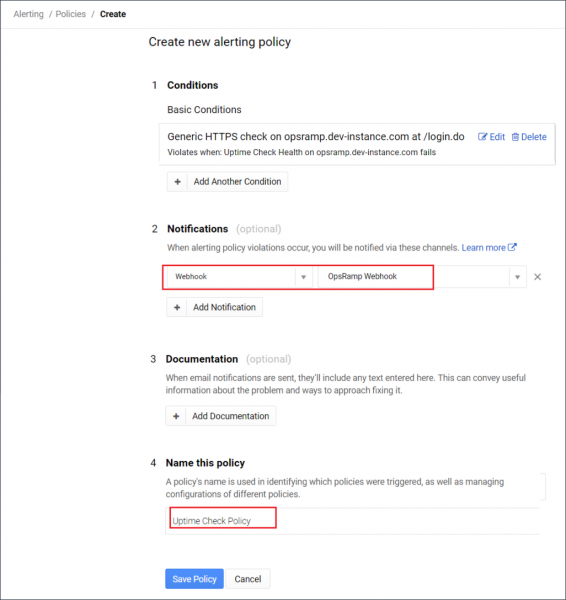
Step 3: Create alerting policy
Alerting policy is a set of conditions that determine a resource is functioning normally and to send notifications if a problem occurs in the functioning process.
To create an alerting policy:
- Go to Uptime Checks, select the required Uptime check, click the Menu icon, and click Create Alerting Policy.
- Configure the policy details:
- Condition: Click Add Condition, select the required Uptime Check condition, enter the details for the check and click Save Condition.
- Notification: Select Notification type - Webhook and value - configured webhook name. Example: OpsRamp Webhook.
- Documentation: Not required.
- Name: Enter a name for alerting policy. Example: Uptime Check Policy.
- Click Save Policy. The alerting policy is created and attached to the Uptime Check.
When the configured conditions in the alerting policy are met, an event is triggered thereby creating an incident. The incident is notified to OpsRamp as an alert using the Webhook mechanism. OpsRamp displays the alerts in the Alerts tab.