| Supported Target Versions |
|---|
| vRealize Operations version: 8.10.2.21178503 |
Application Version and Upgrade Details
| Application Version | Bug fixes / Enhancements |
|---|---|
| 1.0.0 | Initial Deployment |
Introduction
VMware vRealize Operations is an all-encompassing operations management platform developed by VMware. It has been meticulously crafted to aid organizations in the efficient management and monitoring of their virtualized and cloud environments. VMware vRealize Operations offers cutting-edge analytics, automated workload balancing, capacity planning, performance optimization, and troubleshooting capabilities.
The platform gathers data from diverse sources, including virtual machines, physical infrastructure, applications, and storage systems. This data is subsequently analyzed to glean insights into the health, performance, and efficiency of the environment. These invaluable insights empower IT administrators and infrastructure teams to make well-informed decisions, proactively identify and resolve issues, optimize resource utilization, and ensure the overall performance and availability of their virtualized infrastructure.
Key features of VMware vRealize Operations include
- Performance Monitoring: Offering real-time monitoring and analysis of performance metrics, enabling the identification of bottlenecks, optimization of resource allocation, and assurance of seamless operations.
- Capacity Planning: Utilizing predictive analytics to forecast future resource requirements, pinpoint capacity shortfalls, and optimize resource allocation to meet evolving business demands.
- Automated Remediation: Proactively identifying and resolving performance issues through automated actions, including workload balancing and capacity adjustments.
- Intelligent Workload Placement: Providing recommendations for optimal workload placement based on resource utilization, performance requirements, and adherence to business policies.
- Customizable Dashboards and Reports: Enabling the creation of personalized dashboards and reports, facilitating visualization of key performance indicators and targeted infrastructure monitoring.
- Ecosystem Integration: Seamlessly integrating with both other VMware solutions and third-party tools and management systems, ensuring a unified operations management experience.
In summary, vRealize Operations simplifies the management of virtualized and cloud environments, enhances operational efficiency, and elevates the performance, availability, and capacity planning of IT infrastructure.
Prerequisites
- OpsRamp Classic Gateway 14.0.0 and above.
- OpsRamp Nextgen Gateway 14.0.0 and above.
Note: OpsRamp recommends using the latest Gateway version for full coverage of recent bug fixes, enhancements, etc.. - Should be able to connect to vRealize portal via SSH with the provided IpAddress/Hostname and the credentials.
Roles and Permissions
Users with read permissions are required to fetch service status related data.
Supported Metrics
Click here to view the supported metrics
| Native Type | Metric Name | Display Name | Metric Label | Units | Application Version | Description |
|---|---|---|---|---|---|---|
| VMWare vRealize Operations | vmware_vrealize_operations_port_Status | VMware vRealize Operations Port Status | Availability | None | 1.0.0 | VMware vRealize Operations port open/close status |
| vmware_vrealize_operations_service_Status | VMware vRealize Operations Service Status | Availability | None | 1.0.0 | VMware vRealize Operations system services running status | |
| vmware_vrealize_operations_url_Status | VMware vRealize Operations URL Status | Availability | None | 1.0.0 | VMware vRealize Operations URL reachability Status | |
| vmware_vrealize_operations_node_Status | VMware vRealize Operations Node Status | Availability | None | 1.0.0 | VMware vRealize Operations Node running status |
Default Monitoring Configurations
VMware vRealize Operations has default Global Device Management Policies, Global Templates, Global Monitors and Global Metrics in OpsRamp. You can customize these default monitoring configurations as per your business use cases by cloning respective Global Templates and Global Device Management Policies. We recommend doing this activity before installing the application to avoid noise alerts and data.
Default Global Device Management Policies
You can find the Device Management Policy for each Native Type at Setup > Resources > Device Management Policies. Search with suggested name in global scope. Each Device Management Policy follows below naming convention:
{appName nativeType - version}Ex: vmware-vrealize-operations VMware vRealize Operations - 1(i.e, appName = vmware-vrealize-operations, nativeType = VMware vRealize Operations , version = 1)
Default Global Templates
You can find the Global Templates for each Native Type at Setup > Monitoring > Templates. Search with suggested names in global scope. Each template follows below naming convention:
{appName nativeType 'Template' - version}Ex: vmware-vrealize-operations VMware vRealize Operations Template - 1(i.e, appName = vmware-vrealize-operations, nativeType = VMware vRealize Operations, version = 1)
Default Global Monitors
You can find the Global Monitors for each Native Type at Setup > Monitoring > Monitors. Search with suggested name in global scope. Each Monitors follows below naming convention:
{monitorKey appName nativeType - version}Ex: VMware vRealize Operations Monitor vmware-vrealize-operations VMware vRealize Operations 1 (i.e, monitorKey =VMware vRealize Operations Monitor, appName = vmware-vrealize-operations, nativeType = VMware vRealize Operations , version = 1)
Configure and Install the VMWare vRealize Operations Integration
- From All Clients, select a client.
- Navigate to Setup > Account.
- Select the Integrations tab.
- The Installed Integrations page, where all the installed integrations are displayed. Click + ADD on the Installed Integrations page.
- If you do not have any installed applications, you will be navigated to the Available Integrations page. The Available Integrations page displays all the available applications along with the newly created application with the version.
Note: Search for the application using the search option available. Alternatively, use the All Categories option to search. - Click ADD in the VMware vRealize Operations application.
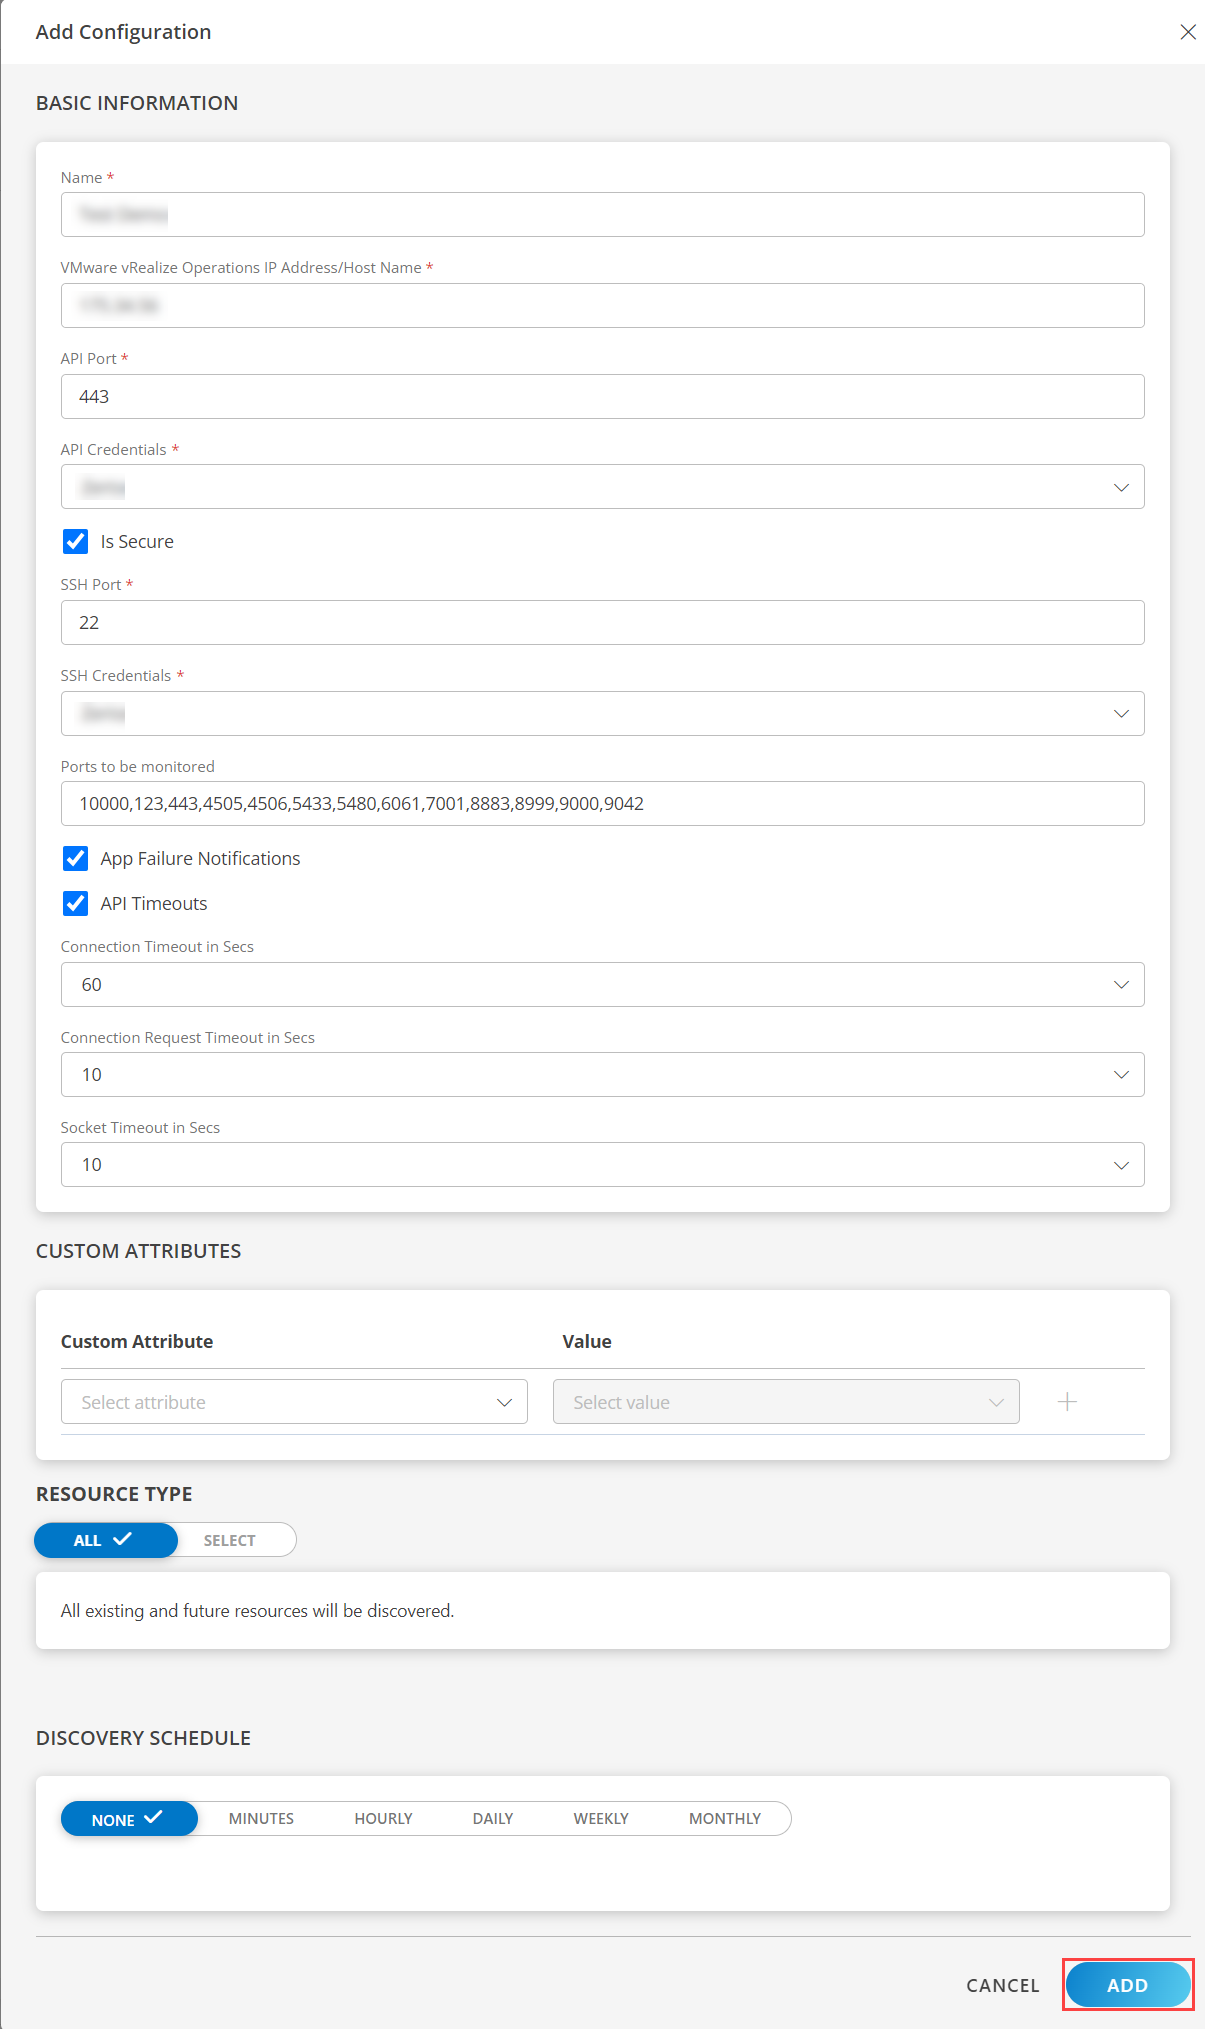
- In the Configurations page, click + ADD. The Add Configuration page appears.
- Enter the following BASIC INFORMATION:
| Functionality | Description |
|---|---|
| Name | Enter the name for the configuration. |
| VMware vRealize Operations IP Address/Host Name | IP address/host name of the target. |
| API Port | API Port details Note: By default 443 is added |
| API Credentials | Select the Credential from the drop-down list. Notes:
|
| SSH Port | SSH Port details Note: By default 22 is added |
| SSH Credential | Select the Credential from the drop-down list. Notes:
|
| Ports to be monitored | Enter the Ports that need to be monitored. Note: By default 1000, 123, 443, 4505, 4506, 5433, 5480, 6061, 7001, 8883, 8999, 9000, 9042 are added. |
Notes:
- By default the Is Secure checkbox is selected.
- VMware vRealize Operations IP Address/Host Name and Port should be accessible from Gateway.
- Select the following:
- App Failure Notifications: if turned on, you will be notified in case of an application failure that is, Connectivity Exception, Authentication Exception.
- API Timeouts: These are the maximum API Timeouts that the application can use to connect and get responses from the end device.
- Connection Timeout in Secs: a time period in which a client should establish a connection with a server.
Note: By default, 60 is selected. - Connection Request Timeout in Secs: a time period required to process an HTTP call: from sending a request to receiving a response.
Note: By default, 10 is selected. - Socket Timeout in Secs: a maximum time of inactivity between two data packets when exchanging data with a server.
Note: By default, 10 is selected.
- Connection Timeout in Secs: a time period in which a client should establish a connection with a server.
- Select the below mentioned Custom Attribute:
| Functionality | Description |
|---|---|
| Custom Attribute | Select the custom attribute from the drop down list box. |
| Value | Select the value from the drop down list box. |
Note: The custom attribute that you add here will be assigned to all the resources that are created by the integration. You can add a maximum of five custom attributes (key and value pair).
- In the RESOURCE TYPE section, select:
- ALL: All the existing and future resources will be discovered.
- SELECT: You can select one or multiple resources to be discovered.
- In the DISCOVERY SCHEDULE section, select Recurrence Pattern to add one of the following patterns:
- Minutes
- Hourly
- Daily
- Weekly
- Monthly
- Click ADD.
Now the configuration is saved and displayed on the configurations page after you save it.
Note: From the same page, you may Edit and Remove the created configuration.
Under the ADVANCED SETTINGS, Select the Bypass Resource Reconciliation option, if you wish to bypass resource reconciliation when encountering the same resources discovered by multiple applications.
Note: If two different applications provide identical discovery attributes, two separate resources will be generated with those respective attributes from the individual discoveries.
Click NEXT.
(Optional) Click +ADD to create a new collector by providing a name or use the pre-populated name.
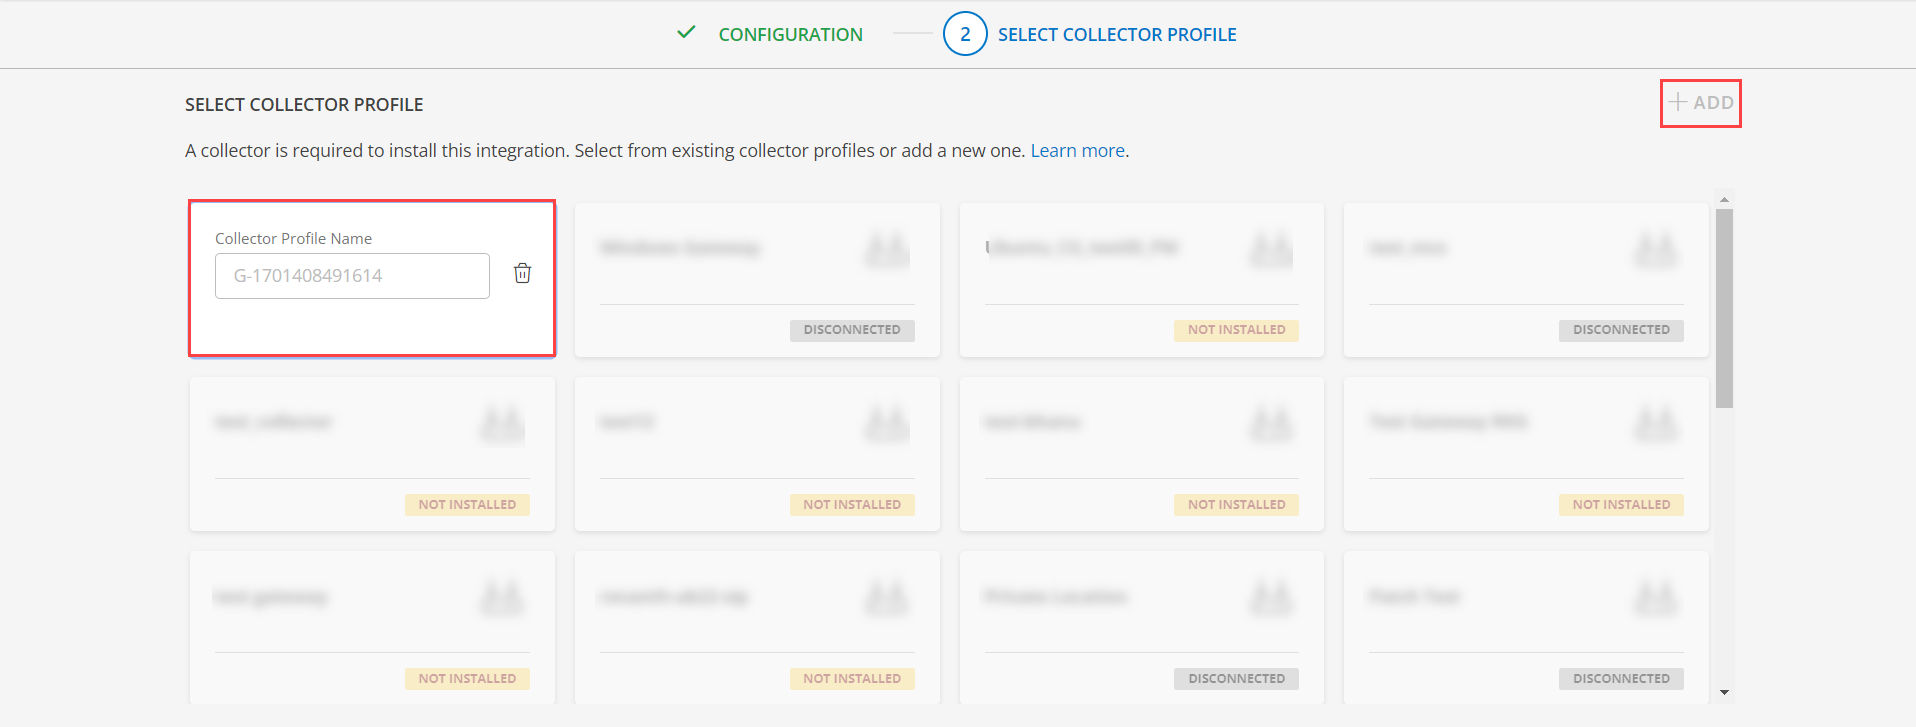
- Select an existing registered profile.
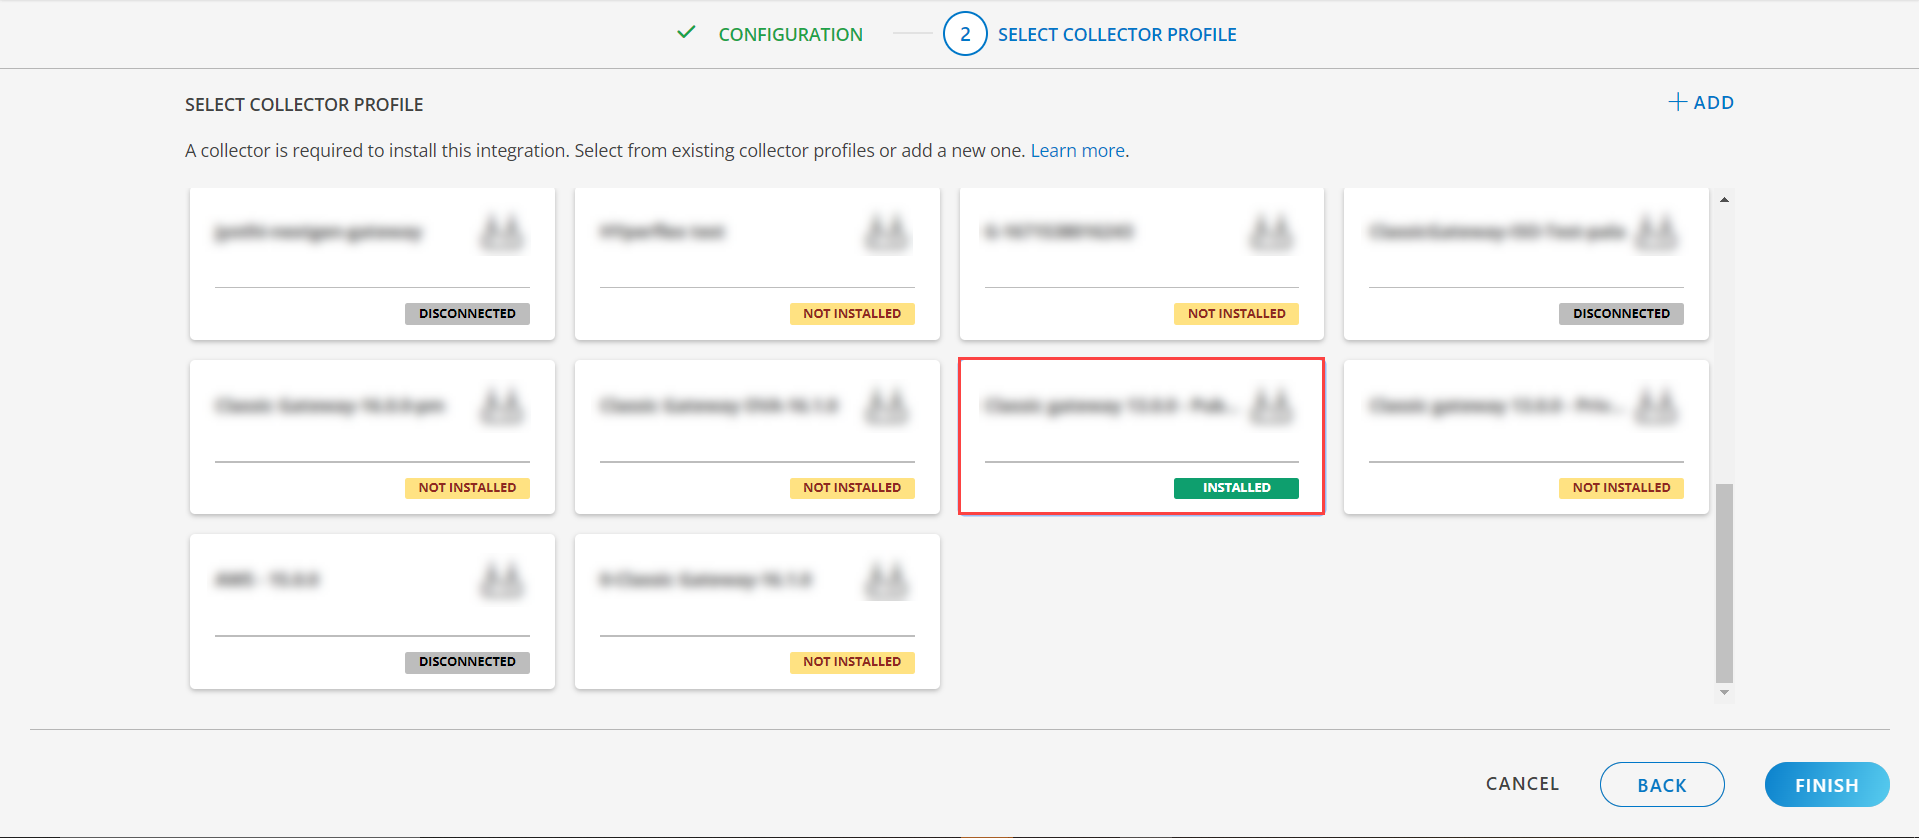
- Click FINISH.
The application is installed and displayed on the INSTALLED INTEGRATION page. Use the search field to find the installed integration.
Modify the Configuration
See Modify an Installed Integration or Application article.
Note: Select VMware vRealize Operations.
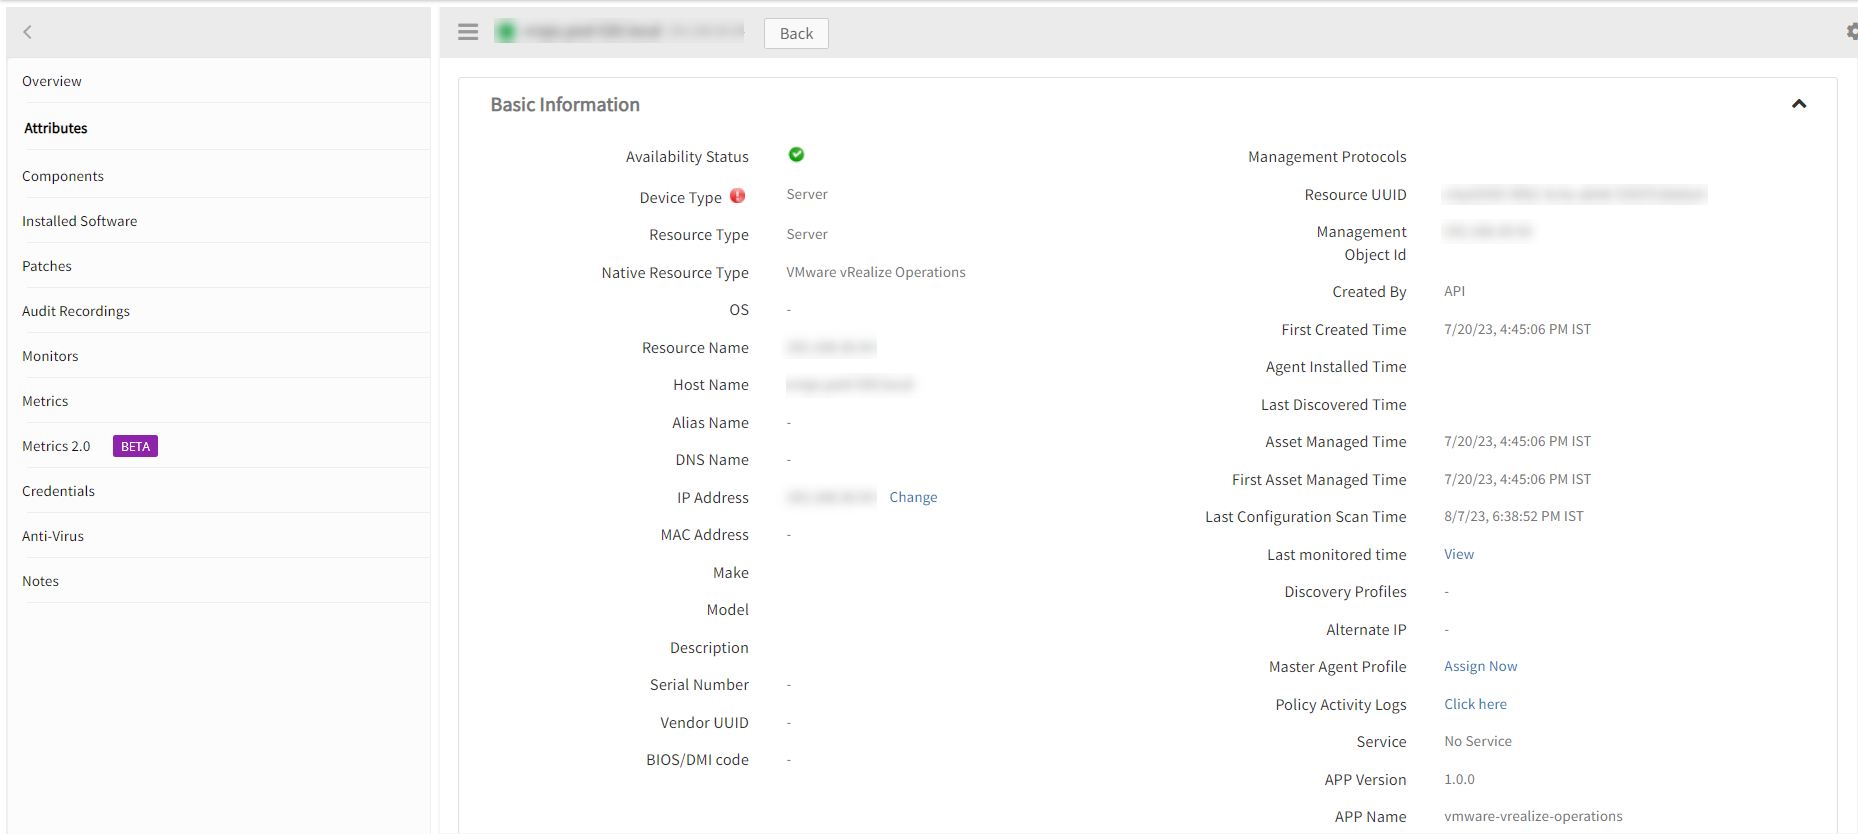
View the VMware vRealize Operations Details
The VMware vRealize Operations integration is displayed in the Infrastructure > Resources > Server. You can navigate to the Attributes tab to view the discovery details and Metrics tab to view the metric details for VMware vRealize Operations.
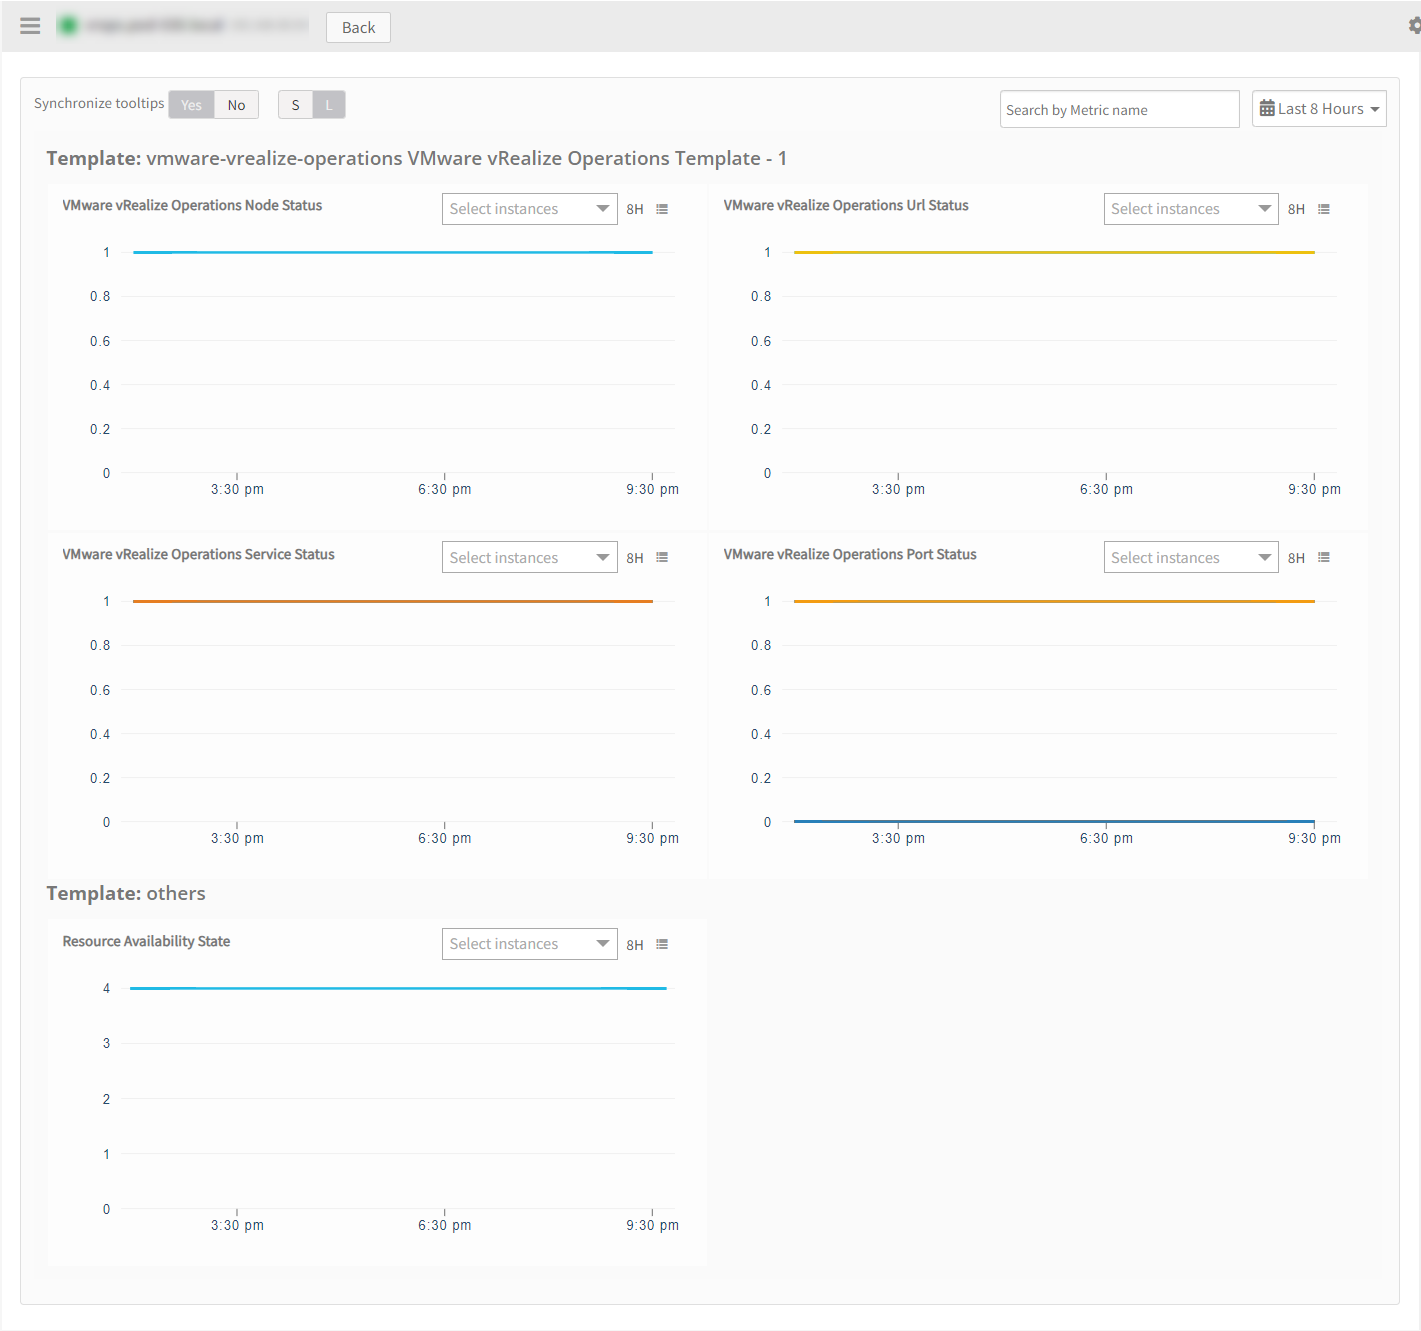
View Resource Metrics
To confirm VMware vRealize Operations monitoring, review the following:
- Metric graphs: A graph is plotted for each metric that is enabled in the configuration.
- Alerts: Alerts are generated for metrics that are configured as defined for integration.
Resource Filter Input Keys
VMware vRealize Orchestrator application Resources are filtered and discovered based on below keys.
Click here to view the Supported Input Keys
| Resource Type | Supported Input Keys |
|---|---|
| All Types | resourceName |
| hostName | |
| ipAddress |
Supported Alert Custom Macros
Customize the alert subject and description with below macros then it will generate alerts based on customisation.
Supported macros keys:
Click here to view the alert subject and description with macros
${resource.name}
${resource.ip}
${resource.type}
Risks, Limitations & Assumptions
- Application can handle Critical/Recovery failure alert notifications for below two cases when user enables Notification Alert in configuration
- Connectivity Exception
- Authentication Exception
- Application will send any duplicate/repeat failure alert notification for every 6 hours.
- Application cannot control monitoring pause/resume actions based on above alerts. Metrics can be used to monitor Vmware vRealize Operations resources and can generate alerts based on the threshold values.
- OpsRamp has provided 22 as default SSH Port value for connecting to VROps end device via SSH. Users can modify this value from the application configuration page at any point of time if required.
- Specify the ports that require monitoring in the Ports to be Monitored section. By default, we are providing the following ports in this field: 1000, 123, 443, 4505, 4506, 5433, 5480, 6061, 7001, 8883, 8999, 9000, 9042.
- Component level thresholds can be configured on each resource level.
- No support of showing activity log and applied time.
- Latest snapshot metric support from Gateway 14.0.0.