Introduction
Multi-node failover cluster Instance
SQL Server clustering describes a collection of two or more physical servers (nodes), connected via LAN, each of which host a SQL server instance and have the same access to shared storage. Clustering SQL servers provides high availability and protection from disasters when a server hosting the SQL Server instance fails.
Always on failover cluster instances
SQL Server Always On Failover Cluster Instances (FCIs) use Windows Server Failover Clustering (WSFC) to provide high availability at the server instance level. An FCI is a single instance of SQL Server that is installed across WSFC nodes to provide high availability for the entire installation of SQL Server.
Always On availability group
Always On availability groups feature a high availability and disaster recovery solution that provides an alternative to database mirroring, and maximizes the availability of a set of user databases for an enterprise. This supports a failover environment for a discrete set of user databases, known as availability databases.
The availability group supports a set of read-write primary databases and one to eight sets of corresponding secondary databases. Optionally, secondary databases can be made available for read-only access and/or some backup operations. Availability group fails over at the level of an availability replica. Failovers are not caused by database issues such as a database becoming suspect due to a loss of a data file, deletion of a database, or corruption of a transaction log.
| Supported Versions |
|---|
| This application is validated on Windows Server 2019 and Microsoft SQL Server 2019 (RTM) - 15.0.2000.5 (X64) for both MSSQL failover instance & availability group clusters. Clustering software used is Microsoft Windows Server Failover Clustering (WSFC). |
Prerequisites
- OpsRamp Classic Gateway (Linux) 15.0.0 and above.
- OpsRamp Nextgen Gateway 15.0.0 and above.
Note: OpsRamp recommends using the latest Gateway version for full coverage of recent bug fixes, enhancements, etc.
- For powershell cmdlets the following are prerequisites:
- Windows domain User should be able to do powershell remoting
Enable-PSRemoting -Force - Windows domain user should be added to Remote Management users group on each cluster node.
net localgroup "Remote Management Users" /add <user> - Add OpsrampGatewayIp to the TrustedHosts list on the target machine to allow the powershell connection from gateway to the target machine on each cluster node.
- To add TrustedHosts use the following command:
- To allow any host:
Set-Item WSMan:\localhost\Client\TrustedHosts -Force -Value * - To allow a specific host:
Set-Item WSMan:\localhost\Client\TrustedHosts -Force -Concatenate -Value <OpsRampGatewayIp>
- To allow any host:
- To add TrustedHosts use the following command:
- Setup and restart the WinRM service for the changes to reflect
- To set up: Set-Service WinRM -StartMode Automatic
- Restart using: Restart-Service -Force WinRM
- Windows domain User should be able to do powershell remoting
- Enable below set of permissions specifically for non-admin/operator user:
- Granting Remote WMI Rights
- Click Start and select Run.
- Enter
wmimgmt.mscand click OK. - Right-click WMI Control (Local) and select Properties.
- Click the Security tab.
- Select Root and click Security.
- Add the user and select the following permissions:
- Execute methods
- Enable account
- Enable remoting
- Read security
- Adding User to "Performance Monitor Users" Group
- Click Start and select Run.
- Enter
lusrmgr.mscand click OK. - In the Groups folder, right-click Performance Monitor Users and select Properties.
- Click the Members tab and click Add.
- Add users.
- Granting Remote WMI Rights
- For monitoring services like windows cluster service and other mssql services (sql server, sql agent , sql browser etc.), windows domain users have to be a part of “Local Administrators group” as we are using win32_Service class for fetching the details.
- refer to below link:
Get-WmiObject - If you do not want to add the user to local administrator group, you can use “Security descriptors” for monitoring the services.
- For that we have to do the configuration as below:
Refer to Windows failover cluster monitoring section of the doc.
- refer to below link:
- Windows domain user should be granted read-only access to cluster
Grant-ClusterAccess -User <domain\user> -Readonly
- Map the Windows domain user account to at least the Cluster Guest role or the Cluster Operator role in Veritas Cluster Server.Note:Windows OS-level administrators (such as domain or local admins) can execute Veritas Cluster commands by default. To access cluster-related information, non-admin users must be added to the Veritas Cluster user list with the appropriate privileges.
- Install and run Veritas Cluster Server (InfoScale Availability) on the target environment, and ensure that CLI tools (
haclus,hasys,hagrp, andhares) are available in the system PATH.For more information, see Veritas Support.
SQL authorization permissions:
- For monitoring some metrics, we are using JDBC. For JDBC connections we are supporting mixed authentication (both NLTM and SQL server authentication)
- The minimum privileges for SQL auth are:
- server role: public - This server role is available by default
- securables: We need to enable some securables for connecting to SQL instances,connecting to all databases, and also some read-only permissions like below:
- CONNECT ANY DATABASE
GRANT CONNECT ANY DATABASE to < user >
- CONNECT SQL
GRANT CONNECT SQL to < user >
- SELECT ALL USER SECURABLES
GRANT SELECT ALL USER SECURABLES to < user >
- VIEW ANY DATABASE
GRANT VIEW ANY DATABASE to < user >
- VIEW ANY DEFINITION
GRANT VIEW ANY DEFINITION to < user >
- VIEW SERVER STATE
GRANT VIEW SERVER STATE to < user >
Hierarchy of MSSQL Cluster resources
In configuration page, we have provided the one field which is MSSQL Type,
- If you select MSSQL Type as CLUSTER, Application will discover the Mssql Cluster Related Resources.
- MSSQL Windows Failover Cluster
- MSSQL Windows Failover Cluster Node
- MSSQL Windows Failover Cluster Role
- MSSQL Cluster Shared Volume
- MSSQL Windows Failover Cluster Storage Disk
- MSSQL Server Instance
- MSSQL Server Database
- If you select MSSQL Type as STANDALONE, application can discover the MSSQL Single Node Related Resources.
- MSSQL Node
- MSSQL Node Server Instance
- MSSQL Server Database
- MSSQL Node Server Instance
- If you select MSSQL Type as VERITAS CLUSTER, the application will discover the following MSSQL Cluster related resources:
- MSSQL Windows Failover Cluster
- MSSQL Windows Failover Cluster Node
- MSSQL Windows Service Group
- MSSQL Cluster Shared Volume
- MSSQL Windows Failover Cluster Storage Disk
- MSSQL Server Instance
- MSSQL Server Database
Supported Metrics
Click here to view the supported metrics
| Native Type | Metric Names | Display Name | Unit | Application Version | Description |
|---|---|---|---|---|---|
| MSSQL Windows Service Group | mssql_cluster_serviceGroup_Status | MSSQL Windows Service Group Status | 6.0.0 | State of cluster group of the failover cluster. Possible values 0-OFFLINE,1-ONLINE, 2-Initializing, 3-Failed, 4-Pending, 5-OnlinePending, 6-OfflinePending, 7-Unknown. | |
| mssql_cluster_serviceGroup_FailoverStatus | MSSQL Windows Service Group FailOver Status | 6.0.0 | Whenever the owner node which is hosting all the cluster services, goes down any other node becomes owner node automatically. | ||
| MSSQL Server Database | mssql_sqlserver_databasepageReads | MSSQL Databases Page Reads | rps | 5.0.0 | Number of physical database page reads issued. |
| mssql_sqlserver_databasepageWrites | MSSQL Database Page Writes | wps | 5.0.0 | Number of physical database page writes issued. | |
| mssql_sqlserver_databaseTransactions | MSSQL Database Transactions | psec | 5.0.0 | The number of transactions started for the database. | |
| mssql_sqlserver_databaseStatus | MSSQL Database Status | 5.0.0 | 0 = ONLINE, 1 = RESTORING, 2 = RECOVERING SQL Server 2008 and later, 3 = RECOVERY_PENDING SQL Server 2008 and later, 4 = SUSPECT, 5 = EMERGENCY SQL Server 2008 and later, 6 = OFFLINE SQL Server 2008 and later, 7 = COPYING Azure SQL Database Active Geo-Replication, 10 = OFFLINE_SECONDARY Azure SQL Database Active Geo-Replication. | ||
| mssql_sqlserver_databaseActiveUsers | MSSQL Database Active Users | count | 5.0.0 | Monitors the number of active user transactions per database. | |
| mssql_sqlserver_databaseFreeSpace | MSSQL Database Free Space | % | 5.0.0 | Monitors Database Freespace in Percentage | |
| mssql_sqlserver_alwayson_database_replicaState | MSSQL AlwaysOn DataBase Replica State | 5.0.0 | It monitor the MSSQL Always On Database Replica synchronization state along with role description. Below are the possible states: PRIMARY_NOT SYNCHRONIZING - 0, PRIMARY_SYNCHRONIZING - 1, PRIMARY_SYNCHRONIZED - 2, PRIMARY_REVERTING - 3, PRIMARY_INITIALIZING - 4, SECONDARY_NOT SYNCHRONIZING - 5, SECONDARY_SYNCHRONIZING - 6, SECONDARY_SYNCHRONIZED - 7, SECONDARY_REVERTING - 8, SECONDARY_INITIALIZING - 9. This metric is applicable only for AAG clusters. | ||
| mssql_sqlserver_database_snapshotIsolationState | MSSQL Database Snapshot Isolation State | 5.0.0 | It monitors the MSSQL Snapshot Isolation State. Below are the possible states: OFF - 0, ON - 1. | ||
| mssql_sqlserver_dbBufferCacheHitRatio | MSSQL Database Buffer Cache Hit Ration | % | 5.0.0 | Percentage of pages that were found in the buffer pool without having to incur a read from disk. | |
| mssql_sqlserver_dbFileGroupFreespaceWithAvailableDisk | MSSQL Database File Group Free Space with Available Disk | % | 5.0.0 | Monitor MSSQL DB Filegroup Freespace with Available Disk. | |
| mssql_sqlserver_dbFileGroupFreespace | MSSQL DB File Group Free Space | % | 5.0.0 | Monitors MSSQL DB Filegroup Freespace. | |
| mssql_sqlserver_dbLogCacheHitRatio | MSSQL DB Log Cache Hit Ratio | % | 5.0.0 | Monitors MSSQL database log cache-hit ratio. | |
| mssql_sqlserver_dbLogfilesFreeSpace | MSSQL DB Logfiles Free Space | % | 5.0.0 | Monitors MSSQL database LogFiles free space. | |
| mssql_sqlserver_logfileFreespaceWithAvailableDisk | MSSQL Database Logfile Free Space with Available Disk | % | 5.0.0 | Monitors MSSQL DB Log File Freespace with Available Disk in percentage. | |
| MSSQL Windows Failover Cluster | mssql_cluster_node_state | MSSQL Windows Failover Cluster Node State | 1.0.1 | State of all nodes of the cluster such as up or down. Possible values 0-DOWN, 1-UP. | |
| mssql_cluster_online_nodes_count | MSSQL Windows Failover Cluster Online nodes count | count | 1.0.1 | Count of nodes which are in Online state. | |
| mssql_cluster_node_health | MSSQL Windows Failover Cluster Node Health | % | 1.0.1 | Cluster health - percentage of online nodes. | |
| MSSQL Windows Failover Cluster Node | mssql_cluster_node_service_status | MSSQL Windows Cluster Node Service Status | 1.0.1 | State of each node's windows os service named cluster service which is responsible for windows failover cluster. Possible values 0-STOPPED, 1-RUNNING,2-Start Pending, 3-Stop Pending, 4-Continue Pending, 5-Pause Pending, 6-Paused, 7-Unknown. | |
| mssql_cluster_node_system_os_Uptime | MSSQL Windows Cluster Node System OS Uptime | m | 1.0.1 | Time lapsed since last reboot in minutes | |
| mssql_cluster_node_system_cpu_Load | MSSQL Windows Cluster Node System CPU Load | 1.0.1 | Monitors the system's last 1min, 5min and 15min load. It sends per cpu core load average. | ||
| mssql_cluster_node_system_cpu_Utilization | MSSQL Windows Cluster Node System CPU Utilization | % | 1.0.1 | The percentage of elapsed time that the processor spends to execute a non-Idle thread(This doesn't includes CPU steal time). | |
| mssql_cluster_node_system_memory_Usedspace | MSSQL Windows Cluster Node System Memory Used Space | GB | 1.0.1 | Physical and virtual memory usage in GB. | |
| mssql_cluster_node_system_cpu_IdleTime | MSSQL Windows Cluster Node System CPU IdleTime | % | 1.0.1 | Monitors cpu time in percentage spent in various program spaces. User - The processor time spent running user space processes. System - The amount of time that the CPU spent running the kernel. IOWait - The time the CPU spends idle while waiting for an I/O operation to complete. Idle - The time the processor spends idle. Steal - The time virtual CPU has spent waiting for the hypervisor to service another virtual CPU running on a different virtual machine. Kernal Time Total Time. | |
| mssql_cluster_node_system_networkInterfaceInTraffic | MSSQL Windows Cluster Node System Network In Traffic | Kbps | 2.0.0 | Monitors In traffic of each interface for windows Devices. | |
| mssql_cluster_node_system_networkInterfaceOutTraffic | MSSQL Windows Cluster Node System Network Out Traffic | Kbps | 2.0.0 | Monitors Out traffic of each interface for windows Devices. | |
| mssql_cluster_node_system_networkInterfaceInPackets | MSSQL Windows Cluster Node System Network In packets | packets/sec | 2.0.0 | Monitors in Packets of each interface for windows Devices. | |
| mssql_cluster_node_system_networkInterfaceOutPackets | MSSQL Windows Cluster Node System Network out packets | packets/sec | 2.0.0 | Monitors Out packets of each interface for windows Devices. | |
| mssql_cluster_node_system_networkInterfaceInErrors | MSSQL Windows Cluster Node System Network In Errors | Errors per Sec | 2.0.0 | Monitors network in errors of each interface for windows Devices. | |
| mssql_cluster_node_system_networkInterfaceOutErrors | MSSQL Windows Cluster Node System Network Out Errors | Errors per Sec | 2.0.0 | Monitors network out errors of each interface for windows Devices. | |
| mssql_cluster_node_system_networkInterfaceInDiscords | MSSQL Windows Cluster Node System Network In discards | psec | 2.0.0 | Monitors Network in discards of each interface for windows Devices. | |
| mssql_cluster_node_system_networkInterfaceOutDiscords | MSSQL Windows Cluster Node System Network Out discards | psec | 2.0.0 | Monitors Network Out discards of each interface for windows Devices. | |
| mssql_cluster_node_sqlservices_state | MSSQL Windows Cluster Node SQL services running state | 1.0.1 | Monitors sql services state. Possible values 0-STOPPED, 1-RUNNING, 2-Start Pending, 3-Stop Pending, 4-Continue Pending, 5-Pause Pending, 6-Paused, 7-Unknown. | ||
| mssql_cluster_node_sqlprocesses_cpuUsage | MSSQL Windows Cluster Node SQL processes CPU usage in Seconds | s | 1.0.1 | Monitors sql processes cpu usage in seconds. | |
| mssql_cluster_node_sqlprocesses_handles | MSSQL Windows Cluster Node SQL processes number of handles | count | 1.0.1 | Monitors sql processes handles count. | |
| mssql_cluster_node_system_memory_Utilization | MSSQL Windows Cluster Node System Memory Utilization | % | 1.0.1 | Physical and virtual memory usage in percentage. | |
| MSSQL Windows Failover Cluster Role | mssql_cluster_group_running_status | MSSQL Windows Cluster Group Running Status | 1.0.1 | State of cluster group of the failover cluster. Possible values 0-OFFLINE, 1-ONLINE, 2-Initializing, 3-Failed, 4-Pending, 5-OnlinePending, 6-OfflinePending, 7-Unknown. | |
| mssql_cluster_group_failover_status | MSSQL Windows Cluster Group Failover Status | 1.0.1 | Any other node immediately becomes owner node whenever the owner node hosting all of the cluster services goes down. This metric indicates whether the present node was the owner node during the last failover. Possible instance values, 0-if there is no change in OwnerNode, 1-If there is a change in OwnerNode, 2-If no OwnerNode. | ||
| mssql_cluster_group_listener_status | MSSQL Windows cluster group listener status | 1.0.1 | Monitors MSSQL cluster group listeners status. Possible values 0-OFFLINE, 1-ONLINE, 2-Initializing, 3-Failed, 4-Pending, 5-OnlinePending, 6-OfflinePending, 7-Unknown. | ||
| mssql_cluster_AG_instance_status | MSSQL Windows cluster availability group instance status | 1.0.1 | Monitors MSSQL availability group cluster instance status. Possible values 0-OFFLINE,1-ONLINE 2-Initializing, 3-Failed, 4-Pending, 5-OnlinePending, 6-OfflinePending, 7-Unknown. This metric is applicable only for AAG clusters.Note: Applicable for only `AvailabilityGroup` cluster | ||
| MSSQL Windows Failover Cluster Storage Disk | mssql_cluster_disk_AvailabilityStatus | MSSQL Windows System Disk availability status | 1.0.1 | Monitors system disk availability status. Possible values 0-OFFLINE, 1-ONLINE, 2-Initializing, 3-Failed, 4-Pending, 5-OnlinePending, 6-OfflinePending, 7-Unknown. | |
| mssql_cluster_disk_FailoverStatus | MSSQL Windows System Disk Failover status | 1.0.1 | When the storage disc host owner node fails, any other node immediately takes over as owner node. This measurement indicates whether the present node was the owner node during the last failover. Possible instance values, 0-if there is no change in OwnerNode, 1-If there is a change in OwnerNode, 2-If no OwnerNode. | ||
| mssql_cluster_disk_Usedspace | MSSQL Windows System Disk UsedSpace | GB | 1.0.1 | Monitors disk used space in GB. | |
| mssql_cluster_disk_Utilization | MSSQL Windows System Disk Utilization | % | 1.0.1 | Monitors disk utilization in percentage. | |
| mssql_cluster_disk_Freespace | MSSQL Windows System Disk FreeSpace | GB | 1.0.1 | Monitors the Free Space usage in GB. | |
| MSSQL Server Instance | mssql_cluster_instance_RunningStatus | MSSQL Cluster Instance Running Status | 1.0.1 | Monitors MSSQL failover cluster instance running status. Possible values 0-OFFLINE, 1-ONLINE, 2-Initializing, 3-Failed, 4-Pending, 5-OnlinePending, 6-OfflinePending, 7-Unknown. | |
| mssql_cluster_instance_FailoverStatus | MSSQL Cluster Instance Failover Status | 1.0.1 | Monitors MSSQL cluster instance failover status. Possible instance values, 0-if there is no change in OwnerNode, 1-If there is a change in OwnerNode, 2-If no OwnerNode. This metric is applicable only for FCI clusters. | ||
| mssql_cluster_avgLockWaitTime | MSSQL Cluster Average Lock Wait Time | ms | 1.0.1 | The average amount of wait time (milliseconds) for each lock request that resulted in a wait. | |
| mssql_cluster_sqlCacheMemory | MSSQL Cluster Cache Memory | KB | 1.0.1 | Total amount of dynamic memory the server is using for the dynamic SQL cache. | |
| mssql_cluster_datafileSize | MSSQL Cluster Data File Size | KB | 1.0.1 | The cumulative size of all the data files in the database. | |
| mssql_cluster_databasesCount | MSSQL Cluster Databases Count | count | 1.0.1 | Show the count of total number of databases. | |
| mssql_cluster_fullScans | MSSQL Cluster SQL Server Full Scans | psec | 1.0.1 | Number of unrestricted full scans. These can either be base tables or full index scans. | |
| mssql_cluster_serverUptime | MSSQL Cluster Server Uptime | Days | 1.0.1 | Monitors the uptime (in days) of the database server. | |
| mssql_cluster_totalServerMemory | MSSQL Cluster Total Server Memory | KB | 1.0.1 | Total amount of dynamic memory the server is currently consuming | |
| mssql_cluster_datafilesFreeSpace | MSSQL Cluster Data Files Free Space | % | 1.0.1 | Monitors datafiles free space regardless of auto-growth. | |
| mssql_cluster_minsSinceLastLogBackup | MSSQL Cluster Mins since Last Log Backup | m | 1.0.1 | Monitors Database transaction log backup in minutes. | |
| mssql_cluster_minsSinceLastLogFullBackup | MSSQL Cluster Mins since Last Log Full Backup | m | 1.0.1 | Monitors Database Backup status in Minutes since Last Full Backup. | |
| mssql_cluster_longRunningQueriesLast5minCount | MSSQL Cluster Long Running Queries Last 5min Count | count | 1.0.1 | Monitors MSSQL Database Long Running queries count Last 5 minutes. | |
| mssql_cluster_serverIOBusy | MSSQL Cluster Server IO Busy | % | 1.0.1 | Monitors MSSQL DB Server IO Busy. | |
| mssql_cluster_dbWorkspaceMemory | MSSQL Cluster DB Workspace Memory | % | 1.0.1 | Monitors MSSQL Database Workspace Memory in Percentage. | |
| mssql_cluster_dbInstanceCpuUtilization | MSSQL Cluster DB Instance CPU Utilization | % | 1.0.1 | Monitors MSSQL Database Instance CPU Utilization in percentage. | |
| mssql_cluster_instanceFreeConnections | MSSQL Cluster Instance Free Connections | % | 1.0.1 | Monitors MSSQL Database Instance Free Connections in percentage. | |
| mssql_cluster_daysSinceLastFullBackup | MSSQL Cluster Days since Last Full Backup | Days | 1.0.1 | MSSQL DB Backup Days Since Last Full Backup. | |
| mssql_cluster_daysSinceLastLogBackup | MSSQL Cluster Days since Last Log Backup | Days | 1.0.1 | MSSQL DB Backup Days Since Last Log Backup. | |
| mssql_cluster_daysSinceLastDifferentialBackup | MSSQL Cluster Days since Last Differential Backup | Days | 1.0.1 | MSSQL DB Backup Days Since Last Differential Backup. | |
| mssql_cluster_alwaysOnDBAvailabilitySyncHealth | MSSQL Cluster AlwaysOn DB Avalability Sync Health | 1.0.1 | MSSQL AlwaysOn DataBase Availability Synchronization Health, below are the possible states: 0 : NOT_HEALTHY, 1 : PARTIALLY_HEALTHY, 2 : HEALTHY. This metric is applicable only for AAG clusters. | ||
| mssql_cluster_alwaysOnAGSyncHealth | MSSQL Cluster AlwaysOn AG Sync Health | 1.0.1 | MSSQL AlwaysOn Availability Group Synchronization Health, below are the possible values: 0 : NOT_HEALTHY, 1 : PARTIALLY_HEALTHY, 2 : HEALTHY. This metric is applicable only for AAG clusters. | ||
| mssql_cluster_alwaysOnListenerState | MSSQL Cluster AlwaysOn Listener State | 1.0.1 | MSSQL AlwaysOn Listener State, below are the possible values: 0 : OFFLINE, 1 : ONLINE, 2 : ONLINE_PENDING, 3 : FAILED. This metric is applicable only for AAG clusters. | ||
| mssql_cluster_cpuBusy | MSSQL Cluster CPU Busy | microsec | 1.0.1 | MSSQL CPU Busy | |
| mssql_cluster_cpuIdle | MSSQL Cluster CPU Idle | microsec | 1.0.1 | MSSQL CPU IDLE | |
| mssql_cluster_cpuIOBusy | MSSQL Cluster CPU IO Busy | microsec | 1.0.1 | MSSQL CPU IoBusy | |
| MSSQL Cluster Shared Volume | mssql_cluster_shared_volume_Utilization | Mssql CSV Utilization | % | 2.0.0 | Mssql cluster shared volume utilization in percentage. |
| mssql_cluster_shared_volume_Usage | Mssql CSV Usage | GB | 2.0.0 | Mssql cluster shared volume usage in GB. | |
| mssql_cluster_shared_volume_OperationalStatus | Mssql CSV Operational Status | 2.0.0 | Mssql cluster shared volume operational status. Possible values - Offline : 0,Failed : 1,Inherited : 2,Initializing : 3,Pending : 4,OnlinePending : 5,OfflinePending : 6,Unknown : 7,Online : 8. | ||
| MSSQL Node | mssql_node_system_OsUptime | MSSQL Node System OS Uptime | m | 3.0.0 | Time lapsed since last reboot in minutes. |
| mssql_node_system_CpuLoadAverage | MSSQL Node System CPU Load | 3.0.0 | Monitors the system's last 1min, 5min and 15min load. It sends per cpu core load average. | ||
| mssql_node_system_CpuUtilization | MSSQL Node System CPU Utilization | % | 3.0.0 | The percentage of elapsed time that the processor spends to execute a non-Idle thread(This doesn't includes CPU steal time) | |
| mssql_node_system_MemoryUsedspace | MSSQL Node System Memory Used Space | GB | 3.0.0 | Physical and virtual memory usage in GB. | |
| mssql_node_system_CpuIdleTime | MSSQL Node System CPU IdleTime | % | 3.0.0 | Monitors cpu time in percentage spent in various program spaces. User - The processor time spent running user space processes System - The amount of time that the CPU spent running the kernel. IOWait - The time the CPU spends idle while waiting for an I/O operation to complete Idle - The time the processor spends idle Steal - The time virtual CPU has spent waiting for the hypervisor to service another virtual CPU running on a different virtual machine. Kernal Time Total Time. | |
| mssql_node_system_NetworkInterfaceInTraffic | MSSQL Node System Network In Traffic | Kbps | 3.0.0 | Monitors In traffic of each interface for windows Devices. | |
| mssql_node_system_NetworkInterfaceOutTraffic | MSSQL Node System Network Out Traffic | Kbps | 3.0.0 | Monitors Out traffic of each interface for windows Devices. | |
| mssql_node_system_NetworkInterfaceInPackets | MSSQL Node System Network Out Traffic | packets/sec | 3.0.0 | Monitors in Packets of each interface for windows Devices. | |
| mssql_node_system_NetworkInterfaceOutPackets | MSSQL Node System Network out packets | packets/sec | 3.0.0 | Monitors Out packets of each interface for windows Devices. | |
| mssql_node_system_NetworkInterfaceInErrors | MSSQL Node System Network In Errors | Errors per Sec | 3.0.0 | Monitors network in errors of each interface for windows Devices. | |
| mssql_node_system_NetworkInterfaceOutErrors | MSSQL Node System Network Out Errors | Errors per Sec | 3.0.0 | Monitors network out errors of each interface for windows Devices. | |
| mssql_node_system_NetworkInterfaceInDiscords | MSSQL Node System Network In discards | psec | 3.0.0 | Monitors Network in discards of each interface for windows Devices. | |
| mssql_node_system_NetworkInterfaceOutDiscords | MSSQL Node System Network Out discards | psec | 3.0.0 | Monitors Network Out discards of each interface for windows Devices. | |
| mssql_node_SqlServicesState | MSSQL Node SQL services running state | 3.0.0 | Monitors sql services state. Possible values 0-STOPPED,1-RUNNING,2-Start Pending, 3-Stop Pending, 4-Continue Pending, 5-Pause Pending, 6-Paused, 7-Unknown. | ||
| mssql_node_system_MemoryUtilization | MSSQL Node System Memory Utilization | % | 3.0.0 | Physical and virtual memory usage in percentage. | |
| mssql_node_diskdrive_UsedSpace | MSSQL Node Disk Drive UsedSpace | GB | 3.0.0 | Monitors disk drive used space in GB. | |
| mssql_node_diskdrive_Utilization | MSSQL Node Disk Drive Utilization | % | 3.0.0 | Monitors disk drive utilization in percentage. | |
| mssql_node_diskdrive_FreeSpace | MSSQL Node Disk Drive FreeSpace | GB | 3.0.0 | Monitors the disk drive Free Space usage in GB | |
| MSSQL Node Server Instance | mssql_node_sqlinstance_AvgLockWaitTime | MSSQL Node SQL Instance Average Lock Wait Time | ms | 3.0.0 | The average amount of wait time (milliseconds) for each lock request that resulted in a wait. |
| mssql_node_sqlinstance_SqlCacheMemory | MSSQL Node SQL Instance Cache Memory | KB | 3.0.0 | Total amount of dynamic memory the server is using for the dynamic SQL cache. | |
| mssql_node_sqlinstance_DataFileSize | MSSQL Node SQL Instance Data File Size | KB | 3.0.0 | The cumulative size of all the data files in the database. | |
| mssql_node_sqlinstance_DatabasesCount | MSSQL Node SQL Instance Databases Count | count | 3.0.0 | Show the count of total number of databases. | |
| mssql_node_sqlinstance_FullScans | MSSQL Node SQL Server Full Scans | psec | 3.0.0 | Number of unrestricted full scans. These can either be base table or full index scans. | |
| mssql_node_sqlinstance_ServerUptime | MSSQL Node SQL Instance Server Uptime | Days | 3.0.0 | Monitors the uptime (in days) of the database server. | |
| mssql_node_sqlinstance_TotalServerMemory | MSSQL Node SQL Instance Total Server Memory | KB | 3.0.0 | Total amount of dynamic memory the server is currently consuming. | |
| mssql_node_sqlinstance_DataFilesFreeSpace | MSSQL Node SQL Instance Data Files Free Space | % | 3.0.0 | Monitors datafiles free space regardless of auto-growth. Note: This metric will be available under new native type “MSSQL Server Database” from 5.0.0 version onwards. | |
| mssql_node_sqlinstance_MinsSinceLastLogBackup | MSSQL Node SQL Instance Mins since Last Log Backup | m | 3.0.0 | Monitors Database transaction log backup in minutes. | |
| mssql_node_sqlinstance_MinsSinceLastLogFullBackup | MSSQL Node SQL Instance Mins since Last Log Full Backup | m | 3.0.0 | Monitors Database Backup status in Minutes since Last Full Backup. | |
| mssql_node_sqlinstance_LongRunningQueriesLast5minCount | MSSQL Node SQL Instance Long Running Queries Last 5min Count | count | 3.0.0 | Monitors MSSQL Database Long Running queries count Last 5 minutes. | |
| mssql_node_sqlinstance_ServerIOBusy | MSSQL Node SQL Instance Server IO Busy | % | 3.0.0 | Monitors MSSQL DB Server IO Busy. | |
| mssql_node_sqlinstance_DbWorkspaceMemory | MSSQL Node SQL Instance DB Workspace Memory | % | 3.0.0 | Monitors MSSQL Database Workspace Memory in Percentage. | |
| mssql_node_sqlinstance_DbInstanceCpuUtilization | MSSQL Node SQL Instance DB Instance CPU Utilization | % | 3.0.0 | Monitors MSSQL Database Instance CPU Utilization in percentage. | |
| mssql_node_sqlinstance_InstanceFreeConnections | MSSQL Node SQL Instance Free Connections | % | 3.0.0 | Monitors MSSQL Database Instance Free Connections in percentage. | |
| mssql_node_sqlinstance_DaysSinceLastFullBackup | MSSQL Node SQL Instance Days since Last Full Backup | Days | 3.0.0 | MSSQL DB Backup Days Since Last Full Backup | |
| mssql_node_sqlinstance_DaysSinceLastLogBackup | MSSQL Node SQL Instance Days since Last Log Backup | Days | 3.0.0 | MSSQL DB Backup Days Since Last Log Backup | |
| mssql_node_sqlinstance_DaysSinceLastDifferentialBackup | MSSQL Node SQL Instance Days since Last Differential Backup | Days | 3.0.0 | MSSQL DB Backup Days Since Last Differential Backup. | |
| mssql_node_sqlinstance_AlwaysOnDBAvailabilitySyncHealth | MSSQL Node SQL Instance AlwaysOn DB Avalability Sync Health | 3.0.0 | MSSQL AlwaysOn DataBase Availability Synchronization Health - Below are the possible states:0 : NOT_HEALTHY 1 : PARTIALLY_HEALTHY 2 : HEALTHYNote: Applicable for only `AvailabilityGroup` cluster | ||
| mssql_node_sqlinstance_AlwaysOnAGSyncHealth | MSSQL Node SQL Instance AlwaysOn AG Sync Health | 3.0.0 | MSSQL AlwaysOn Availability Group Synchronization Health - Below are the possible values: 0 : NOT_HEALTHY 1 : PARTIALLY_HEALTHY 2 : HEALTHYNote: Applicable for only `AvailabilityGroup` cluster | ||
| mssql_node_sqlinstance_AlwaysOnListenerState | MSSQL Node SQL Instance AlwaysOn Listener State | 3.0.0 | MSSQL AlwaysOn Listener State - Below are the possible values: 0 : OFFLINE 1 : ONLINE 2 : ONLINE_PENDING 3 : FAILEDNote: Applicable for only `AvailabilityGroup` cluster | ||
| mssql_node_sqlinstance_CpuBusy | MSSQL Node SQL Instance CPU Busy | microsec | 3.0.0 | MSSQL CPU Busy | |
| mssql_node_sqlinstance_CpuIdle | MSSQL Node SQL Instance CPU Idle | microsec | 3.0.0 | MSSQL CPU IDLE | |
| mssql_node_sqlinstance_CpuIOBusy | MSSQL Node SQL Instance CPU IO Busy | microsec | 3.0.0 | MSSQL CPU IoBusy. | |
| mssql_node_sqlinstance_AlwaysOnDatabaseReplicaState | MSSQL Node SQL Instance AlwaysOn DataBase Replica State | 3.0.0 | It monitor the MSSQL Always On Database Replica synchronization state along with role description.--Below are the possible states:--PRIMARY_NOT SYNCHRONIZING - 0-PRIMARY_SYNCHRONIZING - 1-PRIMARY_SYNCHRONIZED - 2-PRIMARY_REVERTING - 3-PRIMARY_INITIALIZING - 4-SECONDARY_NOT SYNCHRONIZING - 5-SECONDARY_SYNCHRONIZING - 6-SECONDARY_SYNCHRONIZED - 7-SECONDARY_REVERTING - 8-SECONDARY_INITIALIZING - 9.Note: Applicable for only `AvailabilityGroup` cluster. Note: This metric will be available under new native type MSSQL Server Database from 5.0.0 version onwards |
Default Monitoring Configurations
mssql-cluster has default Global Device Management Policies, Global Templates, Global Monitors and Global metrics in OpsRamp. You can customize these default monitoring configurations as per your business use cases by cloning respective global templates and global Device Management Policies. OpsRamp recommends performing the below activity before installing the application to avoid noise alerts and data.
Default Global Device Management Policies
You can find the Device Management Policy for each Native Type at Setup > Resources > Device Management Policies. Search with suggested names in global scope:
{appName nativeType - version - MSSQL Type}Ex: mssql-cluster MSSQL Windows Failover Cluster - 1 - CLUSTER (i.e, appName = mssql-cluster, nativeType =MSSQL Windows Failover Cluster, version = 1 , MSSQL Type = CLUSTER)
Default Global Templates
You can find the Global Templates for each Native Type at Setup > Monitoring > Templates. Search with suggested names in global scope. Each template adheres to the following naming convention:
{appName MSSQL Type nativeType 'Template' - version}Ex: mssql-cluster CLUSTER MSSQL Windows Failover Cluster Template - 1 (i.e, appName = mssql-cluster ,MSSQL Type=CLUSTER, nativeType = MSSQL Windows Failover Cluster, version = 1)
Default Global Monitors
You can find the Global Monitors for each Native Type at Setup > Monitoring > Monitors. Search with suggested names in global scope. Each Monitors adheres to the following naming convention:
{monitorKey appName nativeType - version}Ex: MSSQL Windows Failover Cluster Monitor mssql-cluster MSSQL Windows Failover Cluster 1 (i.e, monitorKey = MSSQL Windows Failover Cluster Monitor, appName = mssql-cluster , nativeType = MSSQL Windows Failover Cluster , version= 1)
Configure and Install the MS SQL Cluster Integration
- From All Clients, select a client.
- Go to Setup > Account.
- Select the Integrations and Apps tab.
- The INSTALLED INTEGRATIONS page, where all the installed applications are displayed.
Note: If there are no installed applications, it will navigate to the Available Integrations and Apps page. - Click + ADD on the INSTALLED INTEGRATIONS page. The AVAILABLE INTEGRATIONS AND APPS page displays all the available applications along with the newly created application with the version.
Note: You can even search for the application using the search option available. Also you can use the All Categories option to search. - Click ADD in the MS SQL Cluster application.
- In the Configurations page, click + ADD. The Add Configuration page appears.
- Enter the following BASIC INFORMATION:
| Field Name | Field Type | Field Dependency | Description |
|---|---|---|---|
| Name | String | NA | Enter the name for the integration. |
| MSSQL Type* | Dropdown | N/A | Select the type of Microsoft SQL Server instance you are integrating. The options availble are:
|
| IpAddress/HostName* | Text | N/A | Enter the IP address or hostname of the cluster if the MSSQL Type is set to CLUSTER. If the MSSQL Type is set to STANDALONE, enter the IP address or hostname of the individual node instead. |
| MSSQL Cluster Type | Dropdown | Appears only when Cluster is selected in the MSSQL Type field. | Select the type of SQL Server cluster configuration being integrated. The options available are:
|
| MSSQL Cluster / Node Credentials* | Dropdown | N/A | Select the the authentication details required to connect to the SQL Server cluster or its individual nodes. You can either select from the dropdown if the credentials are existing. Else click +ADD to create credentials. In the ADD CREDENTIAL window enter the following:
|
| SQL Server Authentication Mode | Checkbox | N/A | Indicates whether SQL Server Authentication is used for connecting to the SQL Server instance.
|
| SQL Server Credentials | Dropdown | N/A | Select the SQL Server credentials from the dropdown.You can either select from the dropdown if the credentials are existing. Else click +ADD to create credentials. In the ADD CREDENTIAL window enter the following:
|
| App Failure Notifications | Checkbox | N/A | This checkbox is used to confirm whether a notification should be sent in the event of an app failure due to authentication or connection-related exceptions.
|
| Request Timeouts | Checkbox | N/A | Selecting this checkbox enables you to configure the timeout settings for NativeBridge connections and script execution requests made by the integration to the end device. |
| Connection TimeOut In Mins | Dropdown | N/A | Select the maximum time, in minutes, that the integration should wait while establishing a connection with the nativeBridge. Default value: 10 minutes. |
| Connection Request TimeOut In Min | Dropdown | N/A | Select the maximum time, in minutes, required to process a NativeBridge HTTP call, from sending the request to receiving the response. Default value: 10 minutes. |
| Socket Timeout In Mins | Dropdown | N/A | Select the maximum allowable time of inactivity between two data packets during data exchange with the server. Default value: 10 minutes. |
| Script Execution TimeOut In Mins | Dropdown | N/A | Select the maximum time, in minutes, that the integration should wait while establishing a connection with the nativeBridge. Default value: 10 minutes. |
- Select the below mentioned Custom Attribute:
| Field Name | Field Type | Field Dependency | Description |
|---|---|---|---|
| Custom Attribute | Dropdown | N/A | Select the custom attribute from the dropdown. |
| Value | Dropdown | N/A | Select the value from the dropdown. |
Note: The custom attribute that you add here will be assigned to all the resources that are created by the integration. You can add a maximum of five custom attributes (key and value pair).
- In the RESOURCE TYPE section, select:
- ALL: All the existing and future resources will be discovered.
- SELECT: You can select one or multiple resources to be discovered.
- In the DISCOVERY SCHEDULE section, select Recurrence Pattern to add one of the following patterns:
- Minutes
- Hourly
- Daily
- Weekly
- Monthly
- Click ADD.

Note
Sample values shown in the configuration fields are for illustration purposes only. Use your actual integration details when configuring.Now the configuration is saved and displayed on the configurations page after you save it.
Note: From the same page, you may Edit and Remove the created configuration.
- Click Next.
- Below are the optional steps you can perform on the Installation page.
Under the ADVANCED SETTINGS, Select the Bypass Resource Reconciliation option, if you wish to bypass resource reconciliation when encountering the same resources discovered by multiple applications.
Note: If two different applications provide identical discovery attributes, two separate resources will be generated with those respective attributes from the individual discoveries.

- Click +ADD to create a new collector by providing a name or use the pre-populated name.
- Select an existing registered profile.
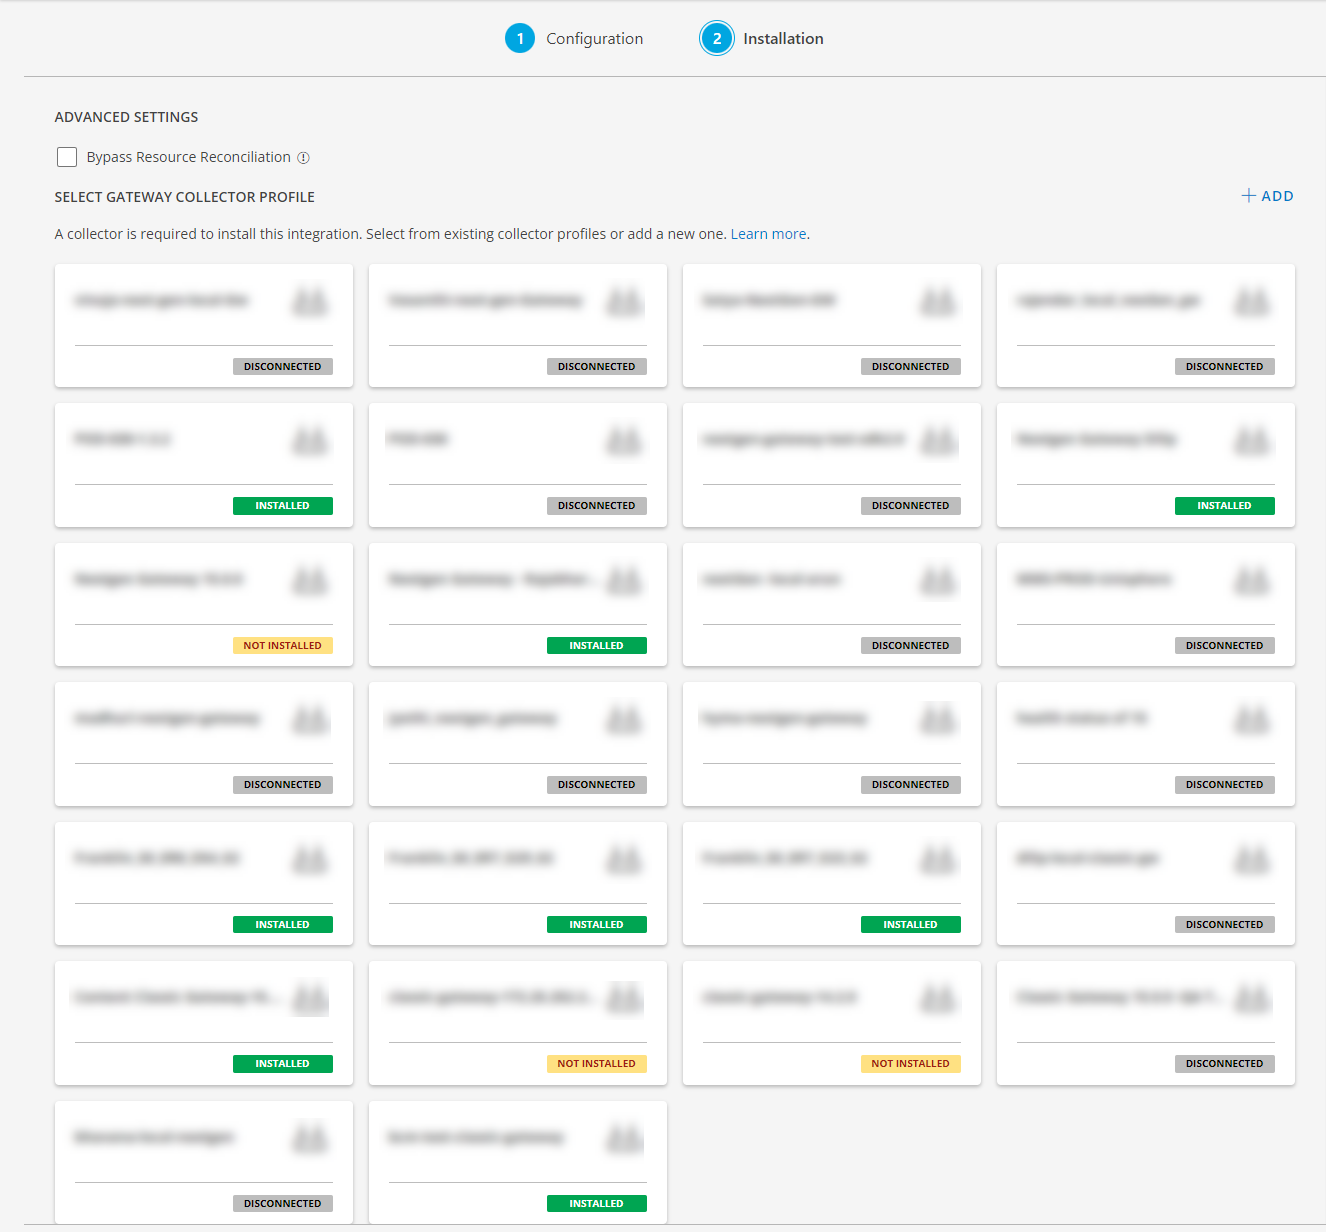
- Click FINISH.
The application is now installed and displayed on the INSTALLED INTEGRATION page. Use the search field to find the installed application.
Modify the Configuration
See Modify an Installed Integration or Application article.
Note: Select the MS SQL Cluster application.
View the MS SQL Cluster Details
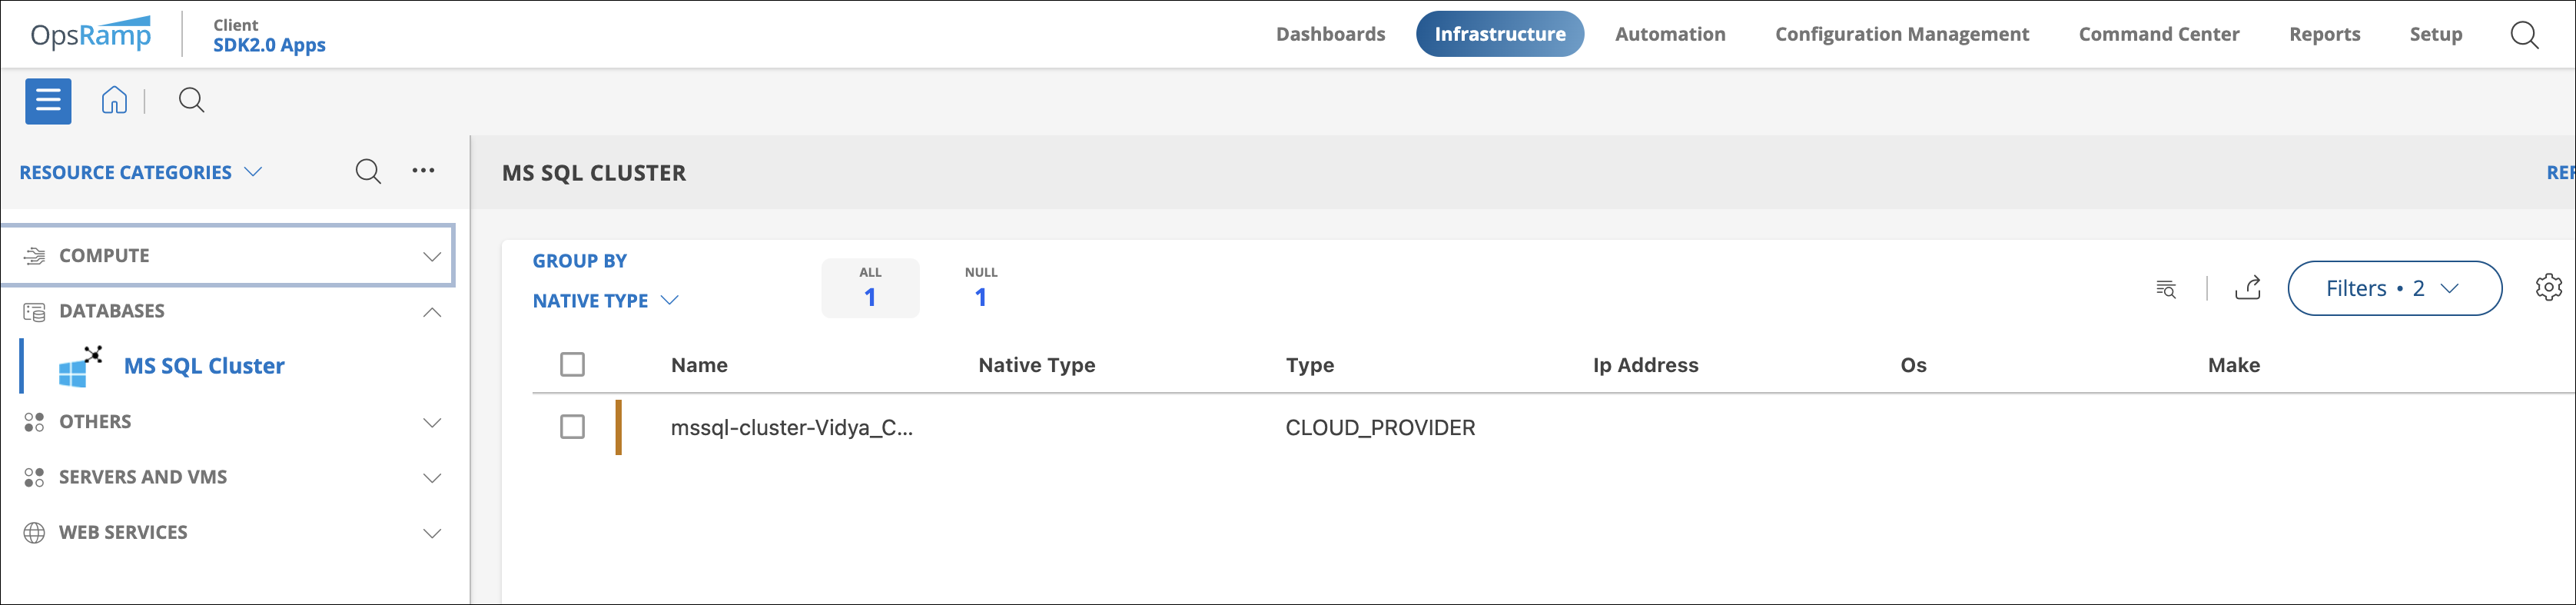
- Navigate to Infrastructure > Search > DATABASES > MS SQL Cluster.
- Select the application on the MS SQL Cluster page.
- The RESOURCE page appears from the right.
- Click the ellipsis (…) on the top right and select View Details.
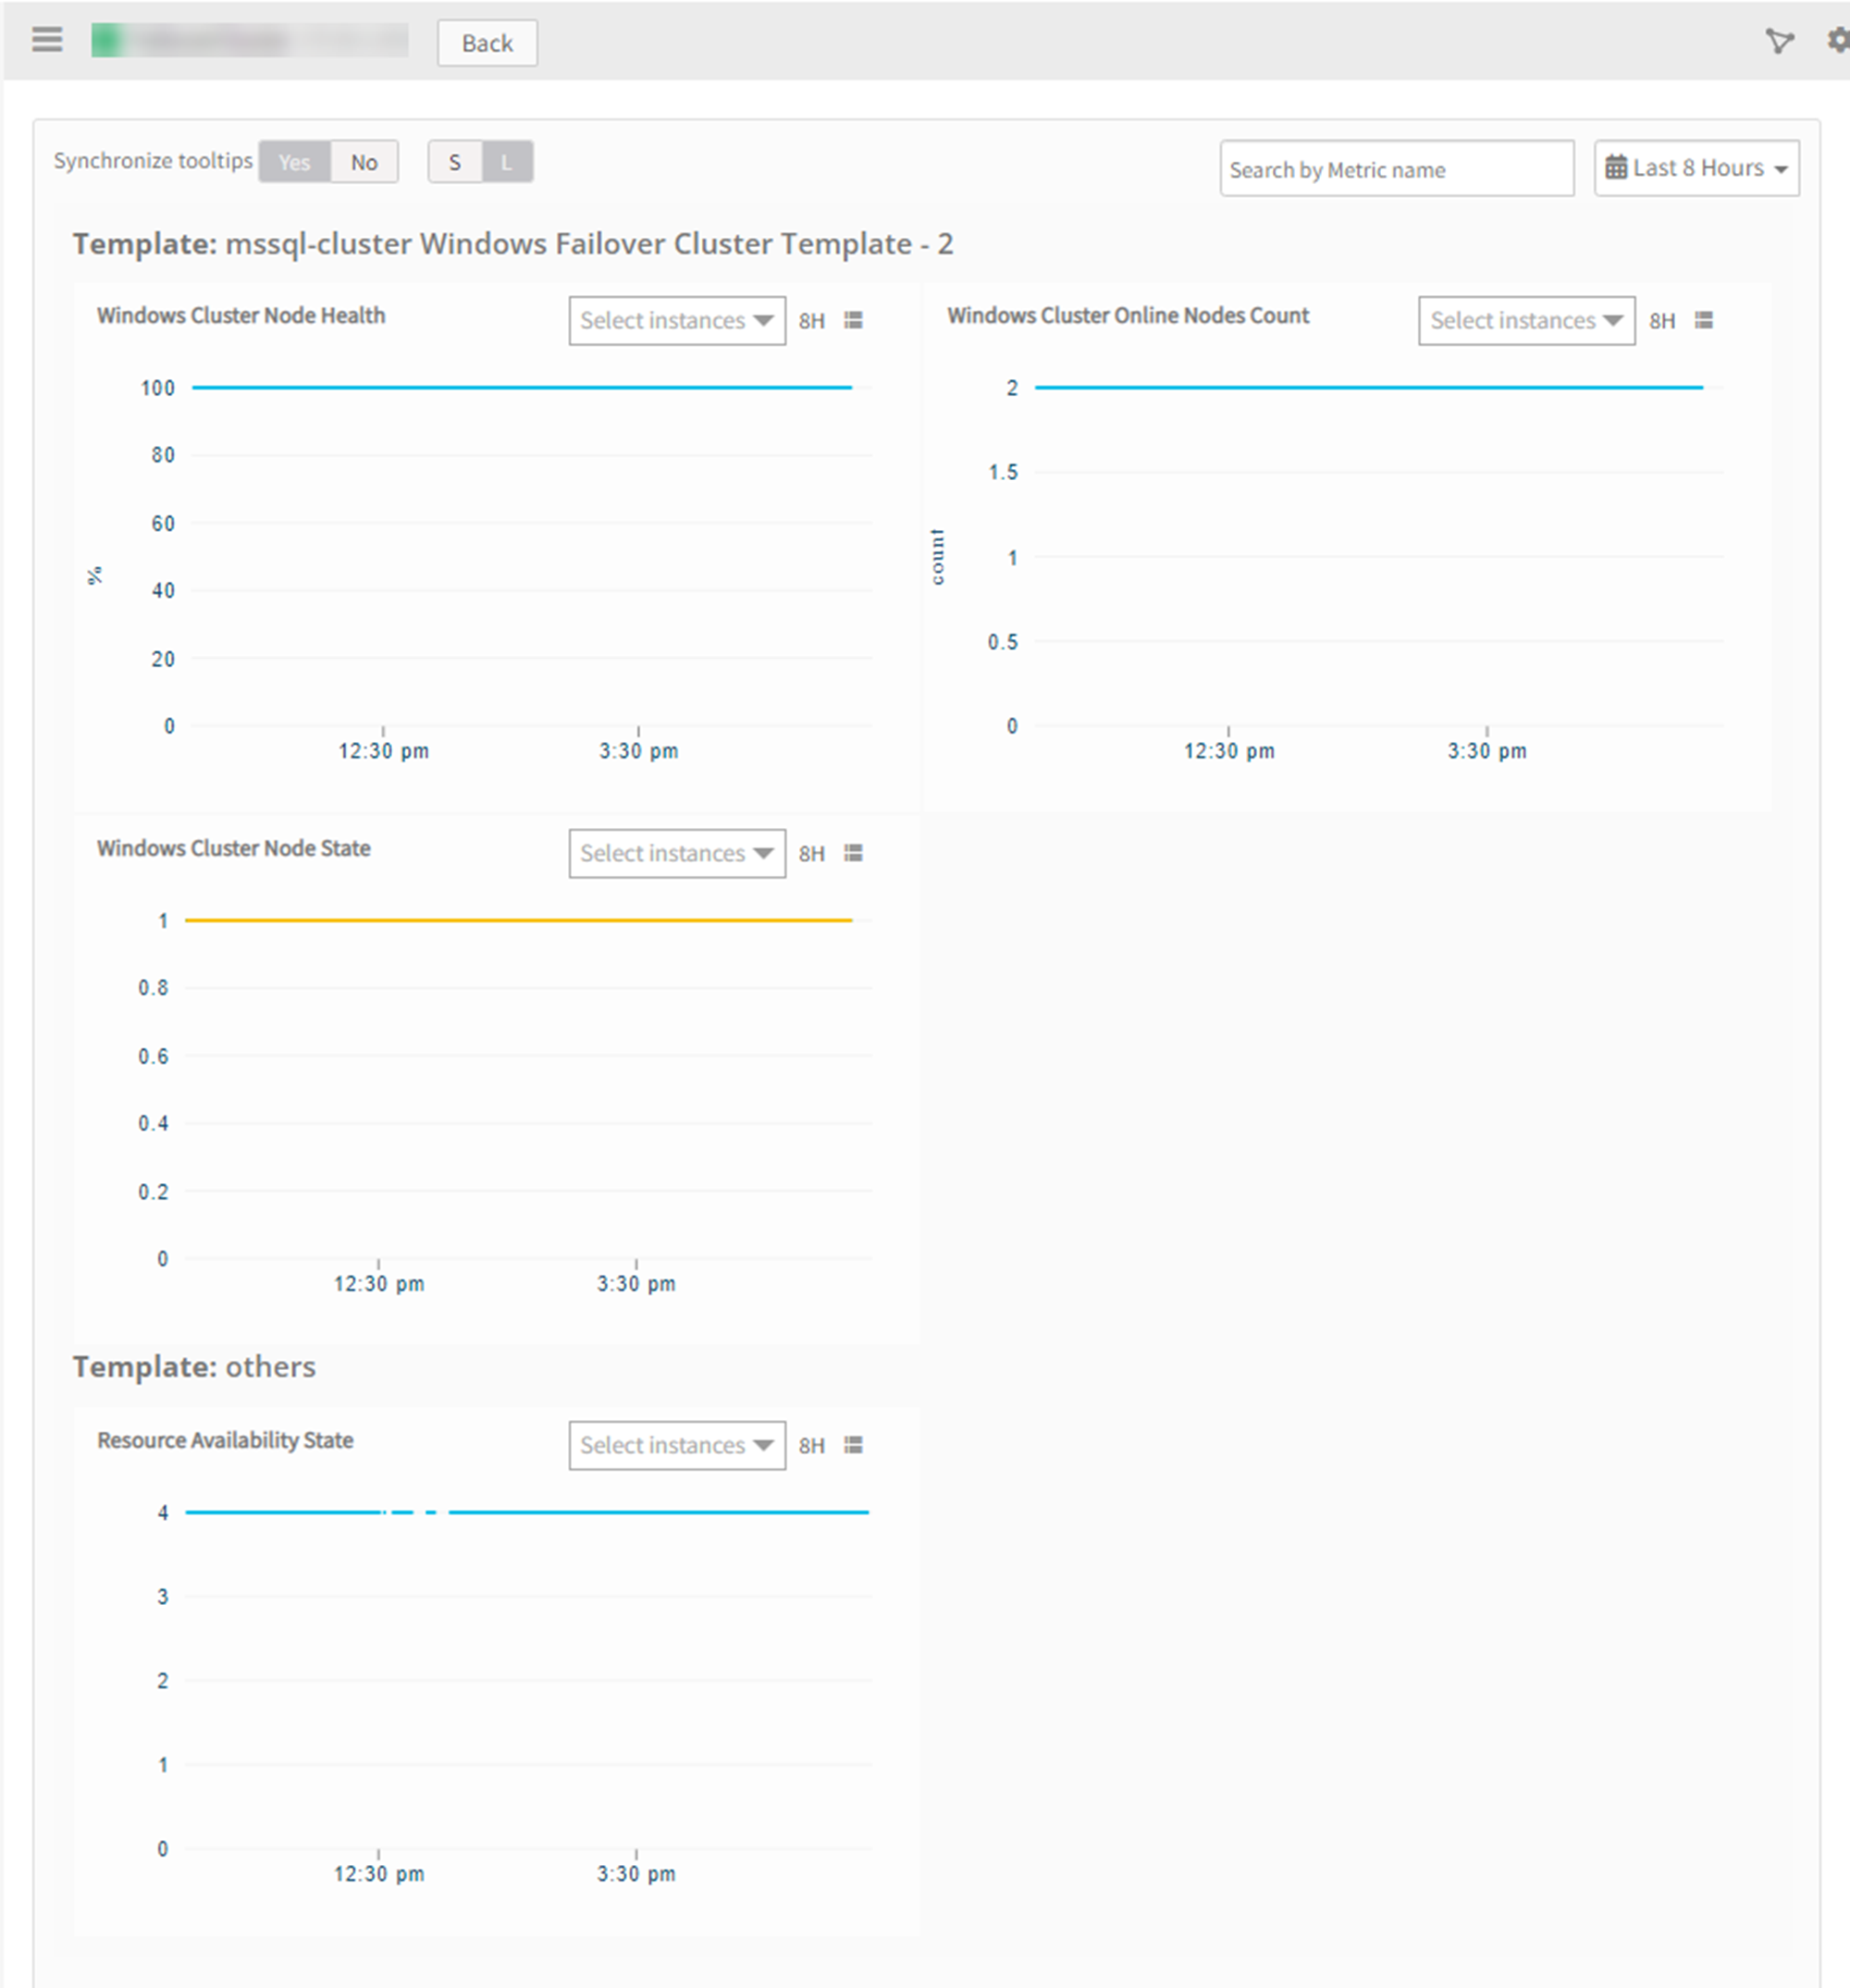
View resource metrics
To confirm MS SQL Cluster monitoring, review the following:
- Metric graphs: A graph is plotted for each metric that is enabled in the configuration.
- Alerts: Alerts are generated for metrics that are configured as defined for integration.
Resource Type Filter Keys
MSSQL Cluster application resources are filtered and discovered based on below keys:
Click here to view the Supported Input Keys
| Resource Type | Supported Input Keys |
|---|---|
| All Types | resourceName |
| hostName | |
| aliasName | |
| dnsName | |
| ipAddress | |
| macAddress | |
| os | |
| make | |
| model | |
| serialNumber | |
| MSSQL Windows Failover Cluster | Configured Nodes Count |
| Owner Node | |
| MSSQL Windows Failover Cluster Node | Root Resource IPAddress |
| Root Resource HostName | |
| Root Resource Name | |
| Root Resource UUID | |
| MSSQL Windows Failover Cluster Role | Root Resource IPAddress |
| Root Resource HostName | |
| Root Resource Name | |
| Root Resource UUID | |
| MSSQL Windows Failover Cluster Storage Disk | Root Resource IPAddress |
| Root Resource HostName | |
| Root Resource Name | |
| Root Resource UUID | |
| MSSQL Cluster Shared Volume | FileSystem |
| FriendlyVolumeName | |
| Owner Node | |
| Root Resource IPAddress | |
| Root Resource HostName | |
| Root Resource Name | |
| Root Resource UUID | |
| MSSQL Server Instance | Port |
| Root Resource IPAddress | |
| Root Resource HostName | |
| Root Resource Name | |
| Root Resource UUID | |
| MSSQL Node | BuildNumber |
| Version | |
| Caption | |
| Hard Disk Size | |
| OSArchitecture | |
| Root Resource IPAddress | |
| Root Resource HostName | |
| Root Resource Name | |
| Root Resource UUID | |
| MSSQL Node Server Instance | Port |
| Root Resource IPAddress | |
| Root Resource HostName | |
| Root Resource Name | |
| Root Resource UUID | |
| MSSQL Server Database | Port |
| Owner Sid | |
| User Access Description | |
| Recovery Model Description | |
| Physical Database Name | |
| Delayed Durability | |
| Root Resource IPAddress | |
| Root Resource HostName | |
| Root Resource Name | |
| Root Resource UUID |
Supported Alert Custom Macros
Customize the alert subject and description with below macros then it will generate alerts based on customisation. Supported macros keys:
Click here to view the alert subject and description with macros
${resource.name}
${resource.ip}
${resource.mac}
${resource.aliasname}
${resource.os}
${resource.type}
${resource.dnsname}
${resource.alternateip}
${resource.make}
${resource.model}
${resource.serialnumber}
${resource.systemId}
${Custome Attributes in the resource}
${parent.resource.name}
Risks, Limitations And Assumptions
This application only supports mssql-cluster which is built upon the Windows failover cluster.
Note: Cluster built on top of Veritas Cluster Server (VCS) is not supported.For Cluster object discovery and monitoring implementation, we are considering the object which has “Name” equals to Cluster Name in Get-ClusterResource response.
For ClusterGroup monitoring implementation, We are considering the object which has Name as Cluster Group in Get-ClusterGroup response
All the failover status metrics possible instance values are 0 - if there is no change in OwnerNode, 1 - If there is a change in OwnerNode, 2 - If no OwnerNode
Application can handle Critical/Recovery failure notifications for below two cases when user enables “App Failure Notifications” in configuration:
- Connectivity Exception
- Authentication Exception
Application will send any duplicate/repeat failure alert notification for every 6 hours.
If user enables agent monitoring templates on the Cluster/Node resource, he might see the duplicate metrics with different naming conventions.
While trying to fetch the node ip address we receive multiple node ips, which will include many local ips and actual ips (example : lets say actual node ip is 10.1.1.1 when trying to fetch the details we will receive two ips one associated with custer(192.168.0.0) and other is the actual ip). To identify the actual node ip address from the list of IP addresses received we are assuming that node ip address is part of the same subnet of cluster ip address. meaning if cluster ip is 10.1.1.1 then node ips will be 10.1.X.X.
We have provided the provision to give Cluster Ip Address OR HostName in configuration, but hostName provision will work only if the host name resolution works.
Classic gateway requires additional libraries to be packaged which are needed to execute the powershell script to achieve this integration approach.
This application supports only Classic Gateway and NextGen Gateway. Not supported with Cluster Gateway.
The Template Applied Time will only be displayed if the collector profile (Classic and NextGen Gateway) is version 18.1.0 or higher.
Component level thresholds can be configured on each resource level.
Optional configuration parameters can be defined.
Application upgrade is an automated process with version change.
If you select any of the MSSQL Type STANDALONE / CLUSTER in configuration page, by default all the RESOURCE TYPE’s are selected however the Discovery perform is based on MSSQL Type only.
Example: if you select MSSQL Type as STANDALONE, the application will discover only two resource types which is MSSQL Node and MSSQL Server Instance even all the resource types is selected.Validated the integration (MSSQL Type as VERITAS CLUSTER) with domain admin user only.
For the integration (MSSQL Type as VERITAS CLUSTER), we are considering cluster uid or cluster name for uniqueness. If there is any change with cluster uid or cluster name resources will be deleted and re-created.
Version History
| Application Version | Bug fixes / Enhancements |
|---|---|
| 6.0.0 | Added support for Veritas Mssql Cluster. |
| 5.2.2 |
|
| 5.2.1 | Fix provided for the metrics mssql_cluster_group_listener_status and mssql_cluster_instance_FailoverStatus. |
| 5.2.0 | Script Optimisations, Support for Native Bridge Timeouts in UI, Fix for MSSQL Cluster single-node discovery and Disk Monitoring issues. |
| 5.1.0 |
|
| 5.0.1 |
|
| 5.0.0 | Added new native type MSSQL Server Database and its supported metrics. |
| 4.0.3 | Filtering sql service status on passive nodes for metric mssql_cluster_node_sqlservices_state. |
| 4.0.2 | Fixed MS SQL default SQL server instance monitoring issue. |
| 4.0.1 | Enhanced the app discovery script to fetch the SQL server instance IP address details. |
| 4.0.0 | Persona changes to support CLUSTER and STANDALONE MS SQL Cluster configurations. |
Click here to view the earlier version updates
| Application Version | Bug fixes / Enhancements |
|---|---|
| 3.0.2 | Implemented the fix to fetch ipaddress for default SQL server instances. |
| 3.0.1 | Added Fix for Powershell script Empty Arguments issue. |
| 3.0.0 |
|
| 2.0.1 | Added support for NativeType Display order changes and resource grouping by type in UI. |
| 2.0.0 | mssql application enhancement & csv monitoring support changes. |
| 1.0.2 | Full Discovery Support. |
| 1.0.1 | Initial SDK2.0 app Discovery and Monitoring Implementations. |