Events generated from integration failures (both inbound and outbound configurations) can be monitored.
- Alerts are generated when integration failures occur.
- Metrics are provided to monitor integration failures.
- Templates are available to create and assign to the integration.
Monitoring integration failures are applicable to the following types of integrations:
| Integration Type | Example Apps |
|---|---|
| Monitoring Integration | SolarWinds, Nagios, Zabbix |
| Collaboration Integration | ServiceNow, Jira, Microsoft Teams |
| Email Alert | Alert emails from external monitoring tools |
| Email Incident | Incident notifications from ticketing systems |
| Custom Integration (API) | Any integration using OpsRamp’s REST APIs |
Step 1: View metrics
- Navigate to Setup > Monitoring > Metrics.
- Use the search option to search for metric(s).
- From Collector Type, select Integration.
The following metrics are available for monitoring integration failures:
| Metric | Description |
|---|---|
| integration.email.failures.count | Defines the metric used to count the email failures. |
| integration.inbound.failures.count | Defines the metric used to count the failures raised during the inbound data flow. |
| integration.inbound.reqs.throttled | Defines the metric used to throttle the inbound requests. |
| integration.outbound.failures.count | Defines the metric used to count the failures raised during the outbound data flow. |
| integration.outbound.time-outs | Defines the metric used to count the time-outs caused during outbound data flow. |
Step 2: Create monitor
Navigate to Setup > Monitoring > Monitors and click on +Add.
Enter the following information:
- Monitor Scope: Partner Monitor or Client Specific Monitor
- Partner: (auto-populated)
- Client: select_client
- Adapter Type: Integration
- Name: monitoring_name
- Description: short-description
- To add the integration failure metrics, click Add Metrics.
- Select all the metrics and click Add Metrics.
Click Save.
Step 3: Create template
| Field Name | Field Type | Description |
|---|---|---|
| Select Template Scope | Dropdown | Select the scope of the template: Service Provider Template or Partner or Client Templates. Based on the selection, additional fields (Partner and Client) appear for Partner/Client scope. |
| Partner | Dropdown (Read-only) | Displays the partner name when 'Partner or Client Templates' is selected as the scope. Automatically populated based on tenant hierarchy. |
| Client | Dropdown | Select the target client where the monitoring template will be applied. Visible only when 'Partner or Client Templates' is selected. |
| Collector Type | Dropdown | Select the collector type (e.g., Cloud, Gateway) used for monitoring data collection. |
| Applicable For | Dropdown | Select the resource type (e.g., Kubernetes Master, Windows Server) to which this template applies. |
| Template Name | Text | Enter a unique name for the template. |
| Description | Text Area | Provide a brief description of the template's purpose. |
| Generation | Text (Read-only) | Indicates the generation/version model of the template. This is system-generated and cannot be modified. |
| Version | Text (Read-only) | Displays the current version number of the template. |
| Tags | Text | Optional tags for organizing or filtering templates. |
| Prerequisites | Text | Specify any prerequisite conditions or configurations required before applying this template. |
| Status | Dropdown | Select whether the template is Active or Inactive. |
| Notes | Text Area | Optional notes or comments for internal reference. |
| Template Family Name | Text | Group related templates under a common family name for easier management. |
| Deployment Type | Dropdown | Select the deployment model for the template (e.g., Standard). |
Step 4: Assign template to integration
You can assign templates, at the partner and client levels, to the integration for monitoring the integration failures.
Follow these steps to assign a template:
At the client level:
- Click on the Actions (three dots) icon for the integration and click on Assign template.
- From the Assign template window, use the search option to search for the template.
- Select the template and click on Assign Template The template is assigned successfully.
Note If you are at the partner level, then a check box is displayed in the Assign template window. If you select the check box, then the template is inherited to all the child integrations.
- To unassign a template:
- Follow steps 1 and 2 above.
- Click on Unassign.
Note: Alternatively, you can select any other template and click on Reassign. The template that was previously assigned is automatically unassigned and the selected template is assigned.
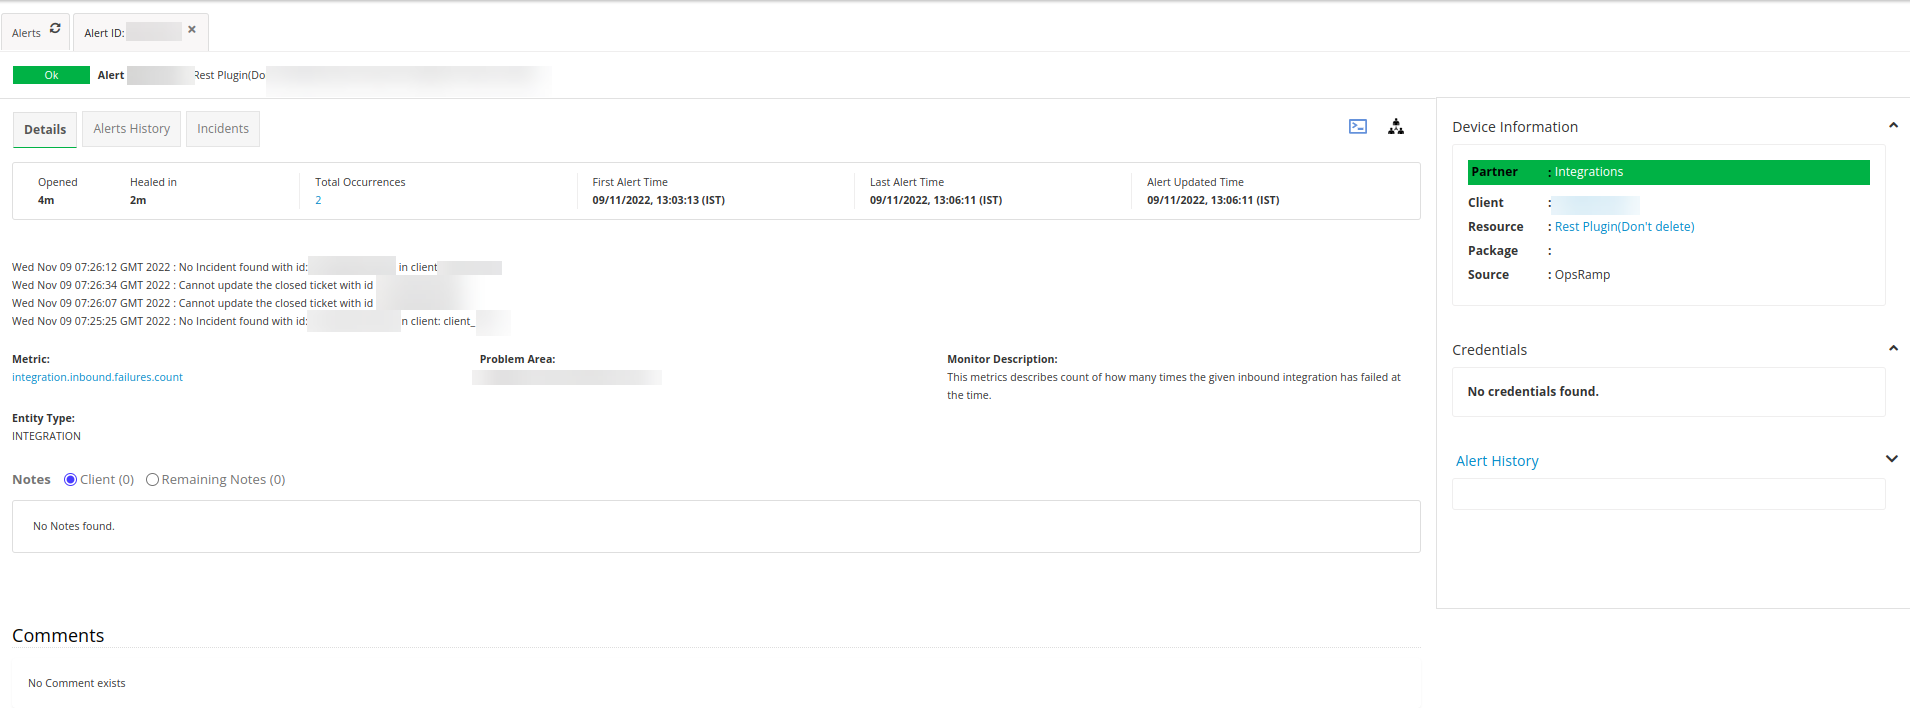
Step 5: View alerts
- Go to Alerts, click Edit Criteria and select the Partner, Client.
- Select Alert Type > Monitoring and click Apply. All alerts raised from integration failure for the selected partner and client are displayed.
- Click the alert to view the details and click the Alert History tab to view complete details of the alert.
An alert is triggered when there is an integration failure. The alert description includes a timestamp and an error message.
Timestamp format: Day + Month + Date + time (hours,minutes,seconds) +
time zone + year.