| Supported Target Version |
|---|
| Rest API: API Version 1.0 |
| OS 7.11.0.0-1035502 |
Application Version and Upgrade Details
| Application Version | Bug fixes / Enhancements |
|---|---|
| 2.0.1 | Added support for metric label and Display order changes |
| 2.0.0 | Initial SDK2.0 application Discovery and Monitoring Implementations |
Introduction
Dell EMC Data Domain (DD) deduplication storage systems continue to revolutionize disk backup, archiving, and disaster recovery with high-speed, inline deduplication. This innovation continues with Dell EMC’s new generation of mid-sized and large enterprise Data Domain systems powered with a Flash SSD. By consolidating backup and archive data on a Data Domain system, you can reduce storage requirements by up to 55x, making disk cost-effective for onsite retention and highly efficient for network-based replication to disaster recovery sites.
EMC Data Domain Operating System is the intelligence behind EMC Data Domain deduplication storage systems. DD OS powers the industry’s most efficient, scalable, reliable, cloud-ready protection storage platform.
OpsRamp integrates with DELL Data Domain through REST APIs.
DELL Data Domain Architecture:
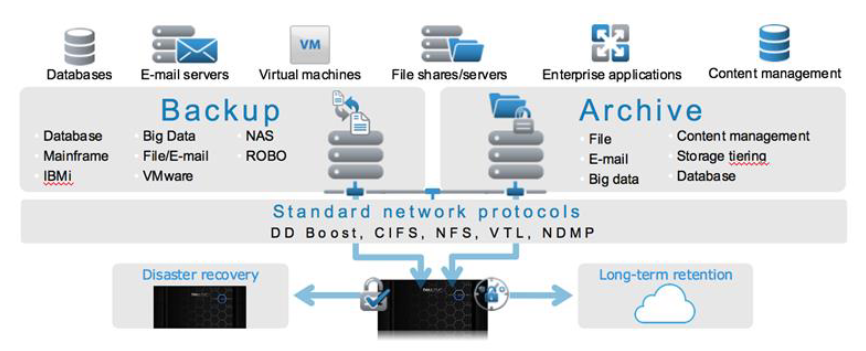
Diagram Reference:
https://www.delltechnologies.com/asset/en-us/products/data-protection/technical-support/h6811-datadomain-ds.pdf
Prerequisites
- OpsRamp Classic Gateway 14.0.0 and above.
- OpsRamp Nextgen Gateway 14.0.0 and above.
Note: OpsRamp recommends using the latest Gateway version for full coverage of recent bug fixes, enhancements, etc..
Application Migration
- Check for the gateway version as a prerequisite step - classic gateway-12.0.1 and above.
Notes:- You only have to follow these steps when you want to migrate from sdk 1.0 to sdk 2.0.
- For the first time installation below steps are not required.
- Disable all configurations associated with sdk 1.0 adaptor integration application.
- Install and Add the configuration to that sdk 2.0 application.
Note: refer to Configure and Install the Dell Data Domain Integration & View the Dell Data Domain Details sections of this document. - Once all discoveries are completed with the sdk 2.0 application, follow any one of the approaches.
Direct uninstallation of the sdk 1.0 adaptor application through the uninstall API with skipDeleteResources=true in the DELETE request.
End-Point:
https://{{host}}/api/v2/tenants/{tenantId}/integrations/installed/{installedIntgId}Request Body:
    {
    "uninstallReason": "Test",
    "skipDeleteResources": true
    }
(OR)Delete the configuration one by one through the Delete adaptor config API with the request parameter as skipDeleteResources=true in the DELETE request.
End-Point:
https://{{host}}/api/v2/tenants/{tenantId}/integrations/installed/config/{configId}?skipDeleteResources=true.Finally, uninstall the adapter application through API with skipDeleteResources=true in the DELETE request.
End-Point:
https://{{host}}/api/v2/tenants/{tenantId}/integrations/installed/{installedIntgId}Request Body:
        {
    "uninstallReason": "Test",
    "skipDeleteResources": true
}
Supported Metrics
Click here to view the supported metrics
| Native Type | Metric Name | Display Name | Metric Label | Units | Application Version | Description |
|---|---|---|---|---|---|---|
| Data Domain Backup Server | datadomain_physicalcapacity_Utilization | Data Domain Physical Capacity Utilization | Usage | % | 2.0.0 | Provides server physical capacity utilization in percentage. |
| datadomain_logicalcapacity_Utilization | Data Domain Logical Capacity Utilization | Usage | % | 2.0.0 | Provides server logical capacity utilization in percentage. | |
| datadomain_server_UpTime | Data Domain Server UpTime | Availability | s | 2.0.0 | Provides server uptime in seconds. | |
| datadomain_services_Status | Data Domain Services Status | Usage | Availability | 2.0.0 | Provides server services status. Possible values: 1-enabled and 0-disabled. | |
| datadomain_filesystem_CleaningStatus | Data Domain File System Cleaning Status | Usage | Availability | 2.0.0 | Provides server file systems status. Possible values: 1-active 0-inactive. | |
| datadomain_filesystem_CleaningAge | Data Domain File System Cleaning Age | Performance | Days | 2.0.0 | Provides server file systems cleaning age in days. | |
| datadomain_physical_used_Capacity | Data Domain Physical Capacity Used | Usage | bytes | 2.0.0 | Provides server physical capacity used in bytes. | |
| datadomain_physical_free_Capacity | Data Domain Physical Capacity Available | Usage | bytes | 2.0.0 | Provides server physical capacity available in bytes. | |
| datadomain_logical_used_Capacity | Data Domain Logical Capacity Used | Usage | bytes | 2.0.0 | Provides server logical capacity used in bytes. | |
| datadomain_logical_free_Capacity | Data Domain Logical Capacity Available | Usage | bytes | 2.0.0 | Provides server logical capacity available in bytes. | |
| datadomain_alert_statistics | Data Domain Alert Statistics | 2.0.0 | Provides Data Domain Alert Statistics. | |||
| datadomain_resource_APIStats | Data Domain Resource API Statistics | Usage | 2.0.0 | Provides the number of API calls made within the frequency and resources. |
Default Monitoring Configurations
Data Domain has default Global Device Management Policies, Global Templates, Global Monitors and Global Metrics in OpsRamp. You can customize these default monitoring configurations as per your business use cases by cloning respective Global Templates and Global Device Management Policies. We recommend doing this activity before installing the application to avoid noise alerts and data.
Default Global Device Management Policies
You can find the Device Management Policy for each Native Type at Setup > Resources > Device Management Policies. Search with suggested name in global scope. Each Device Management Policy follows below naming convention:
{appName nativeType - version}Ex: data-domain Data Domain Backup Server - 2 (i.e, appName = data-domain, nativeType = Data Domain Backup Server, version = 2)
Default Global Templates
You can find the Global Templates for each Native Type at Setup > Monitoring > Templates. Search with suggested names in global scope. Each template follows below naming convention:
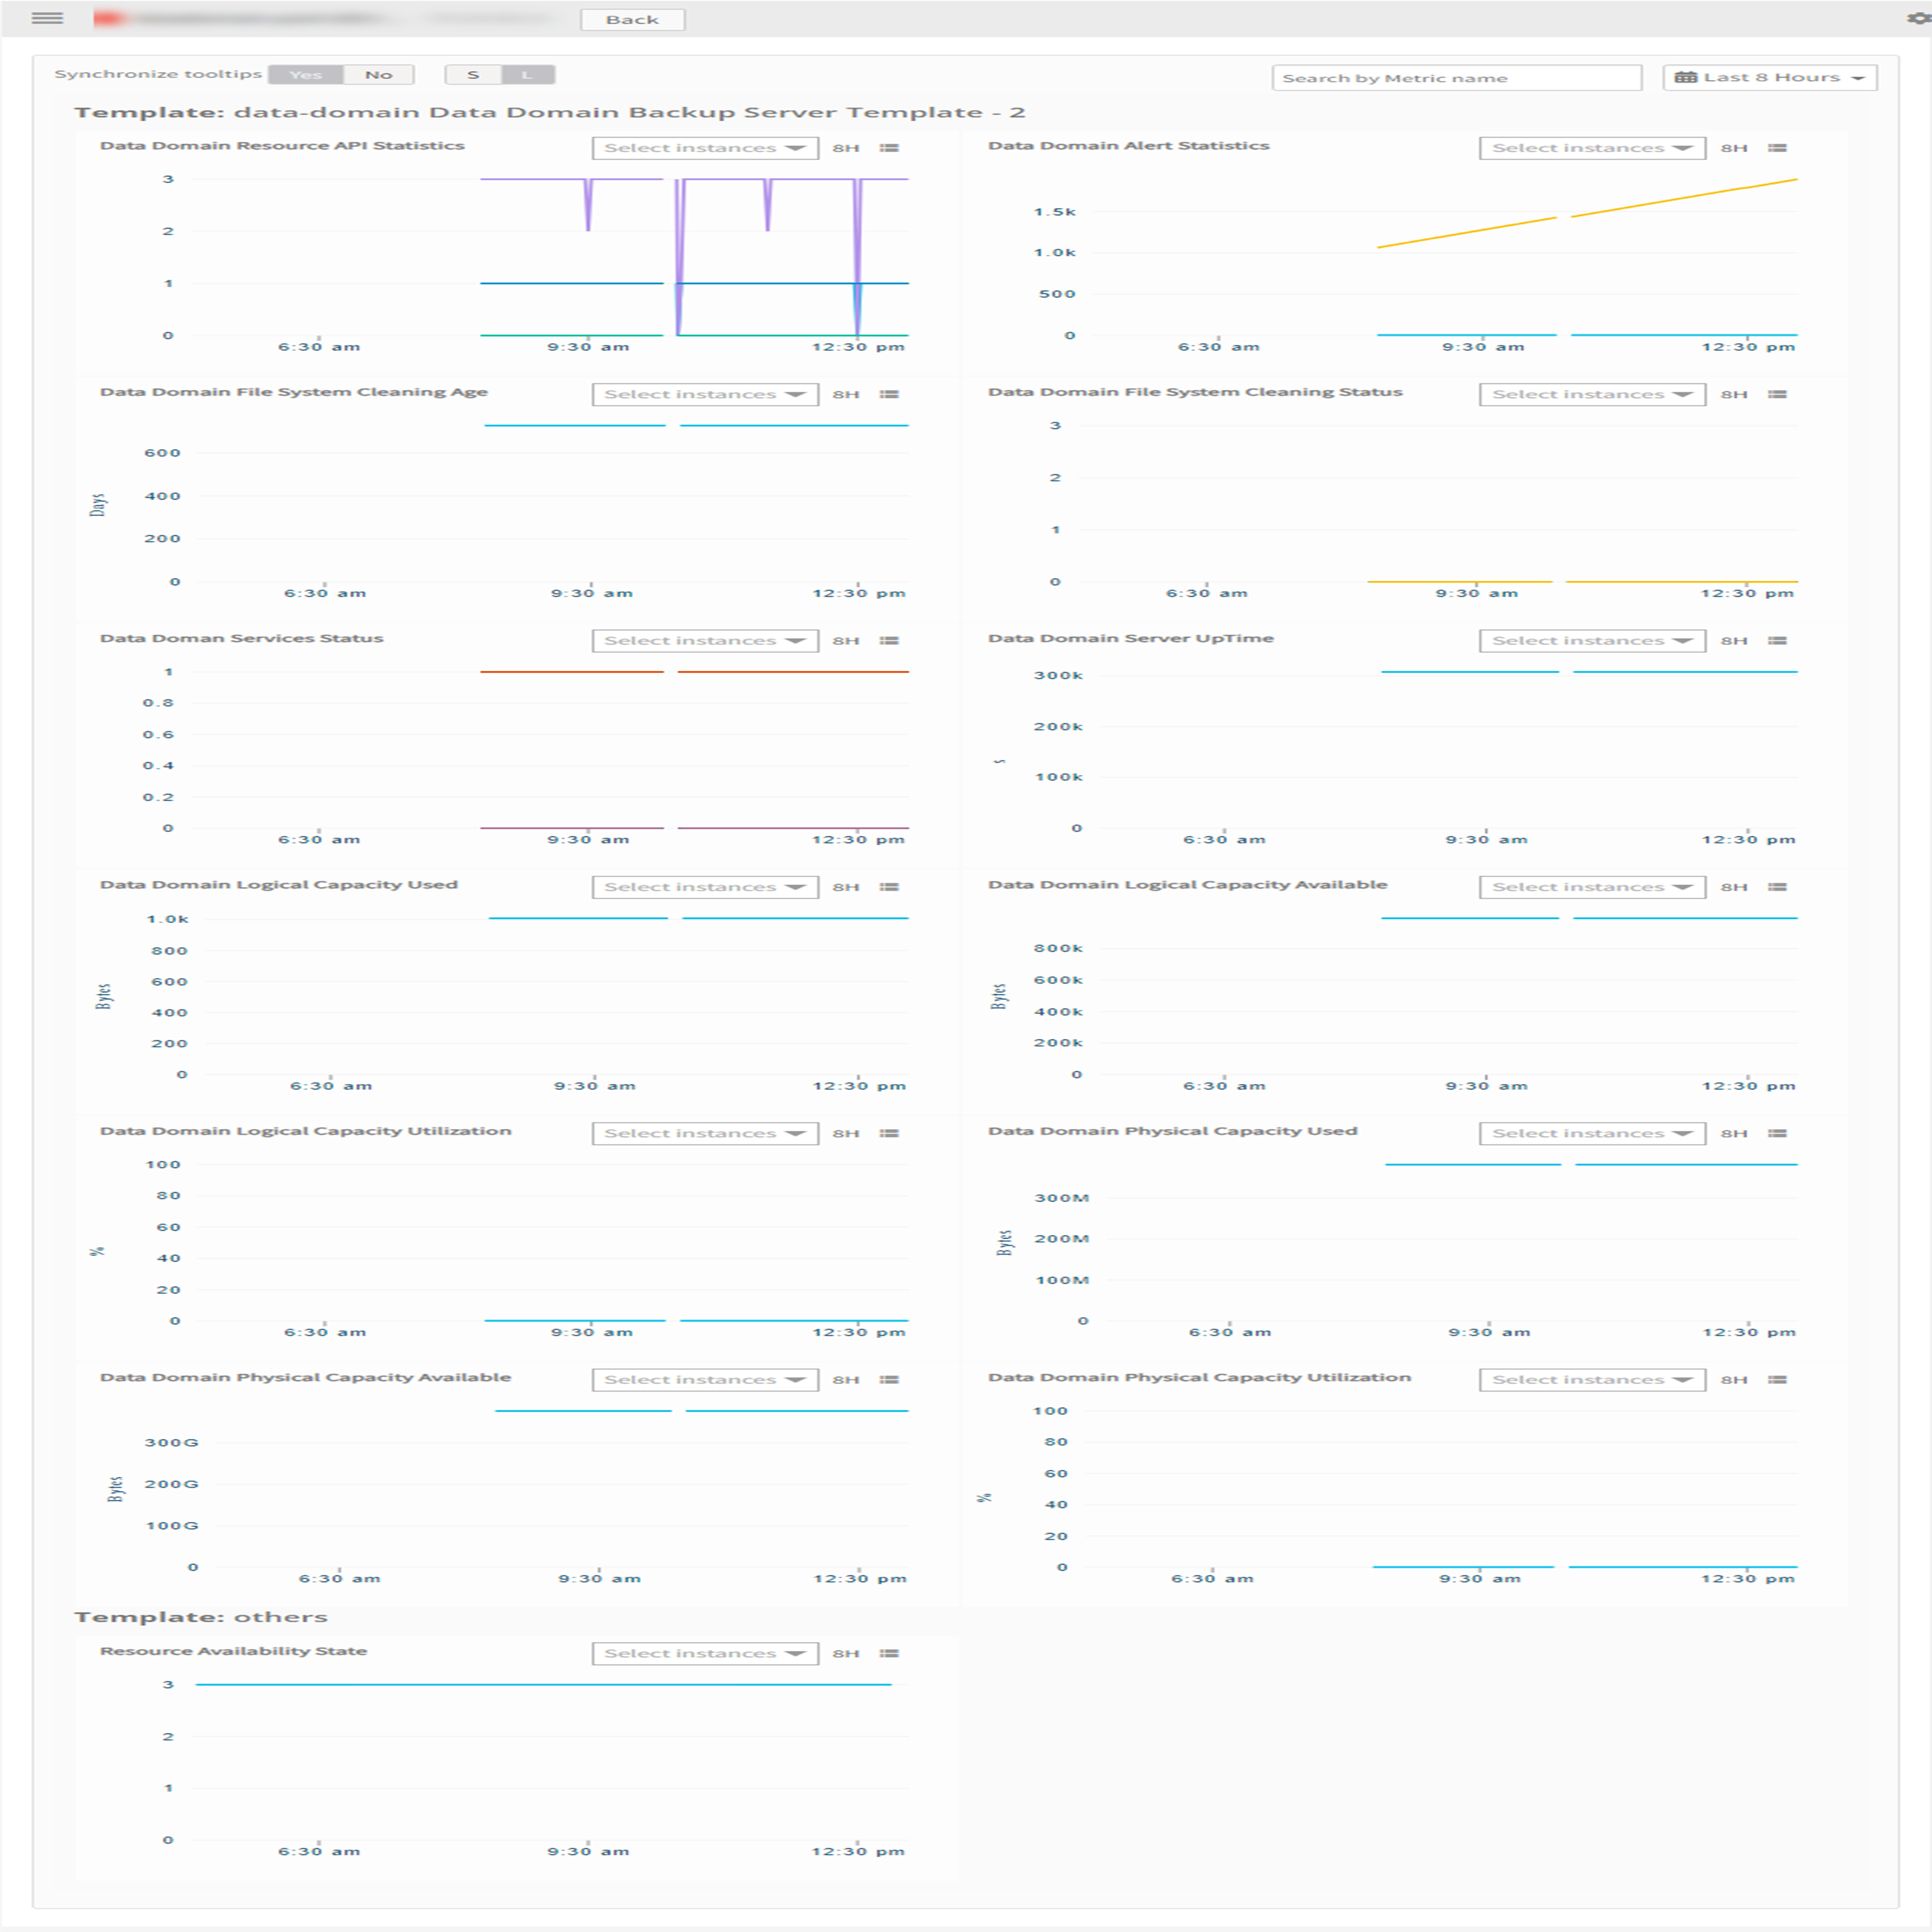
{appName nativeType 'Template' - version}Ex: data-domain Data Domain Backup Server Template - 2 (i.e, appName = data-domain, nativeType = Data Domain Backup Server, version = 2)
Default Global Monitors available
You can find the Global Monitors for each Native Type at Setup > Monitoring > Monitors. Search with suggested name in global scope. Each Monitors follows below naming convention:
{monitorKey appName nativeType - version}Ex: Data Domain Backup Server Monitor data-domain Data Domain Backup Server 2 (i.e, monitorKey = Data Domain Backup Server Monitor, appName = data-domain, nativeType = Data Domain Backup Server, version = 2)
Configure and Install the Dell Data Domain Integration
- From All Clients, select a client.
- Go to Setup > Account.
- Select the Integrations and Apps tab.
- The Installed Integrations page, where all the installed applications are displayed.
Note: If there are no installed applications, it will navigate to the Available Integrations and Apps page. - Click + ADD on the Installed Integrations page. The Available Integrations and Apps page displays all the available applications along with the newly created application with the version.
Note: You can even search for the application using the search option available. Also you can use the All Categories option to search. - Click ADD in the Dell Data Domain tile.
- In the Configurations page, click + ADD. The Add Configuration page appears.
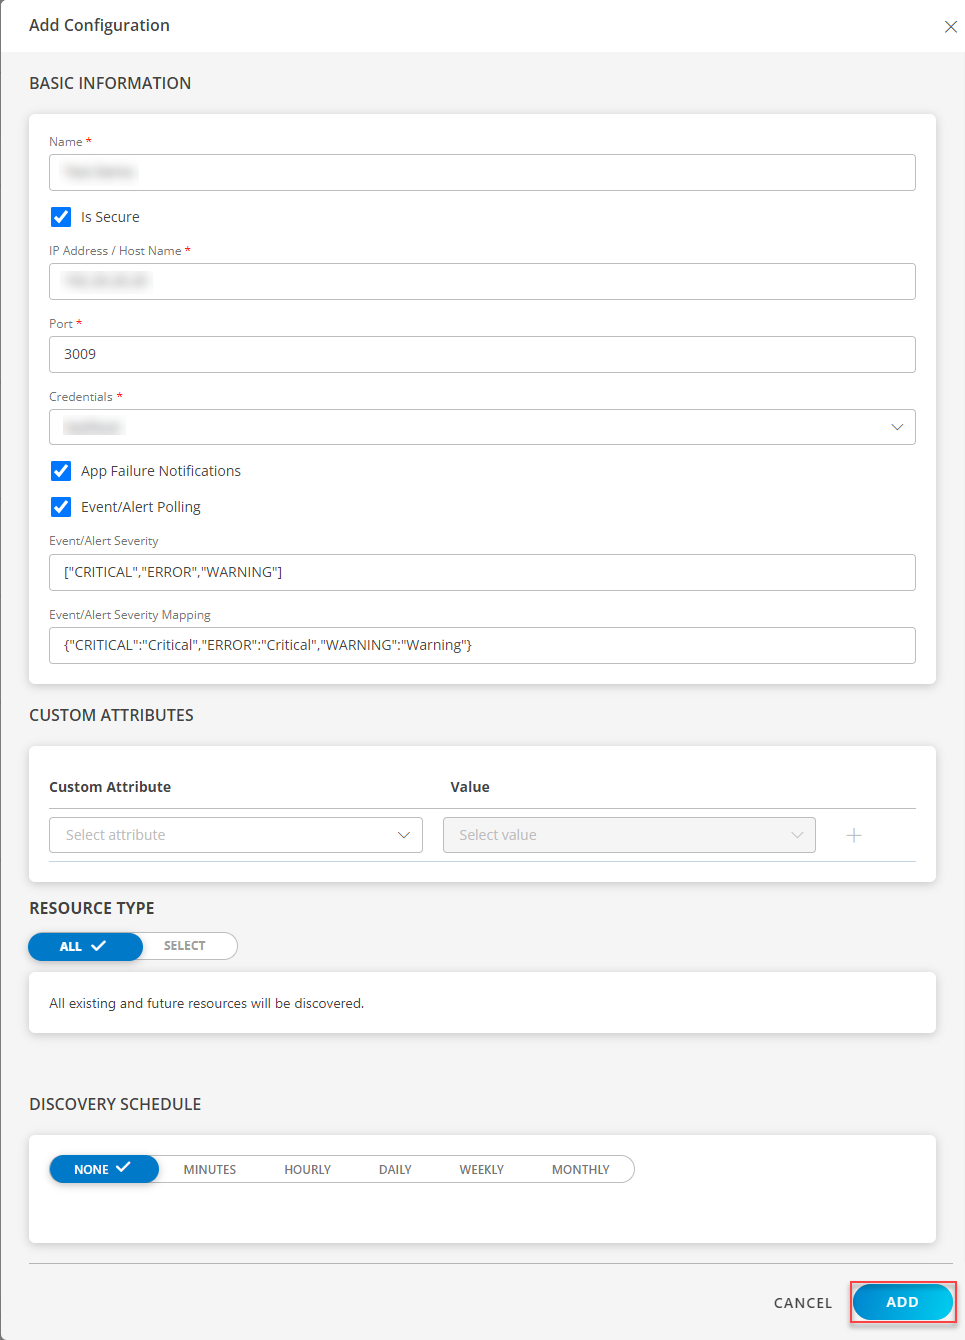
- Enter the following BASIC INFORMATION:
| Functionality | Description |
|---|---|
| Name | Enter the name for the configuration. |
| IP Address/Host Name | IP address/host name of the Dell Data Domain. |
| Port | Port Example: By default 3009 is the port value. |
| Credential | Select the credentials from the drop-down list. Note: Click + Add to create a credential. |
Notes:
- By default Is Secure checkbox is selected.
- Ip Address/Host Name and Port should be accessible from Gateway.
- Select the following:
- App Failure Notifications: if turned on, you will be notified in case of an application failure that is, Connectivity Exception, Authentication Exception.
- Event/Alert Polling: enables integrating third party alerts into OpsRamp using further configurations.
- Below are the default values set for:
- Event/Alert Severity Filter: Provides alerts severity and gets integrated out of all possible alerts.
- Default Values: CRITICAL, ERROR, WARNING.
- Possible Values: CRITICAL, ERROR, WARNING.
- Event/Alert Severity Mapping: possible values of Alert Severity Mapping Filter** configuration property are {“CRITICAL”:“Critical”,“ERROR”:“Critical”,“WARNING”:“Warning”}.
- Event/Alert Severity Filter: Provides alerts severity and gets integrated out of all possible alerts.
- Select the below mentioned Custom Attribute:
| Functionality | Description |
|---|---|
| Custom Attribute | Select the custom attribute from the drop down list box. |
| Value | Select the value from the drop down list box. |
Note: The custom attribute that you add here will be assigned to all the resources that are created by the integration. You can add a maximum of five custom attributes (key and value pair).
- In the RESOURCE TYPE section, select:
- ALL: All the existing and future resources will be discovered.
- SELECT: You can select one or multiple resources to be discovered.
- In the DISCOVERY SCHEDULE section, select Recurrence Pattern to add one of the following patterns:
- Minutes
- Hourly
- Daily
- Weekly
- Monthly
- Click ADD.
Now the configuration is saved and displayed on the configurations page after you save it. From the same page, you may Edit and Remove the created configuration.
13. Click Next.
14. In the Installation page, select an existing registered profile, and click FINISH.
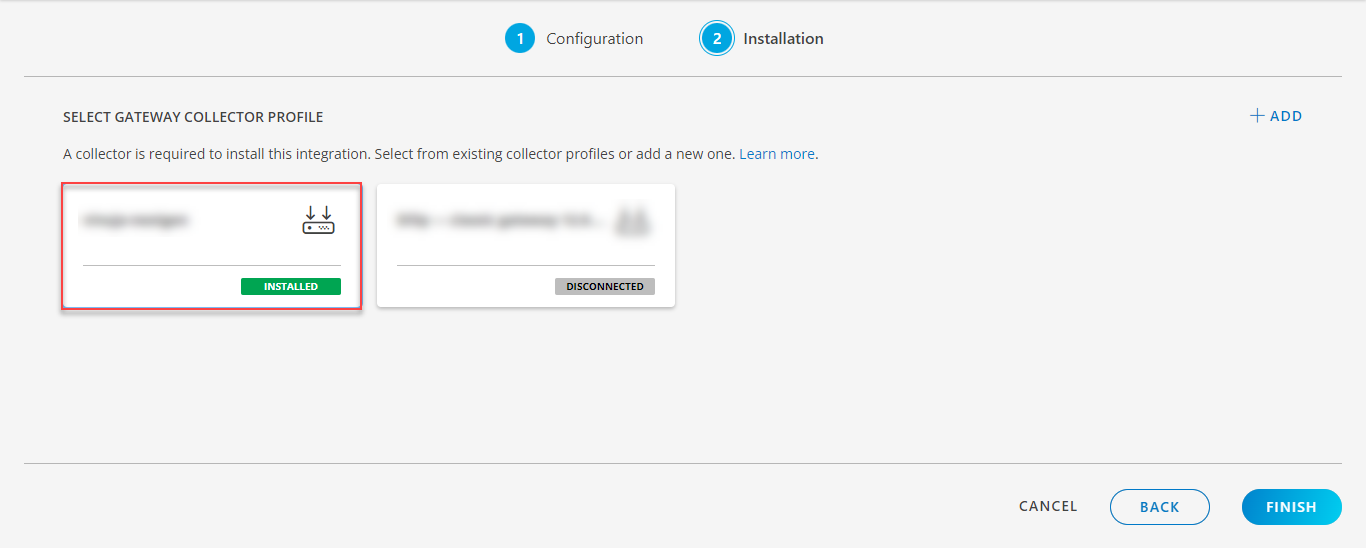
The application is now installed and displayed on the INSTALLED INTEGRATION page. Use the search field to find the installed application.
Modify the Configuration
See Modify an Installed Integration or Application article.
Note: Select Dell Data Domain.
View the Dell Data Domain Details
To discover resources for Dell Data Domain
- Navigate to Infrastructure > Search > Storage.
- The Dell Data Domain page is displayed, select the application name.
- The RESOURCE DETAILS page appears from the right.
- Click the ellipsis (…) on the top right and select View details.
- Navigate to the Attributes tab to view the discovery details.
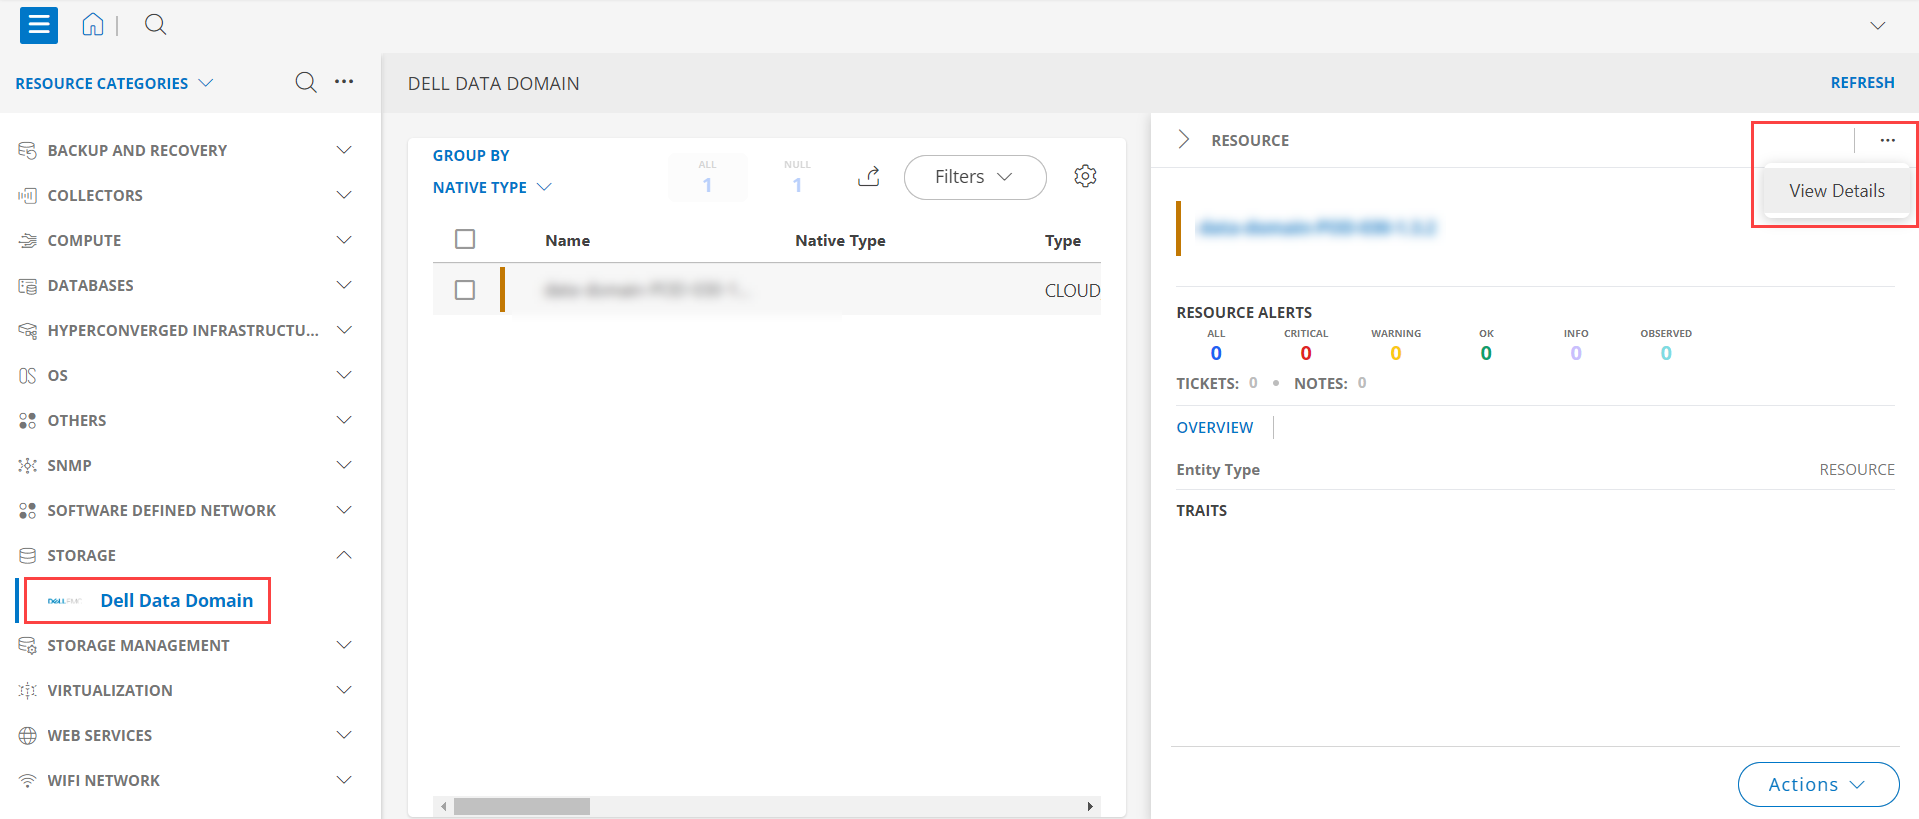
- Click the Metrics tab to view the metric details for Dell Data Domain.
Resource Filter Input Keys
Dell Data Domain application resources are filtered and discovered based on below keys:
Note: You can filter the resources with the discoverable keys only.
Click here to view the Supported Input Keys
| Resource Type | Supported Input Keys |
|---|---|
| All Types | resourceName |
| hostName | |
| aliasName | |
| dnsName | |
| ipAddress | |
| macAddress | |
| os | |
| make | |
| model | |
| serialNumber |
Supported Alert Custom Macros
Customize the alert subject and description with below macros then it will generate alerts based on customisation.
Supported macros keys:
Click here to view the alert subject and description with macros
${resource.name}
${resource.ip}
${resource.mac}
${resource.aliasname}
${resource.os}
${resource.type}
${resource.dnsname}
${resource.alternateip}
${resource.make}
${resource.model}
${resource.serialnumber}
${resource.systemId}
${Custome Attributes in the resource}
${parent.resource.name}
Risks, Limitations & Assumptions
- Application can handle Critical/Recovery failure notifications for below two cases when user enables App Failure Notifications in configuration
- Connectivity Exception
- Authentication Exception
- Application will not send any duplicate/repeat failure alert notification until the existing critical alert is recovered.
- Application cannot control monitoring pause/resume actions based on above alerts.
- Metrics can be used to monitor Data Domain resources and can generate alerts based on the threshold values.
- Data Domain’s Event/Alert polling will start only if the user enables Event/Alert Polling in configuration.
- When a severity value which presents in the Event/Alert Severity field occurs, OpsRamp will create an alert based on Event/Alert Severity Filter & Event/Alert Severity mappings of Event/Alert Polling configurations.
- Default/Possible values of Event/Alert Severity Filter configuration are CRITICAL, ERROR, WARNING.
- OpsRamp has provided default mappings to map data-domain severity with OpsRamp severities as part of Event/Alert Severity mapping configuration.
- Users can modify them as per their use-case at any point of time from the application configuration page. Possible OpsRamp Severities are Critical, Warning, Ok, Info.
- No support of showing activity log and applied time.
- The minimum supported version for the option to get Latest snapshot metric is nextgen-14.0.0.
- Application is not compatible with Cluster Gateway.
- This application supports both Classic Gateway and NextGen Gateway.