Introduction
OpsRamp Copilot provides visibility into how Copilot is being used across the organization through a dedicated Copilot Usage dashboard. This dashboard helps users monitor request volume, usage efficiency, LLM consumption, model behavior, and user adoption trends in real time.
Available under Dashboards 2.0, the dashboard presents usage analytics across multiple dimensions, including efficiency, model and provider consumption, and overall user engagement trends.
The dashboard is organized into multiple sections, each offering a different view of Copilot activity.
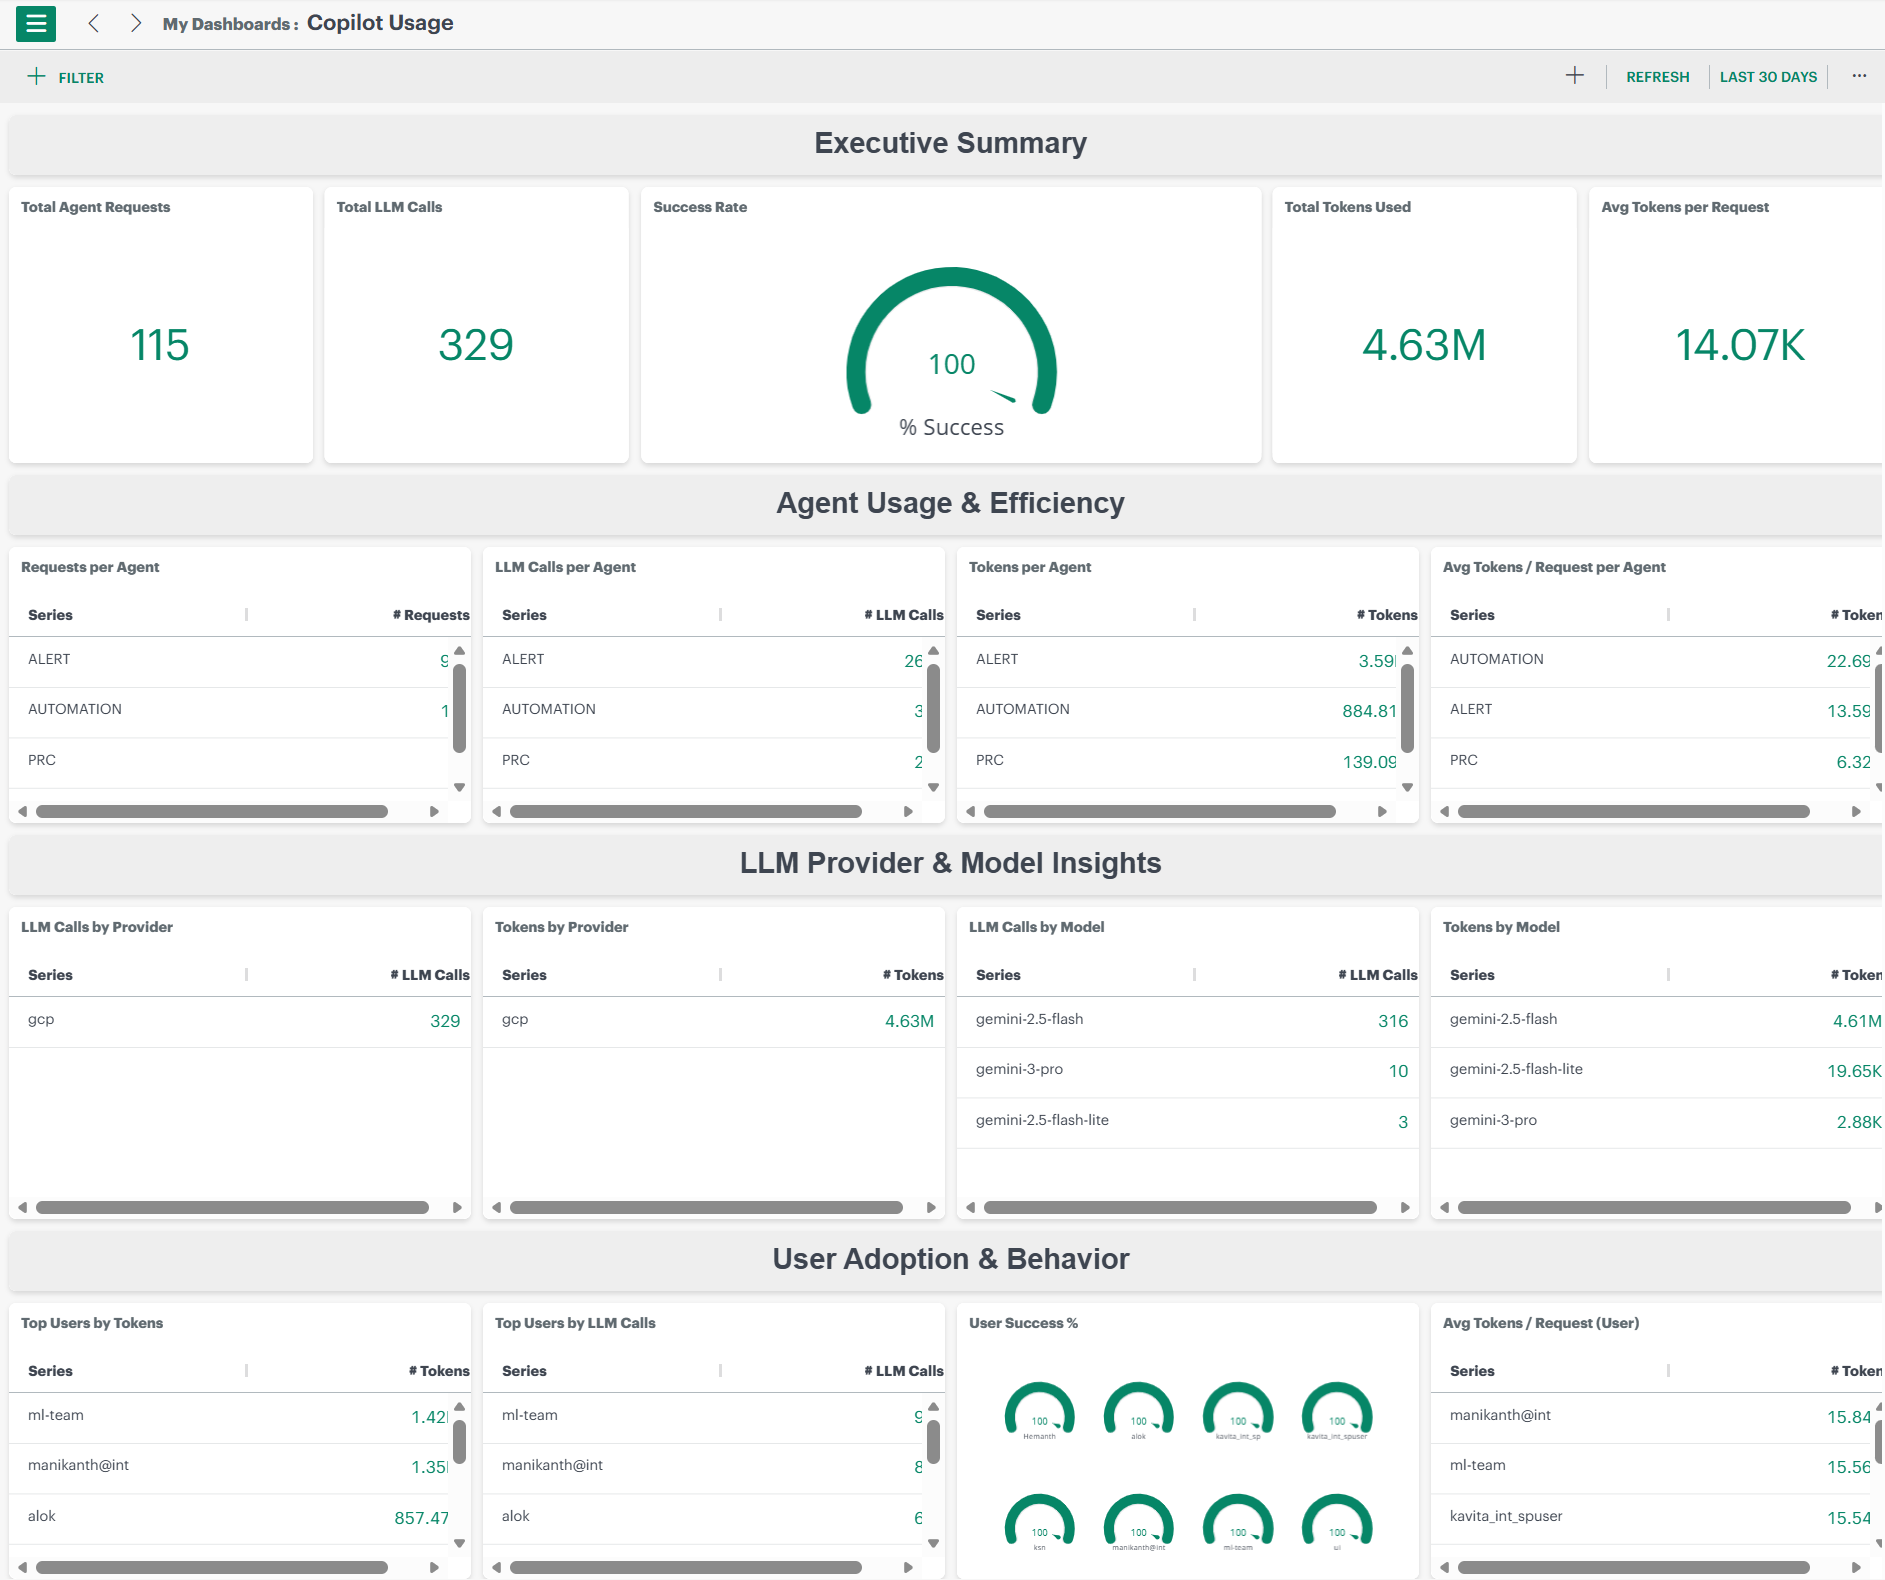
Executive Summary
Provides immediate visibility into system adoption, performance health, and token usage efficiency. This section offers a high-level overview of Copilot usage, effectiveness, and overall success.
- Total Agent Requests: Number of Copilot queries initiated by users
- Total LLM Calls: Total number of calls made to the underlying LLM provider
- Success Rate: Percentage of successful responses returned by Copilot
- Total Tokens Used: Total number of LLM tokens consumed across all interactions
- Avg Tokens per Request: Token efficiency indicator per user query
Agent Usage & Efficiency
Helps identify the most frequently used channels and how efficiently they consume LLM resources. This section provides a breakdown of Copilot usage at the channel level.
- Requests per Agent: How many times each Copilot channel (Alerts, Search, Root Cause, etc.) triggered an LLM call
- LLM Calls per Agent: Shows the number of LLM requests generated by each Copilot agent
- Tokens per Agent: Token consumption per channel
- Avg Tokens / Request per agent: Measures efficiency of each channel’s request patterns
Provider & Model-Level Insights
Provides visibility into performance, provider-level cost attribution, and model reliability. These tiles present Copilot usage segmented by cloud provider and model type.
- LLM Calls by Provider: Indicates which LLM providers Copilot is interacting with and the volume of requests sent to each
- Tokens by Provider: Shows total token usage attributed to each LLM provider, helping track consumption and cost trends
- LLM Calls by Model: Displays the distribution of Copilot requests across different LLM models
- Tokens by Model: Highlights token consumption at the model level, helping identify usage patterns and potential inefficiencies
User Adoption & Behavior
Provides insights into usage patterns, highlights power users, measures adoption across teams, and identifies potential training opportunities. This section helps organizations understand how Copilot is being used across the organization.
- Top Users by Tokens: Identifies users with the highest token consumption, helping track heavy usage and cost drivers
- Top Users by LLM Calls: Highlights users who generate the most Copilot requests, indicating frequent Copilot engagement
- User Success %: Displays the percentage of successful Copilot responses per user, reflecting response quality and effectiveness
- Avg. Tokens per Request (User): Indicates whether users tend to ask concise, optimized queries or broader, more token-intensive ones