Introduction
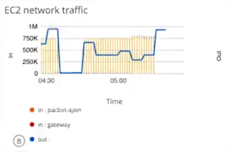
A Line/Bar chart displays multiple time series with metric values collected over a time interval. The metric can be represented by a line chart or a bar chart. Up to two queries are supported. Click the Legend field to redirect the visualization to the detailed view of the specific resource.
The following is an example of a combo chart generated by a usage_cloud_provider_aws{instance="ec2.instances"} PromQL query: