Permissions
See Using RBAC for more information.
Create a Service Tile
From Dashboard > Dashboard 2.0, create a new dashboard or select from an existing dashboard collection.
See Create Dashboards to learn about creating dashboards.
Click CREATE TILE or + from the toolbar.
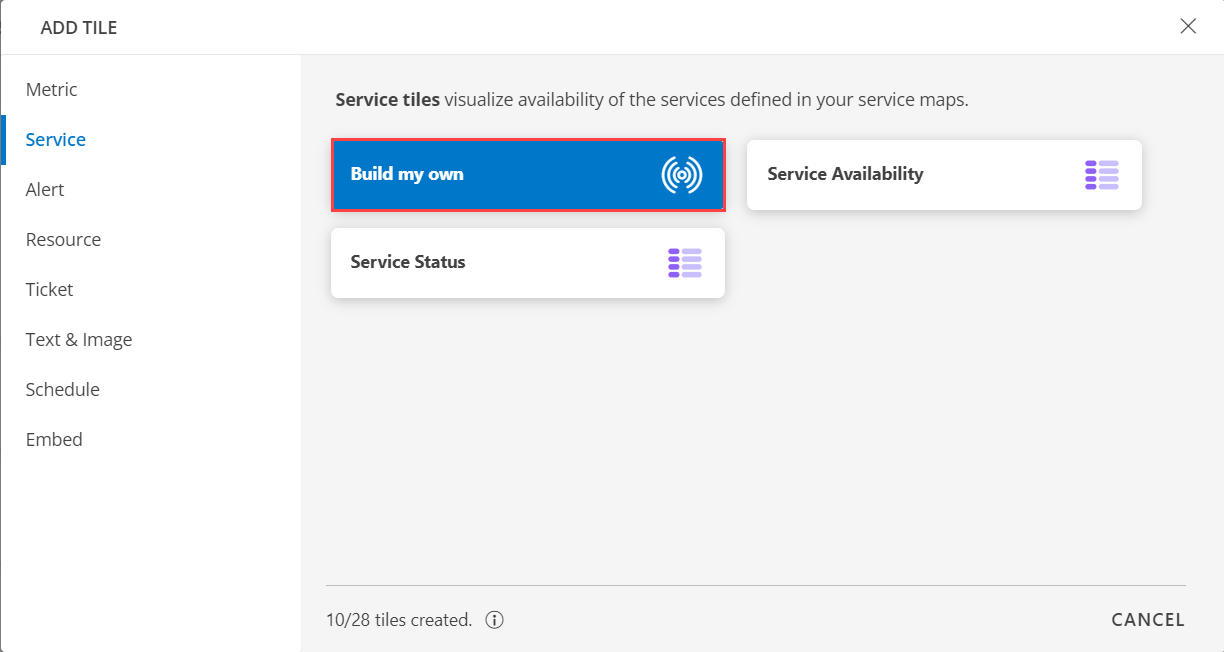
In the ADD TILE screen that appears, select SERVICE.

- Select one of the following:
| Tile Option | Functionality |
|---|---|
| Build my own | Visualize availability of the services defined in your service map. |
| Service Availability | Visualize availability and uptime of service. |
| Service Status | Visualize availability of selected service. |
Build My Own
Click here to view how to Build Your Own Query
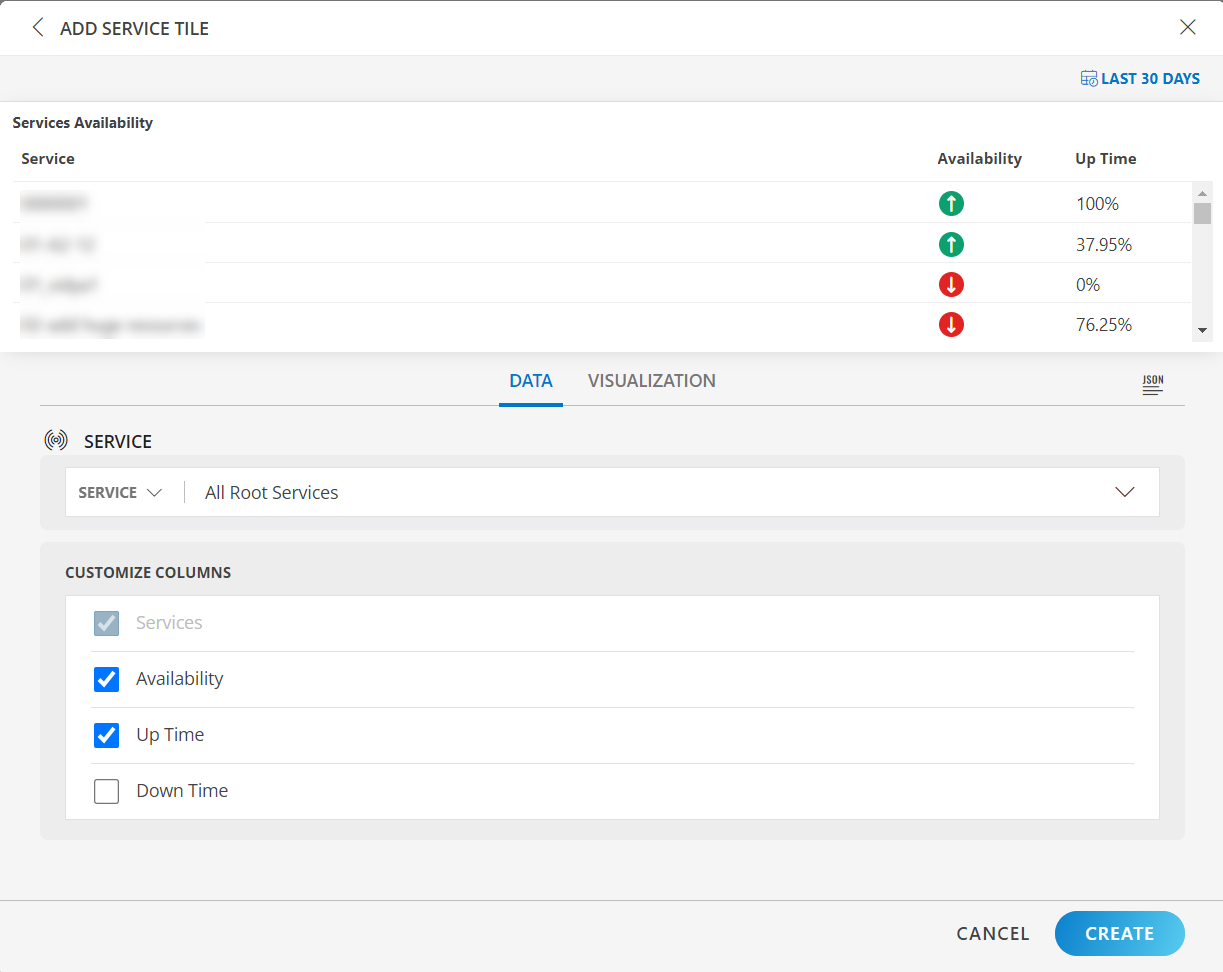
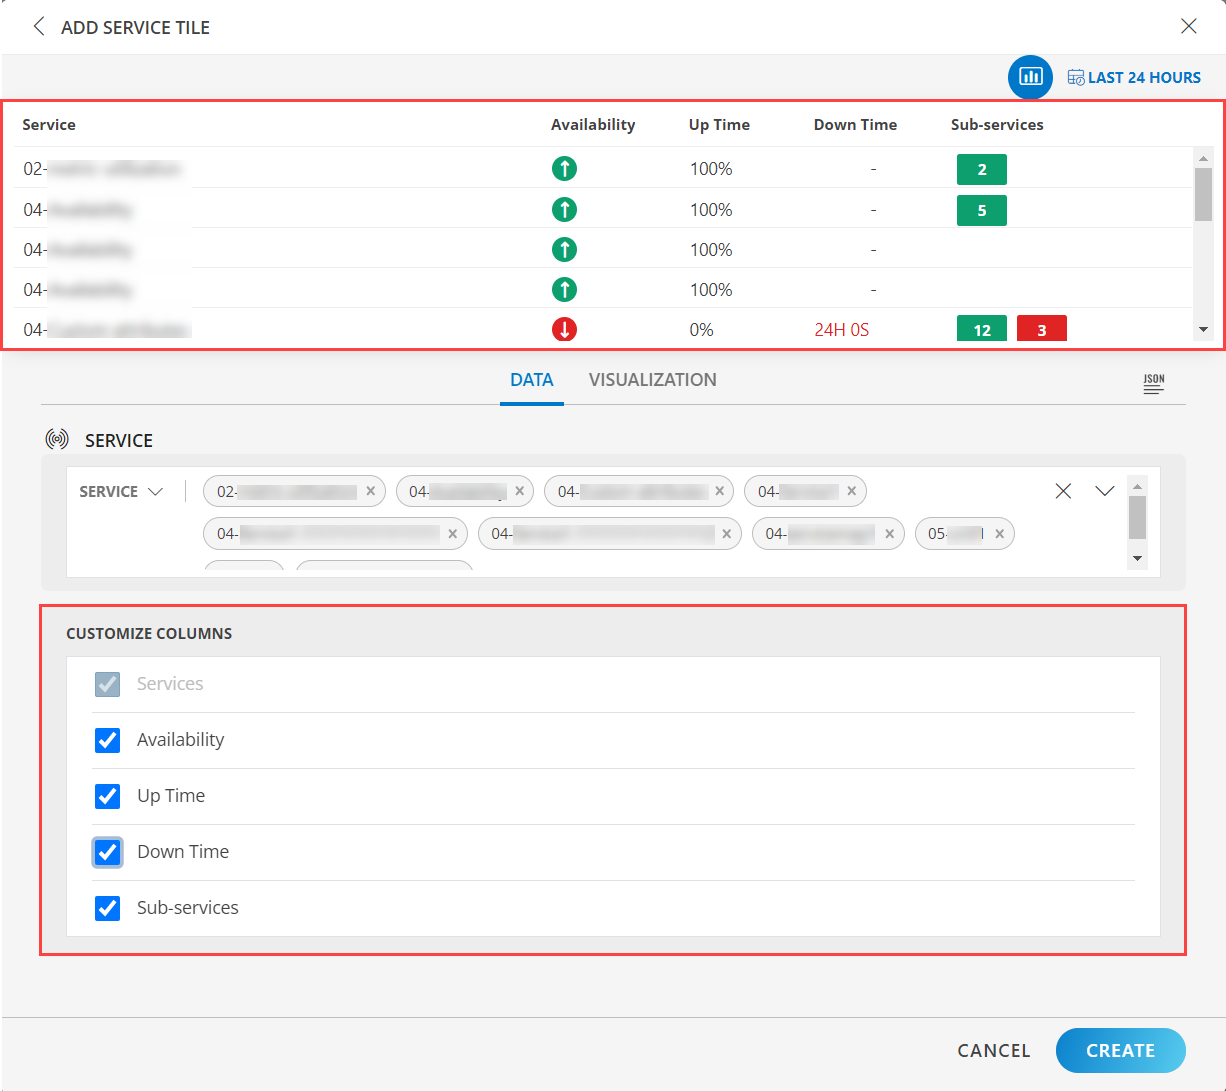
- Select the Build my own tab. This enables you to create a custom tile.
The following screen is displayed when partner and client is selected:
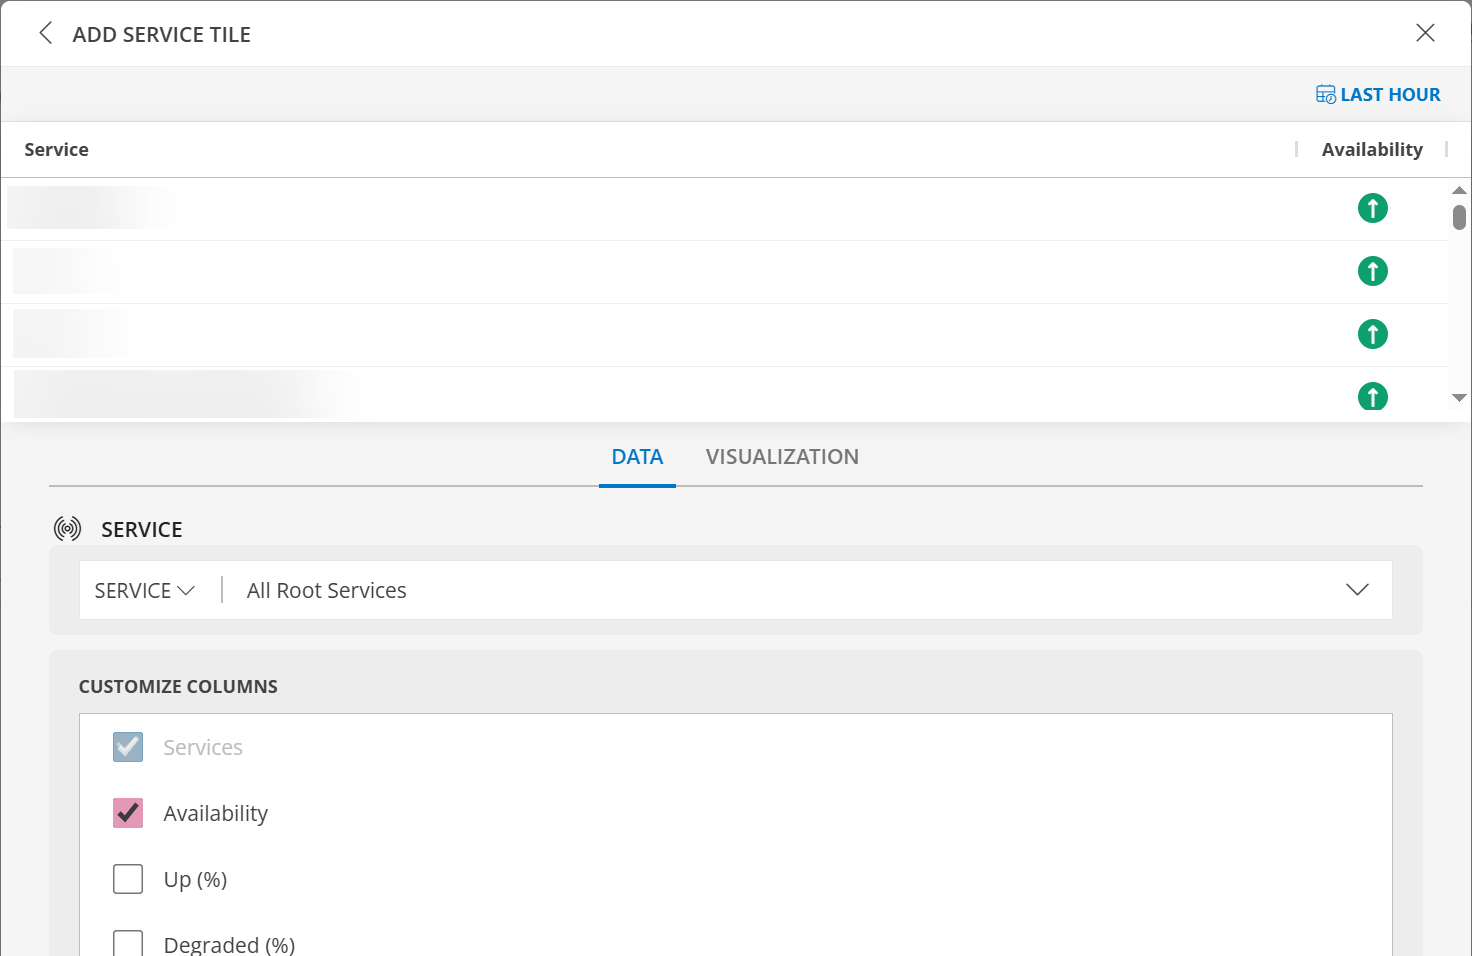
- Select the service from the SERVICE drop-down.
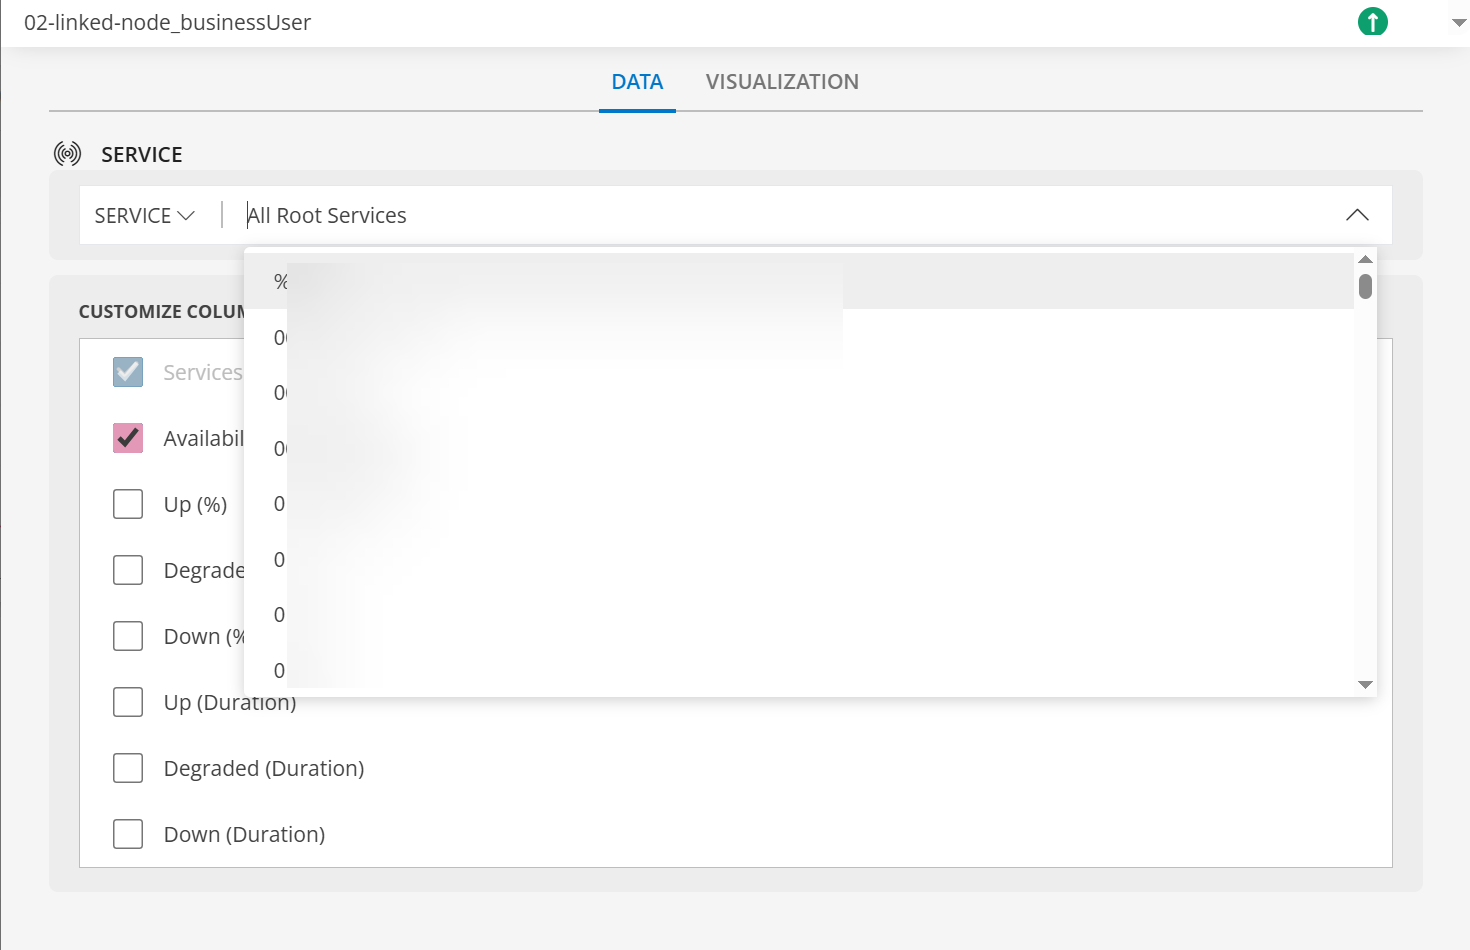
- In the CUSTOMIZE COLUMNS section, select the checkbox to display the information.
| Functionality | Description |
|---|---|
| Services | Name of the Service Notes:
|
| Availability | Check the status of the Service. Note: The "availability" column of the service tile always represents the "availability" status irrespective of historic time-period set for the widget, we recommend users to select "Downtime" column to know about the historic availability status of the service. This represents the overall visualization of "Availability" till now. |
| Up Time (%) | View the Up Time in percentage format. This value can be defined up to eight decimal places. The default is 2 decimal places. | Up Time (hours) | View the Up Time in an hours and minutes format. | Down Time (%) | View the Down Time in percentage format. This value can be defined up to eight decimal places. The default is 2 decimal places. |
| Down Time (hours) | View the Down Time in an hours and minutes format. Note: Hover on the Hours and Seconds to view the Start and End time of the availability. |
| Sub-services | View the number of Sub-services to the specific service. |
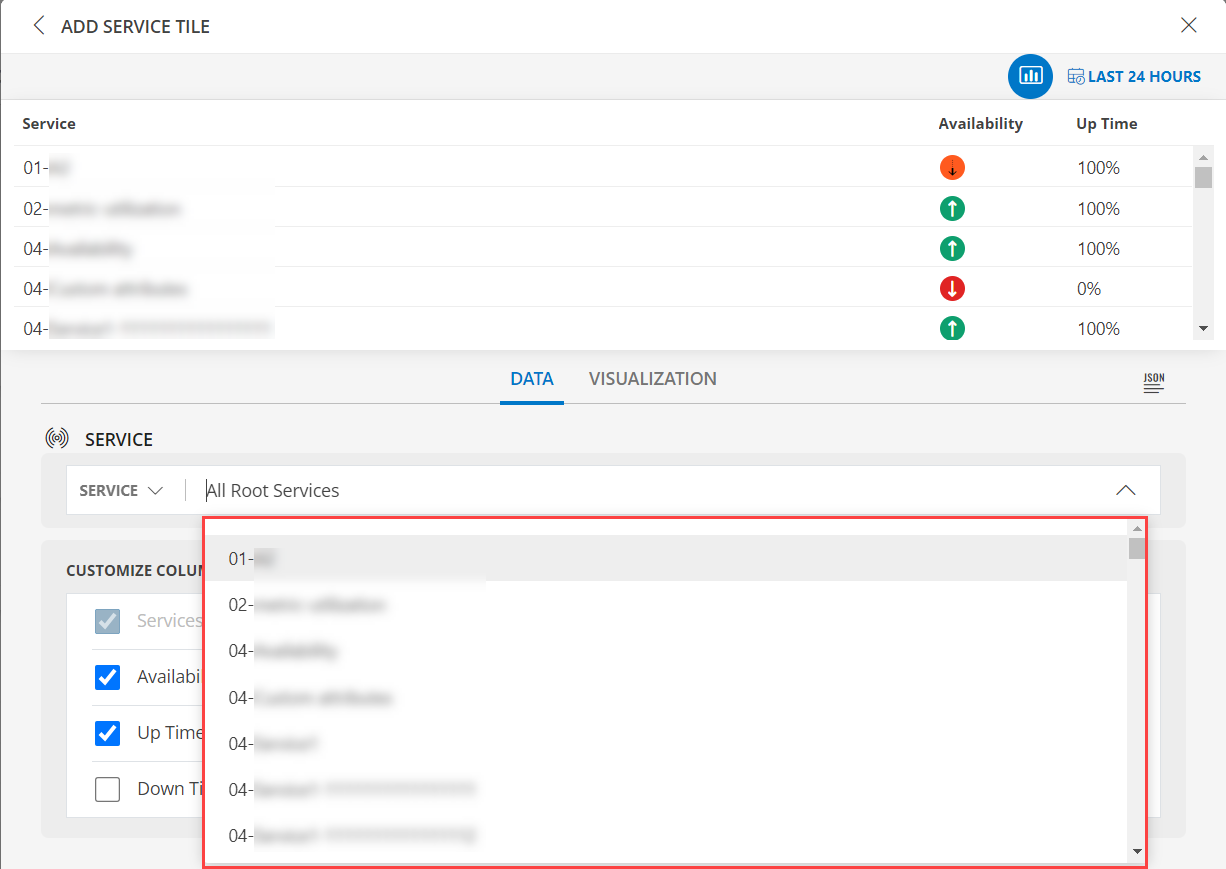
The following screen is displayed when partner is selected:
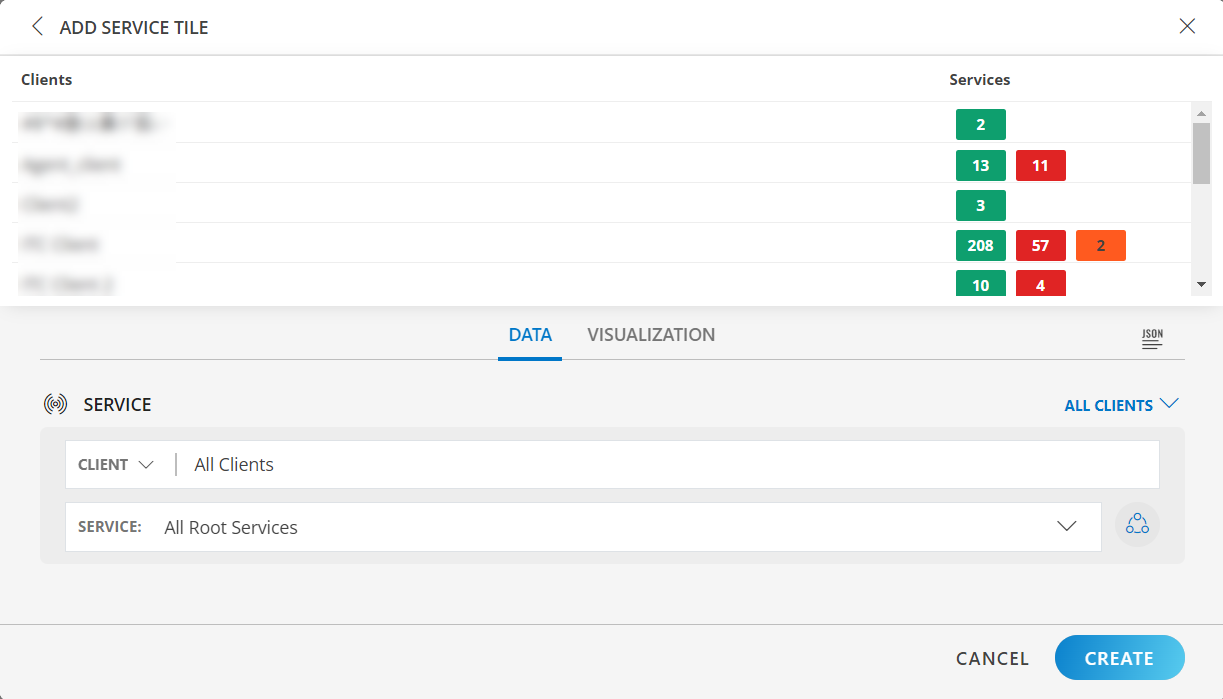
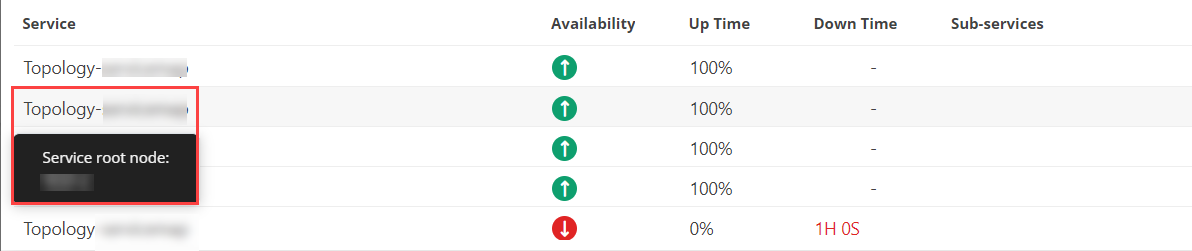
- Hover on the service to view the status of the Service.
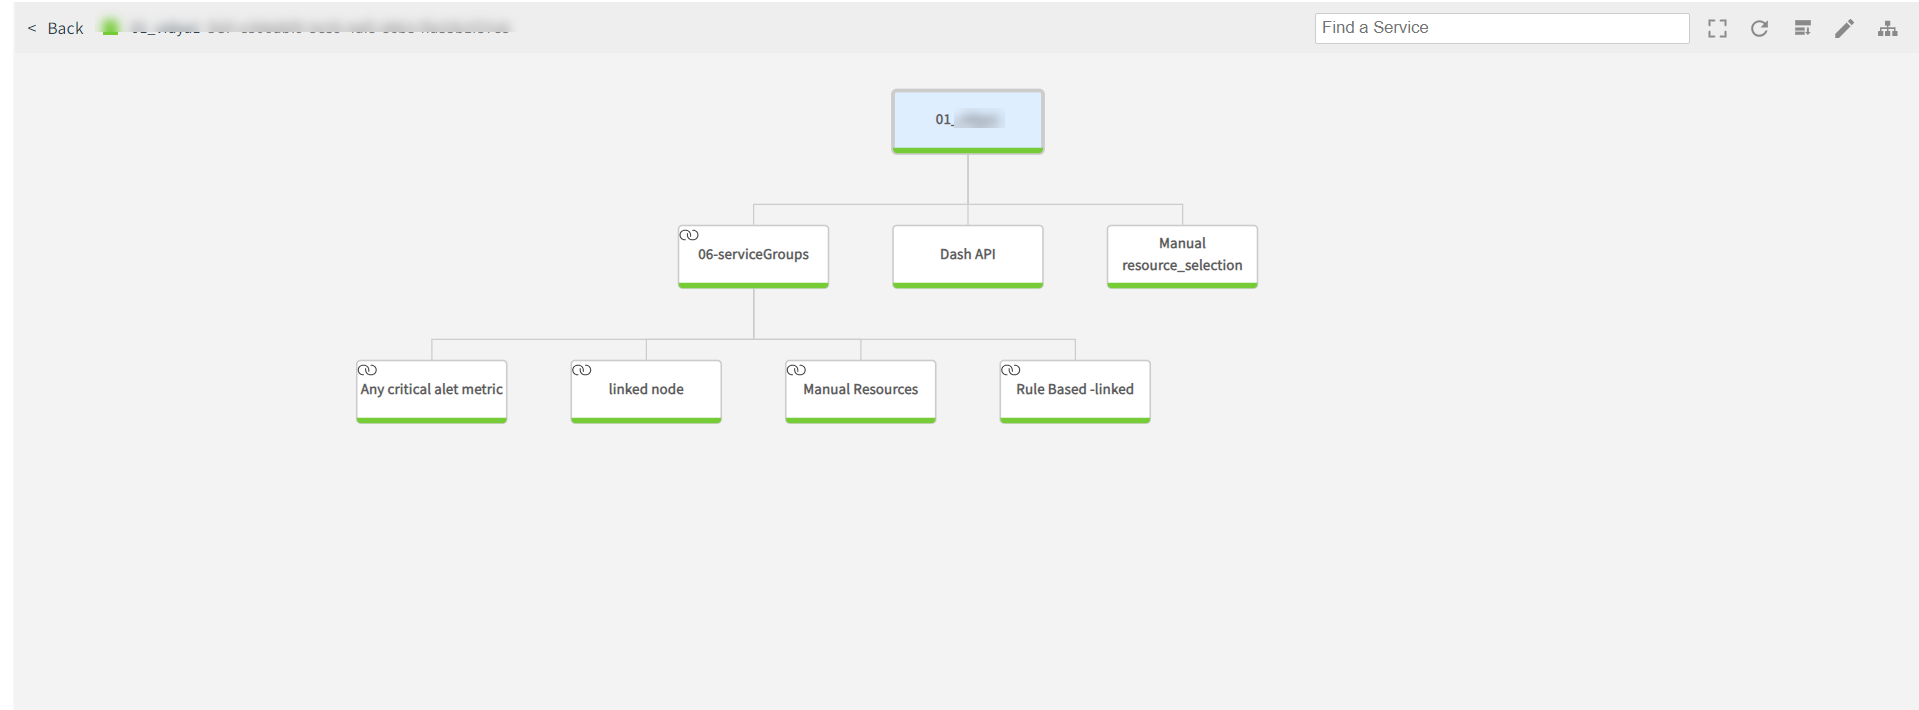
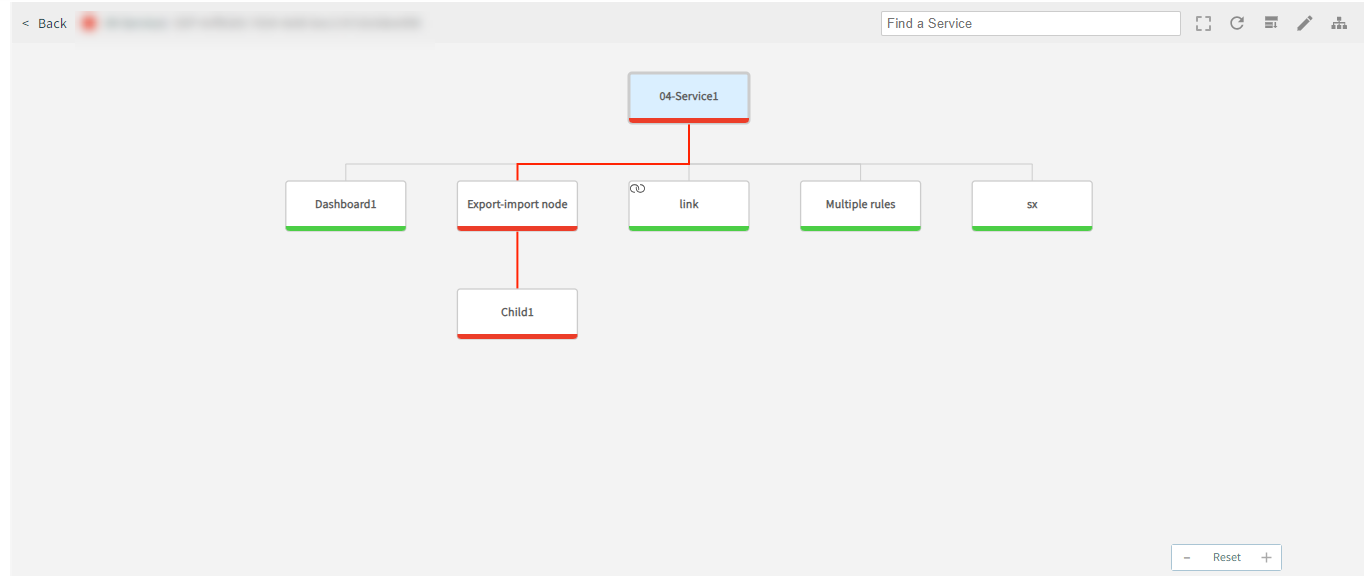
- Click any Service, this would redirect you to the service map, enabling you to quickly explore and display the parent node and child node alerts information in detail.
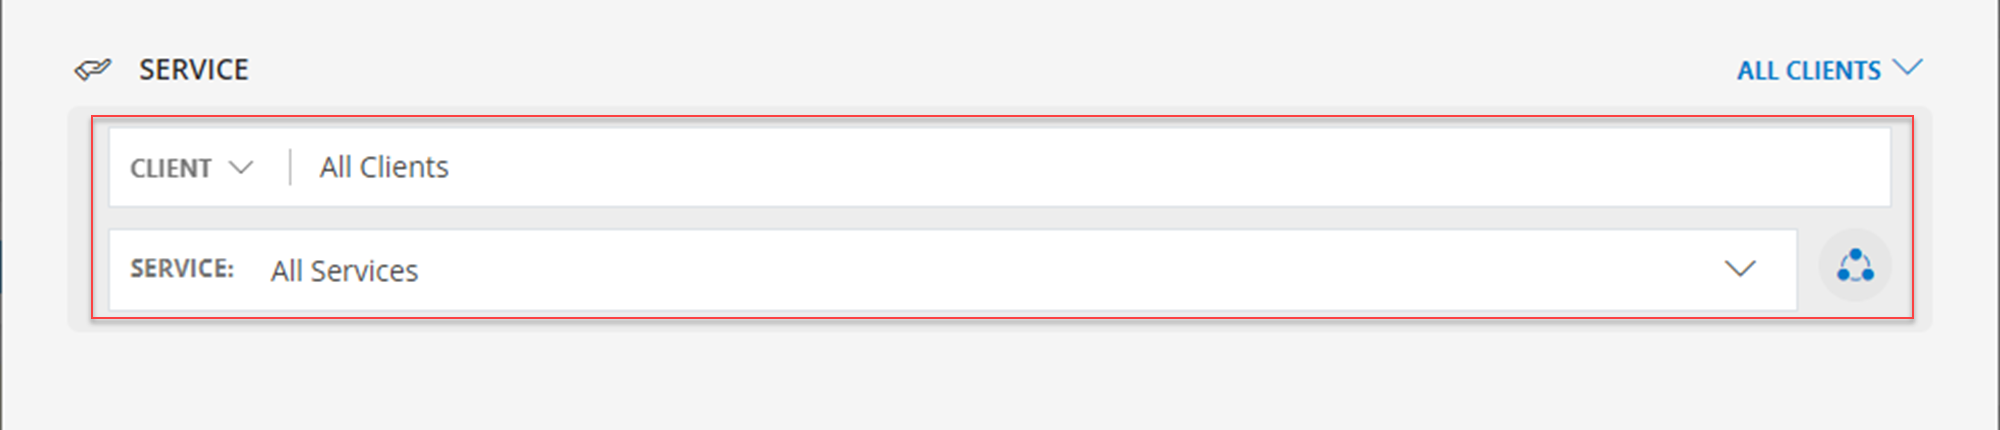
- In the SERVICE section, you have the below drop-downs:
| Functionality | Description |
|---|---|
| CLIENT | The Client information is displayed Notes:
|
| SERVICE | Select the partner information from the drop-down list. Note: By default All Services is selected. |
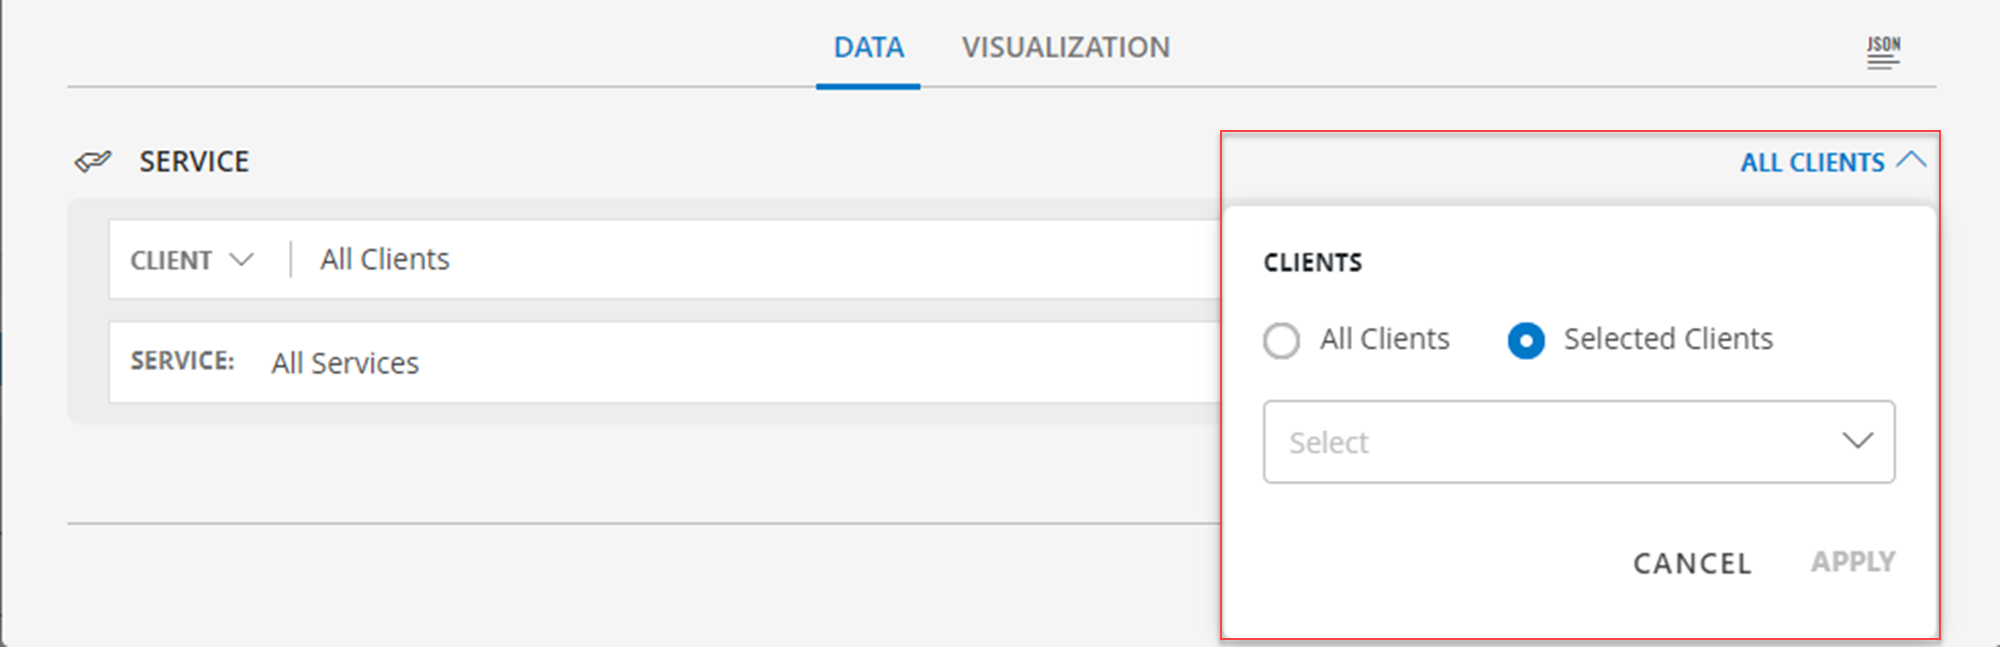
(Optional), click the ALL CLIENTS drop-down and click the Selected Clients radio button.
Note: At the dashboard level when you change All Clients to a specific client, and select the same client from Selected Clients, in the service tile that specific client data is populated.
(Optional) select the client from the drop-down list, and click APPLY.
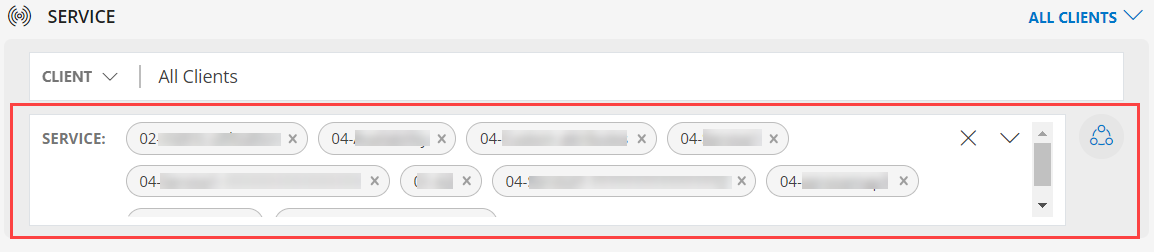
- Select the partner name from the SERVICE drop-down list.
Note: By default the Group Services is enabled, click the Grouped Services icon to disable.
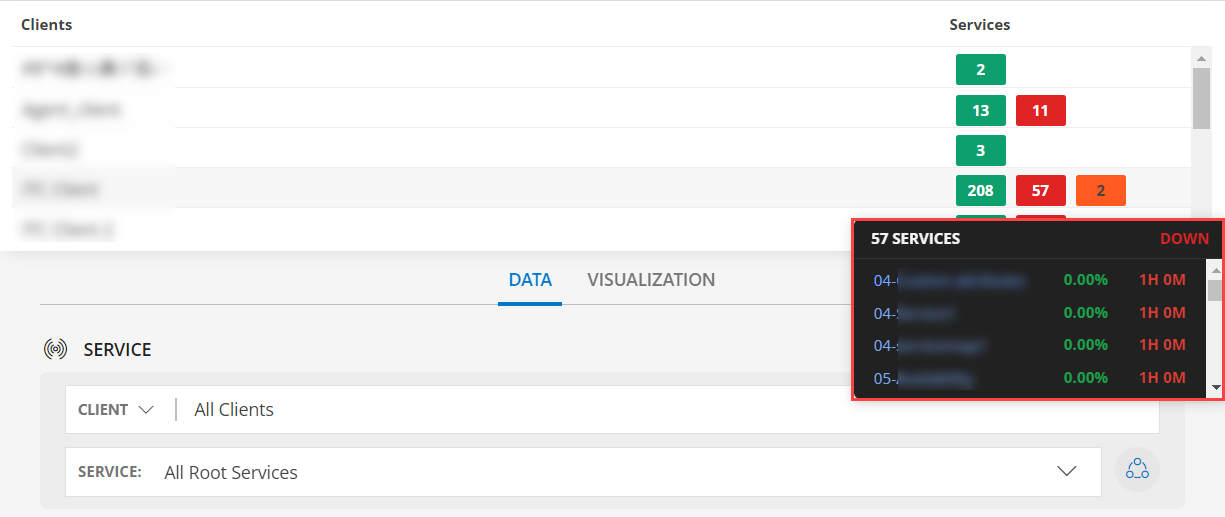
(Optional) Access the alerts specific to a service from the service widget:
- Click the Group Service icon to examine the alert statuses.
- Hover on the service to view critical and warning alerts.
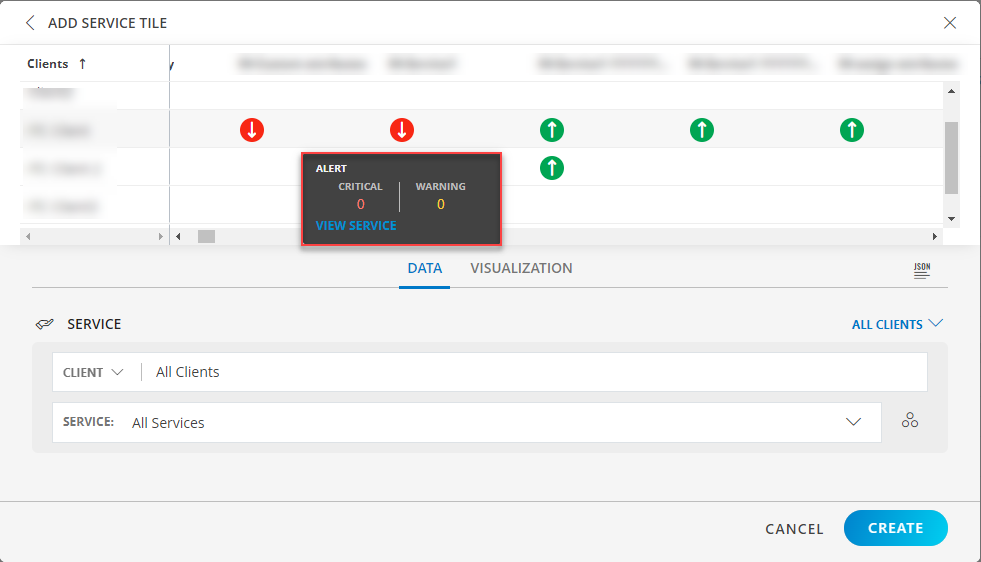
- Click VIEW SERVICE, this would redirect you to the service map, enabling you to quickly explore and display the parent node and child node alerts information in detail.
See Visualization to know on how to customize the Service Tile.
Click CREATE. The Service tile is created and displayed on the main dashboard page.
Service Availability
Click here to view how to Service Avaulability
- Select the Service Availability tab.

The following screen is displayed when partner and client is selected:
- Select the service from the SERVICE drop-down.
- In the CUSTOMIZE COLUMNS section, select the checkbox to display the information.
| Functionality | Description |
|---|---|
| Services | Name of the Service Notes:
|
| Availability | Check the status of the Service. Note: The "availability" column of the service tile always represents the "availability" status irrespective of historic time-period set for the widget, we recommend users to select "Downtime" column to know about the historic availability status of the service. This represents the overall visualization of "Availability" till now. |
| Up Time | View the Up Time percentage the Service. |
| Down Time | View the Down Time in hours and minutes of the Service. Note: Hover on the Hours and Seconds, to view the Start and End time of the availability. 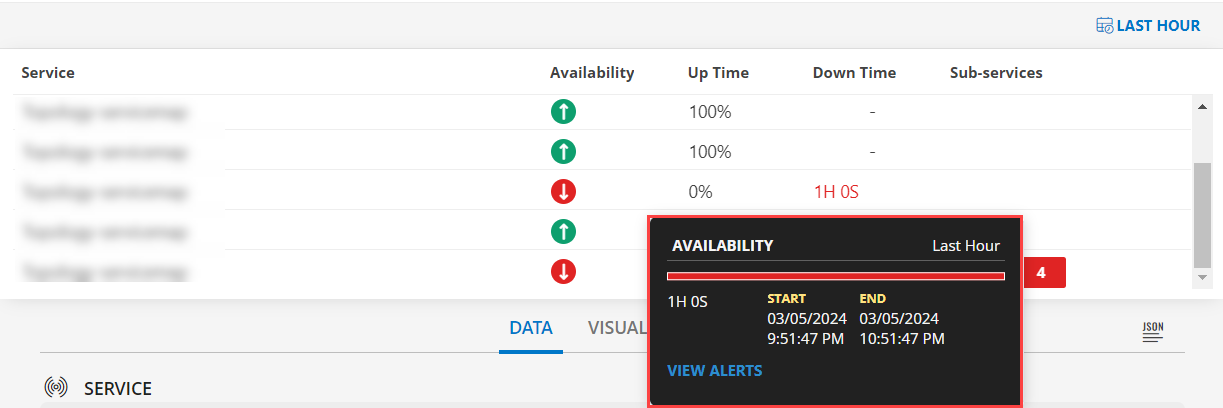 |
| Sub-services | View the number of Sub-services to the specific service. |
The following screen is displayed when partner is selected:
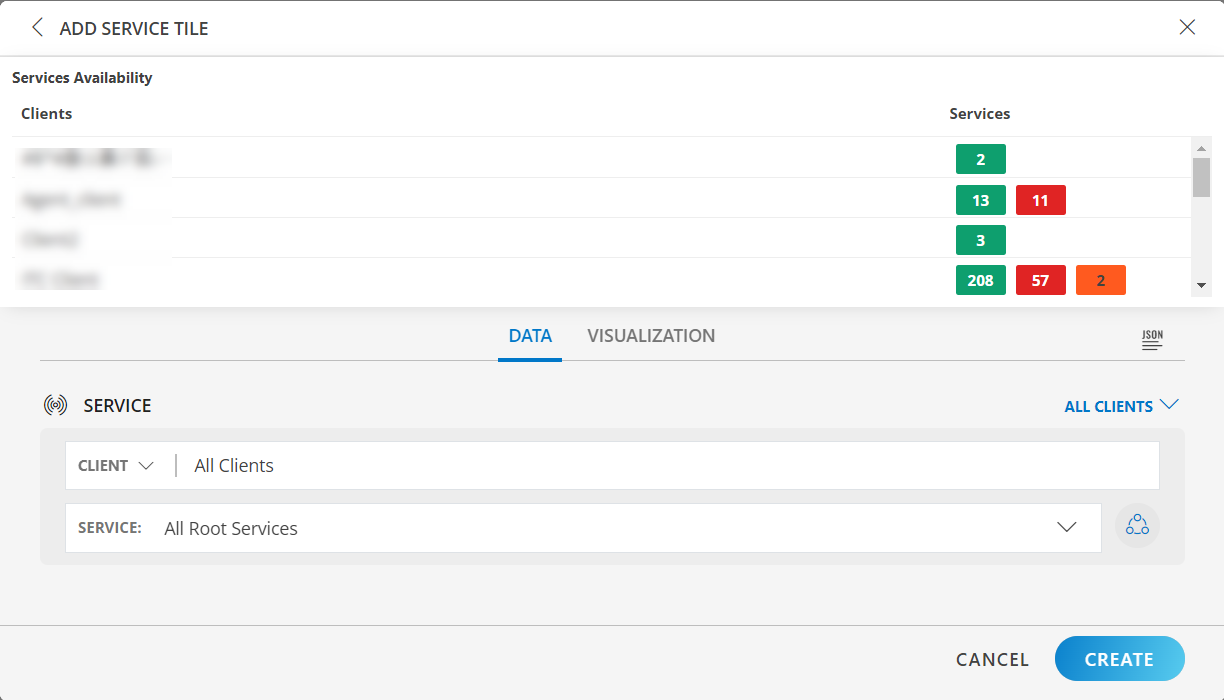
- Hover on the service to view the status of the Service.
- Click any Service, this would redirect you to the service map, enabling you to quickly explore and display the parent node and child node alerts information in detail.
- In the SERVICE section, you have the below drop-downs:
| Functionality | Description |
|---|---|
| CLIENT | The Client information is displayed Notes:
|
| SERVICE | Select the partner information from the drop-down list. Note: By default All Services is selected. |
(Optional), click the ALL CLIENTS drop-down and click the Selected Clients radio button.
Note: At the dashboard level when you change All Clients to a specific client, and select the same client from Selected Clients, in the service tile that specific client data is populated.
(Optional) select the client from the drop-down list, and click APPLY.
- Select the partner name from the SERVICE drop-down list.
Note: By default the Group Services is enabled, click the Grouped Services icon to disable.
(Optional) Access the alerts specific to a service from the service widget:
- Click the Group Service icon to examine the alert statuses.
- Hover on the service to view critical and warning alerts.
- Click VIEW SERVICE, this would redirect you to the service map, enabling you to quickly explore and display the parent node and child node alerts information in detail.
See Visualization to know on how to customize the Service Tile.
Click CREATE. The Service tile is created and displayed on the main dashboard page.
Service Status
Click here to view how to Top Service Status
- Select the Service Status tab.

The following screen is displayed when partner and client is selected:
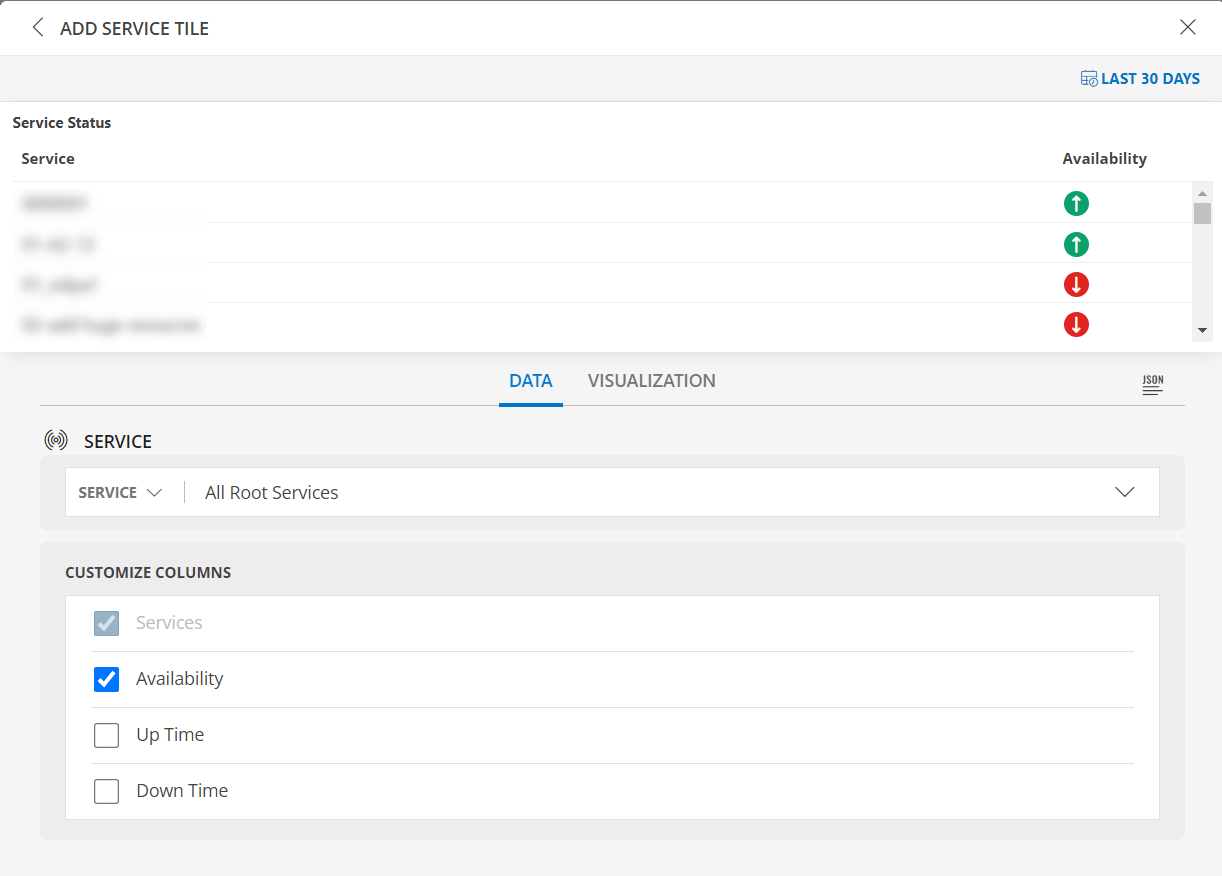
- Select the service from the SERVICE drop-down.
- In the CUSTOMIZE COLUMNS section, select the checkbox to display the information.
| Functionality | Description |
|---|---|
| Services | Name of the Service Notes:
|
| Availability | Check the status of the Service.Note: The "availability" column of the service tile always represents the "availability" status irrespective of historic time-period set for the widget, we recommend users to select "Downtime" column to know about the historic availability status of the service. This represents the overall visualization of "Availability" till now. |
| Up Time | View the Up Time percentage the Service. |
| Down Time | View the Down Time in hours and minutes of the Service. Note: Hover on the Hours and Seconds, to view the Start and End time of the availability. |
| Sub-services | View the number of Sub-services to the specific service. |
The following screen is displayed when partner is selected:
- Hover on the service to view the status of the Service.
- Click any Service, this would redirect you to the service map, enabling you to quickly explore and display the parent node and child node alerts information in detail.
- In the SERVICE section, you have the below drop-downs:
| Functionality | Description |
|---|---|
| CLIENT | The Client information is displayed Notes:
|
| SERVICE | Select the partner information from the drop-down list. Note: By default All Services is selected. |
(Optional), click the ALL CLIENTS drop-down and click the Selected Clients radio button.
Note: At the dashboard level when you change All Clients to a specific client, and select the same client from Selected Clients, in the service tile that specific client data is populated.
(Optional) select the client from the drop-down list, and click APPLY.
- Select the partner name from the SERVICE drop-down list.
Note: By default the Group Services is enabled, click the Grouped Services icon to disable.
(Optional) Access the alerts specific to a service from the service widget:
- Click the Group Service icon to examine the alert statuses.
- Hover on the service to view critical and warning alerts.
- Click VIEW SERVICE, this would redirect you to the service map, enabling you to quickly explore and display the parent node and child node alerts information in detail.
- See Visualization to know on how to customize the Service Tile.
- Click CREATE. The Service tile is created and displayed on the main dashboard page.
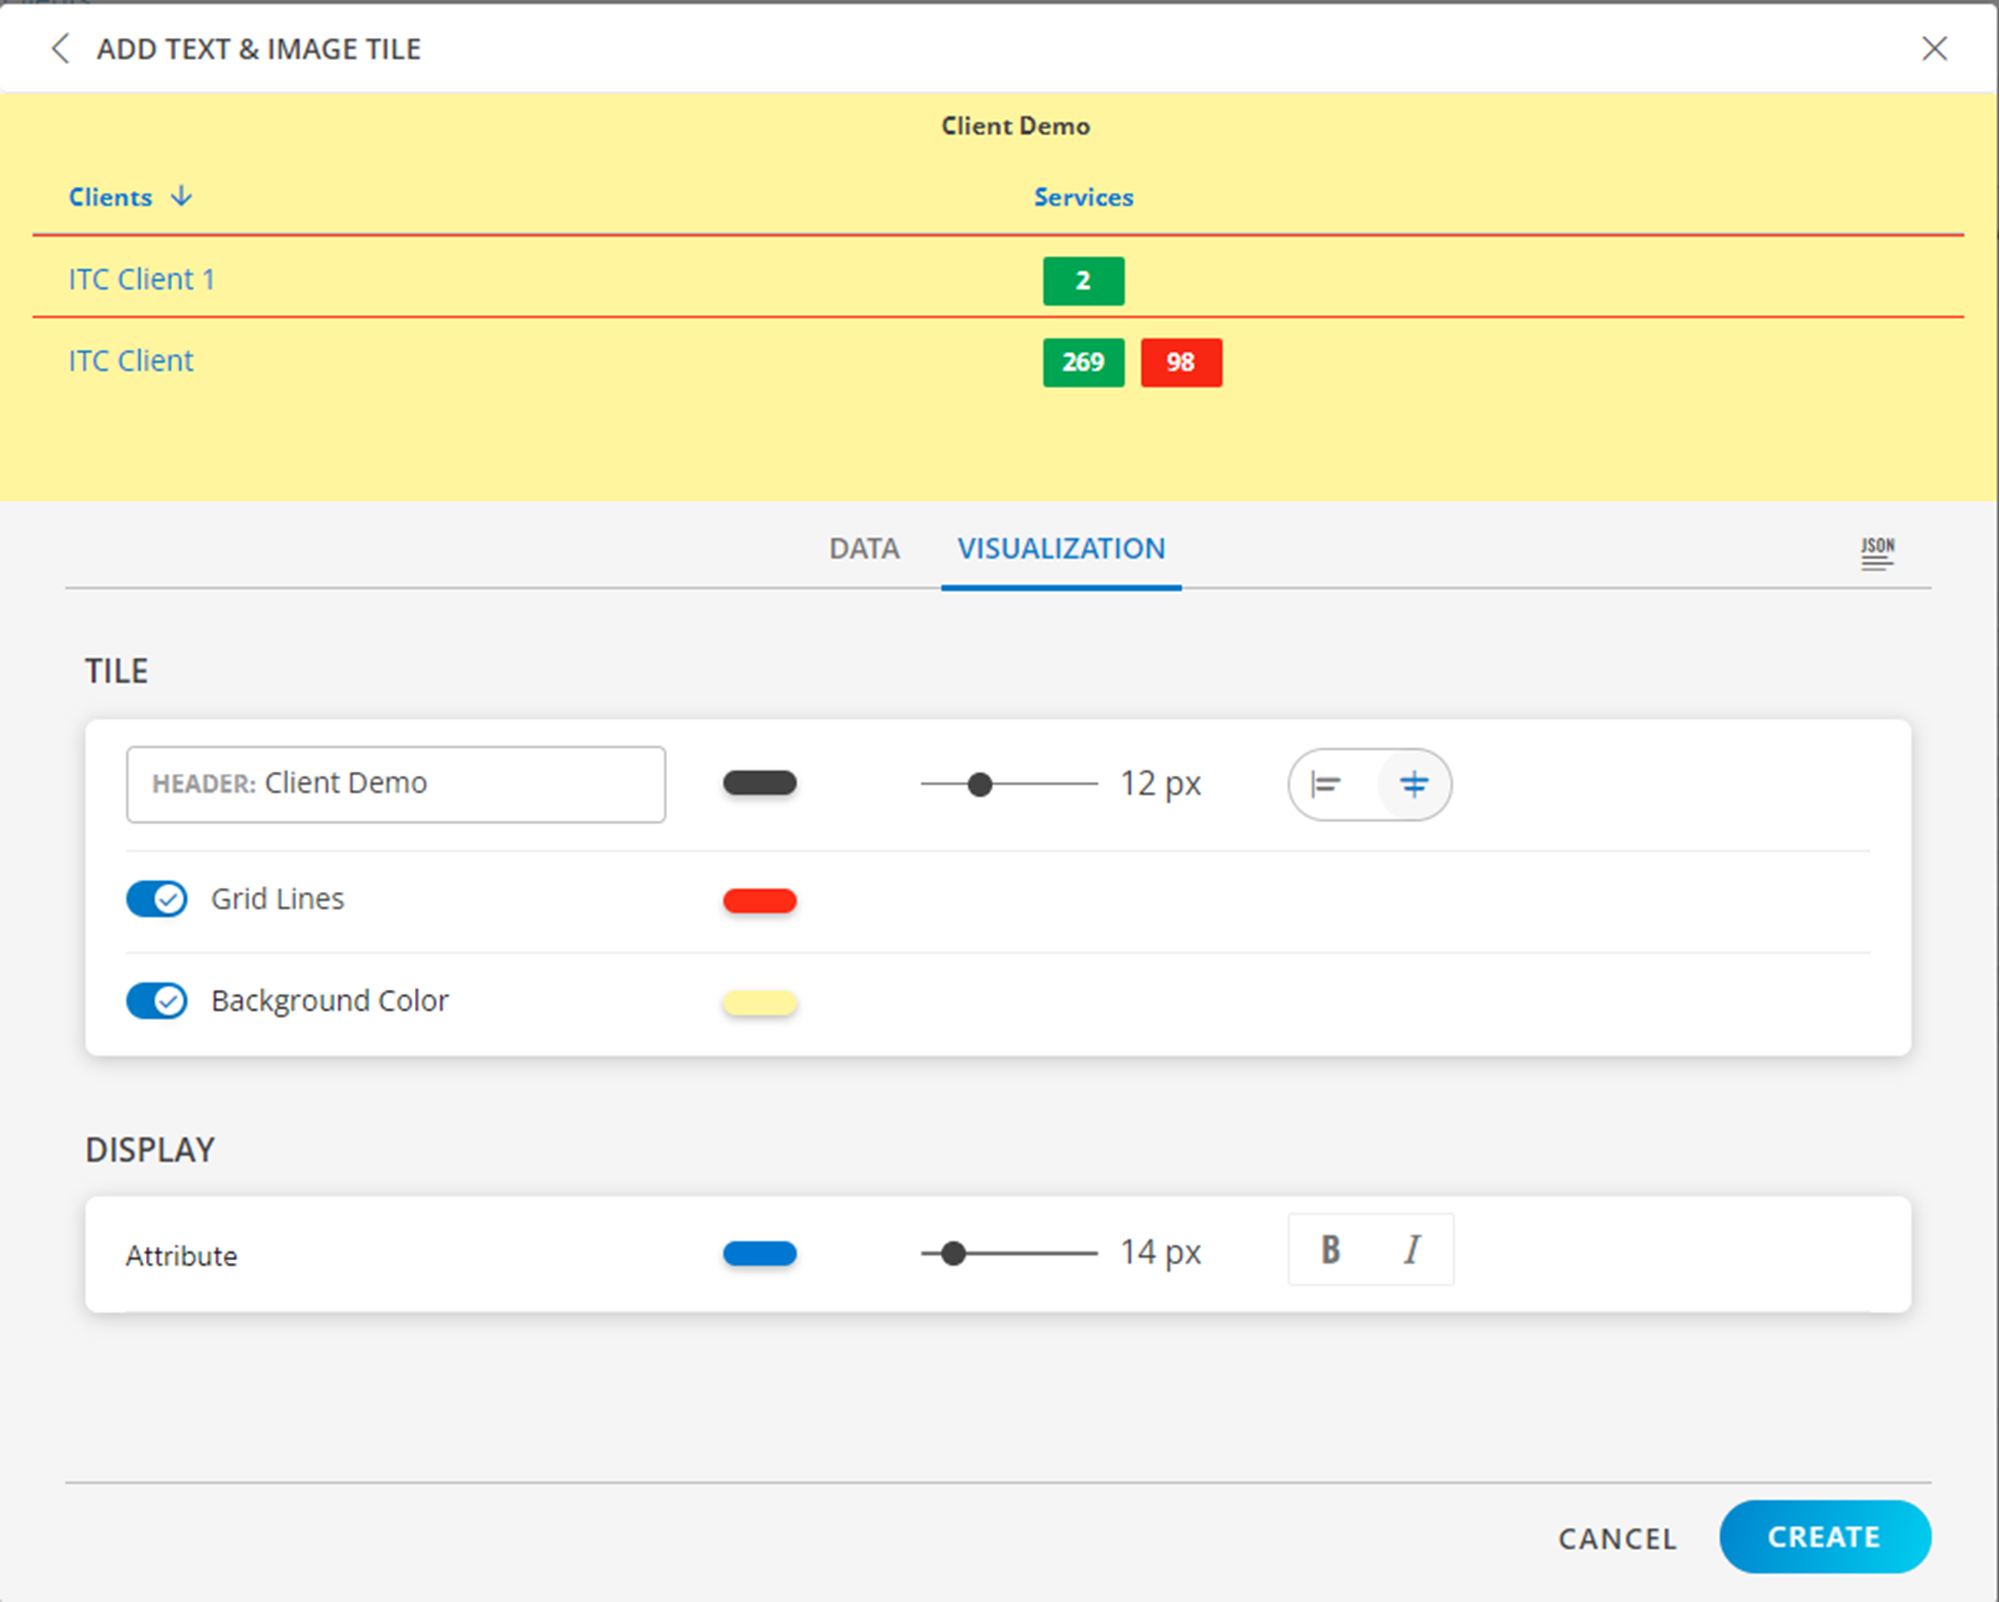
Visualization
- Click the Visualization tab to customize the visualization further:
HEADER: Set a name, color, size, and alignment for the header.
Grid Lines: Select the color of the grid lines, enable or disable the grid lines by clicking the toggle ON or OFF, Grid Lines option.
Note: By default the Grid Lines is enabled.
Background Color: Select the background color, enable or disable the background color by clicking the toggle ON or OFF background color.
Note: By default the Background Color is disabled.
Attribute: Select the color for the attribute, the size, bold or Italics.