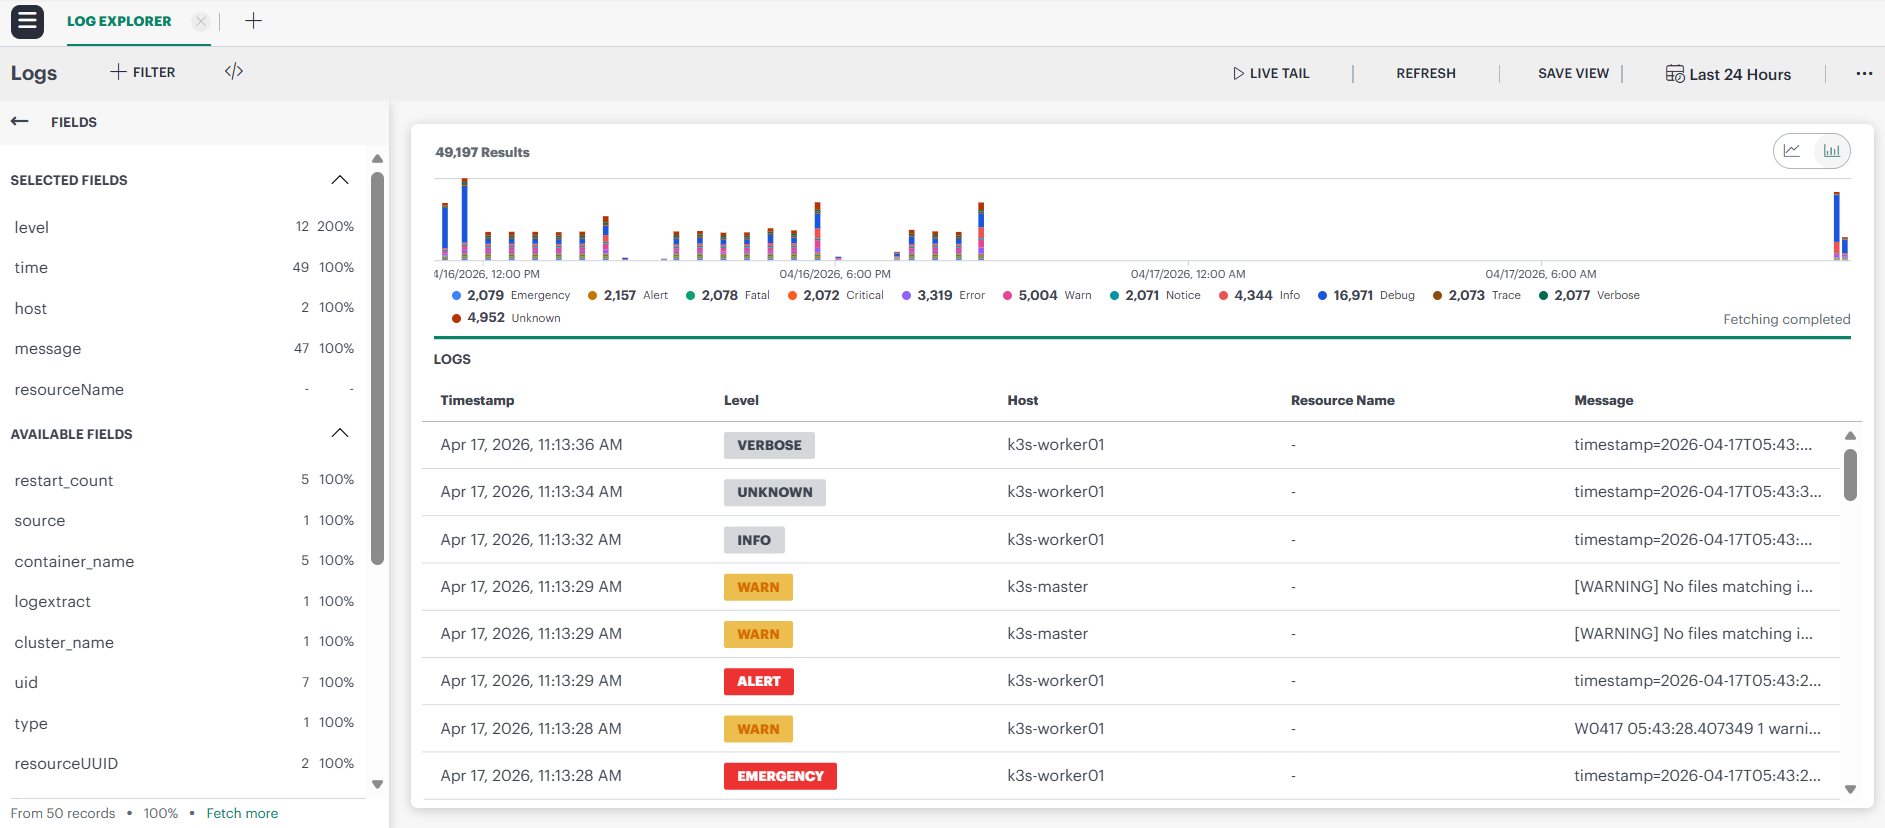
The Logs Explorer allows you to view the logs emitted by resources in the default workspace.
To view the logs:
- Navigate to Infrastructure > Logs. The Logs Explorer page is displayed.

- Refer to the table below to perform actions in the Log Explorer:
| Callout | Description |
|---|---|
| 1 | Click to access the Favorite and Quick Links> section. You can also access saved views under MY LOGS VIEWS page. |
| 2 | Filter the logs using LOGQL attributes. |
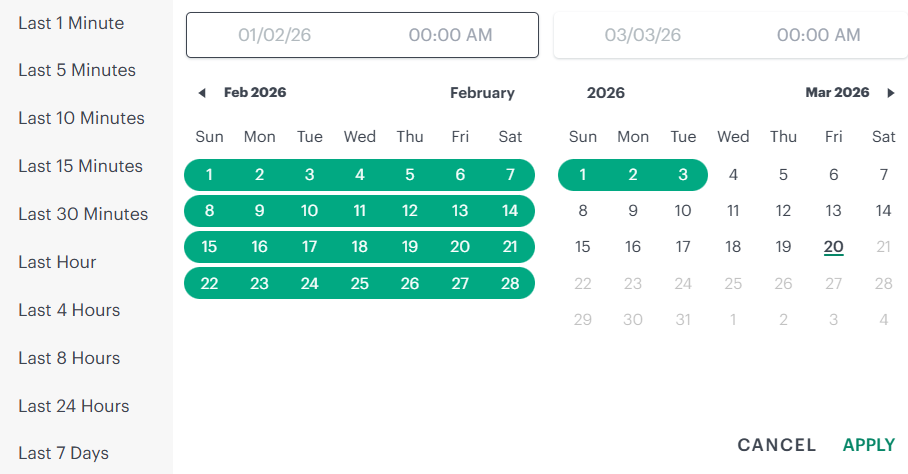
| 3 | Logs can be filtered using given preset window periods.For custom time range selection, choose the given preset periods and adjust the start and end dates to filter the logs.
Note: Max. time range selection window is any 31 days to filter logs. |
| 4 | Displays the log results with time span and count based on the custom query selection. |
| 5 | Select the individual logs to display the log details in the side panel. |
| 6 | The fields column can be used to filter the logs by selected fields. The user can favorite commonly used fields, as well as view the percentage and raw count of logs using the fields.Displays the top 50 records based on the selected time range. To view additional records, click the Fetch More option. |

Use the Live Tail feature
The Live Tail feature in the Logs Explorer allows you to monitor real-time logs as they are generated. The real-time monitoring provides instant visibility into system events and errors, eliminating the need to refresh or manually retrieve data.
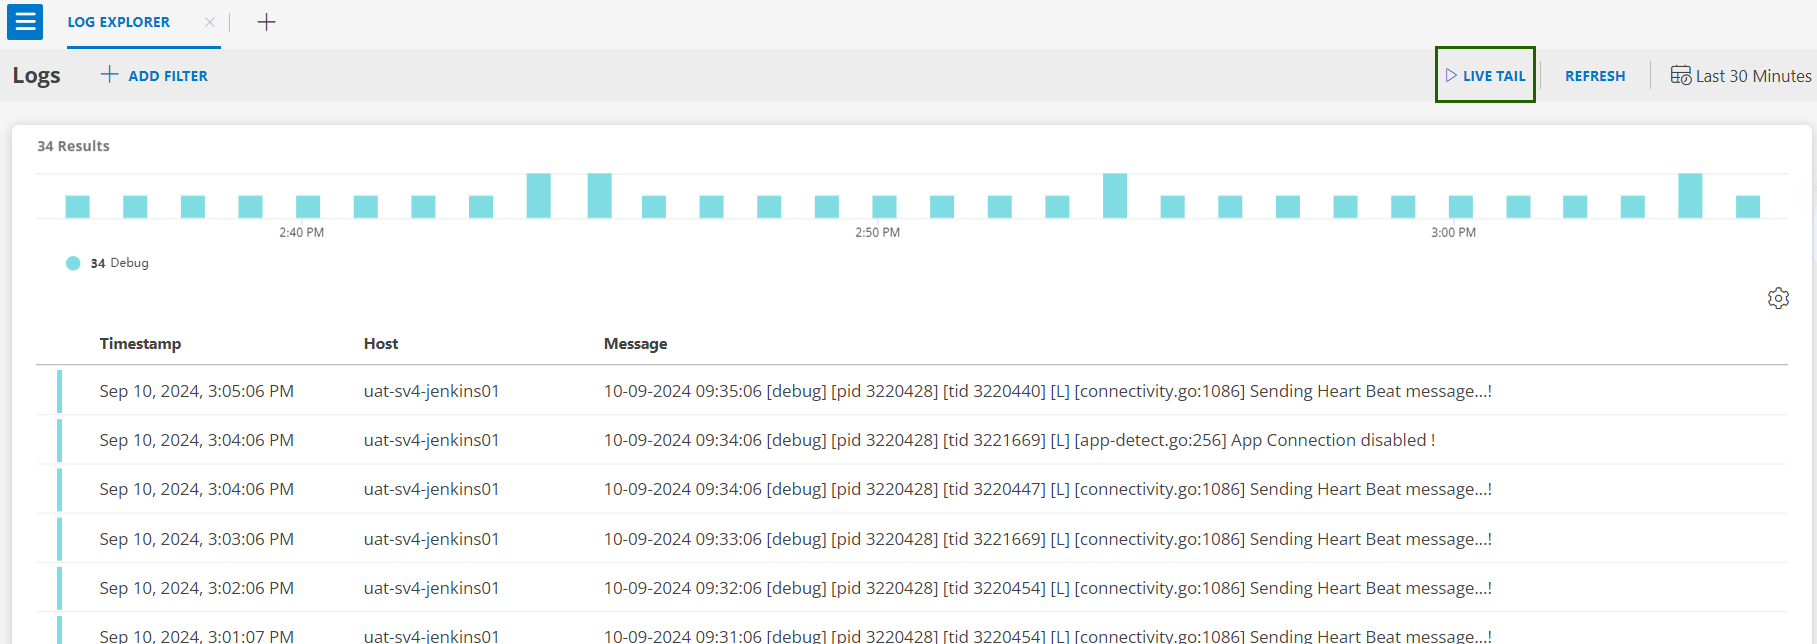
Access the Live Tail
- On the log explorer, click Live Tail.This will bring up a Logs screen displaying real-time logs.
- On the live tail page, click +ADD FILTER to filter the incoming data by selecting the attributes you want to filter by. This allows you to narrow down the logs to those most relevant to your needs.
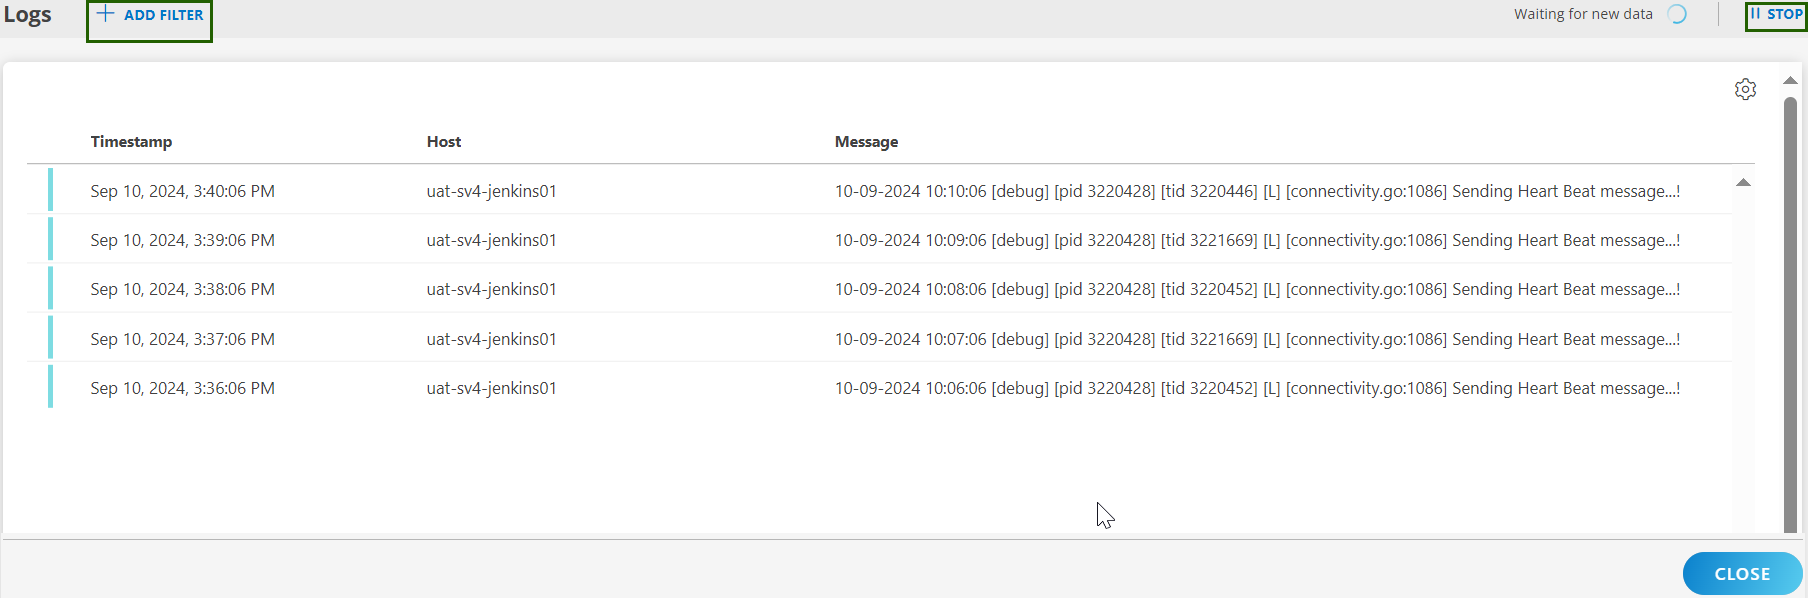
- You can also stop or start the real-time logs monitoring.
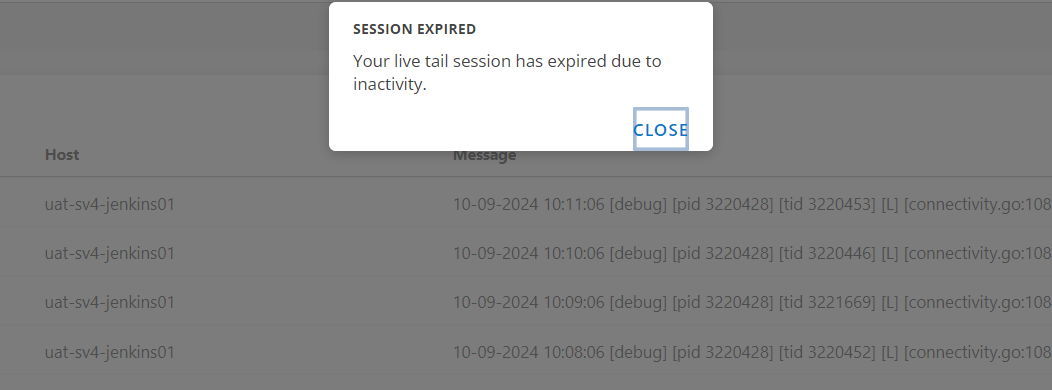
If you are inactive for more than 5 minutes while using the Live Tail feature, a dialog box will appear stating that your session has expired. You will need to refresh the session to continue monitoring logs in real-time.
Fields
The Fields column in the Logs Explorer page allows users to efficiently filter log results based on commonly used fields. This feature provides insights into the available fields within the log data, displaying both the raw count and percentage of usage for each field.
Key Capabilities:
- Quick Filtering: Easily narrow down log results by selecting relevant fields.
- Usage Insights: View the frequency and percentage of each field to identify commonly occurring attributes.
To filter logs using the fields:
- Click a field to view the available values for that field.

- Click the three dots beside a value to access filtering options.
- Choose to filter logs by either:
- Matching values (show only logs containing the selected value).
- Excluding values (hide logs containing the selected value).

- The filter query will automatically update based on your selection.
- The below example shows the syntax for excluding a specific value.

Navigate to Kubernetes (K8s) resources
You can directly navigate to the specific Kubernetes (K8s) resource that generated a log from log details page. This enhancement provides quick access to relevant resources for efficient troubleshooting.
Note
Prerequisite: The Kubernetes 2.0 agent must be installed on the client.To navigate to K8s resource:
On the log explorer, click on the log entry to open the log details page.
On the log details page, locate the Kubernetes resource link under RELATED RESOURCES section.

Click the hyperlink to directly open the corresponding K8s resource.
Severity Representation in Logs Explorer
The Logs Explorer displays log entries using color‑coded severity labels based on the normalized severity mapping. This visual representation helps you quickly identify high‑priority log entries and analyze log trends more efficiently.
Severity Display
Each log entry shows its normalized Severity Level in the Level column.
- Severity levels are displayed as colored badges, making it easy to distinguish critical logs from informational or verbose messages at a glance.
- The severity shown in Logs Explorer reflects the canonical severity determined during log ingestion.
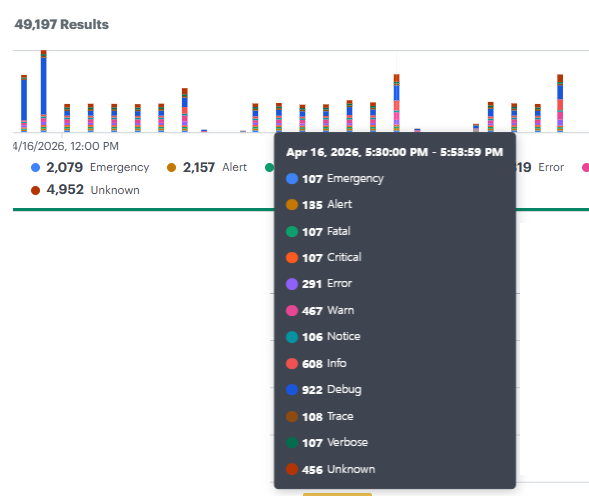
Severity Distribution Chart
At the top of the Logs Explorer page, the Severity Distribution Chart provides an aggregated view of the number of logs per severity level for the selected time range.
- Each severity level is represented as a distinct colored segment in the chart.
- Hovering over a segment shows the total count of logs for that severity.
- This chart helps you quickly identify trends and spikes in higher‑severity logs such as Emergency, Critical, or Alert.
Note
The colors used in the Severity Distribution Chart are independent of the severity color mapping applied to individual log entries in the log list and Logs Tail view. Chart colors are used only for visual differentiation within the graph and do not represent the canonical severity color scheme.Filtering Logs by Severity
You can filter logs using the normalized severity levels across Logs Explorer and other log‑dependent features.
- Use the Level field to filter logs by one or more severity values.
- Filters support all canonical severities, including: Critical, Emergency, Alert, Notice, Verbose, and others.
This allows you to focus on logs that are most relevant during incident investigation or routine monitoring.