Windows event log monitors the event logs generated in the system viewer of all Windows operating systems in your network. Alerts are generated depending on the conditions specified in the monitor.
The Windows event log monitoring involves the following functions:
- Defining the pre-processing policy in the event log monitor.
- Receiving, pre-processing, and normalizing the logs in the agent.
Create a Windows event log monitoring template
Follows these steps to create an event log monitor:
Select a client from the All Clients list.
Navigate to Setup > Monitoring > Templates.
Click + Add.
Enter the following information:
Property Description Select Template Scope Template scope: - Partner Template
- Client-specific Template
Client This field is populated if you select Template Scope as Client Specific Template.
Select a client from the drop-down list.Collector Type For Windows event logs, select Agent. Monitor Type Select G1 Monitors as monitor type. Applicable For Select resource. Template Name Provide the template name. Description Provide the template description. Generation The Generation template belongs to. Pre-populated depending on the Monitor Type selection. Version Template version. Fixed value = 1.Tags User-defined tags for easy reference. Prerequisites User-defined prerequisites of what to consider when using this template. Status Template status: Active Notes Template notes. Template Family Name User-defined template family name. Deployment Type Deployment type: Standard Expand the Event Log Monitor section by clicking + Add.
Enter the following properties:
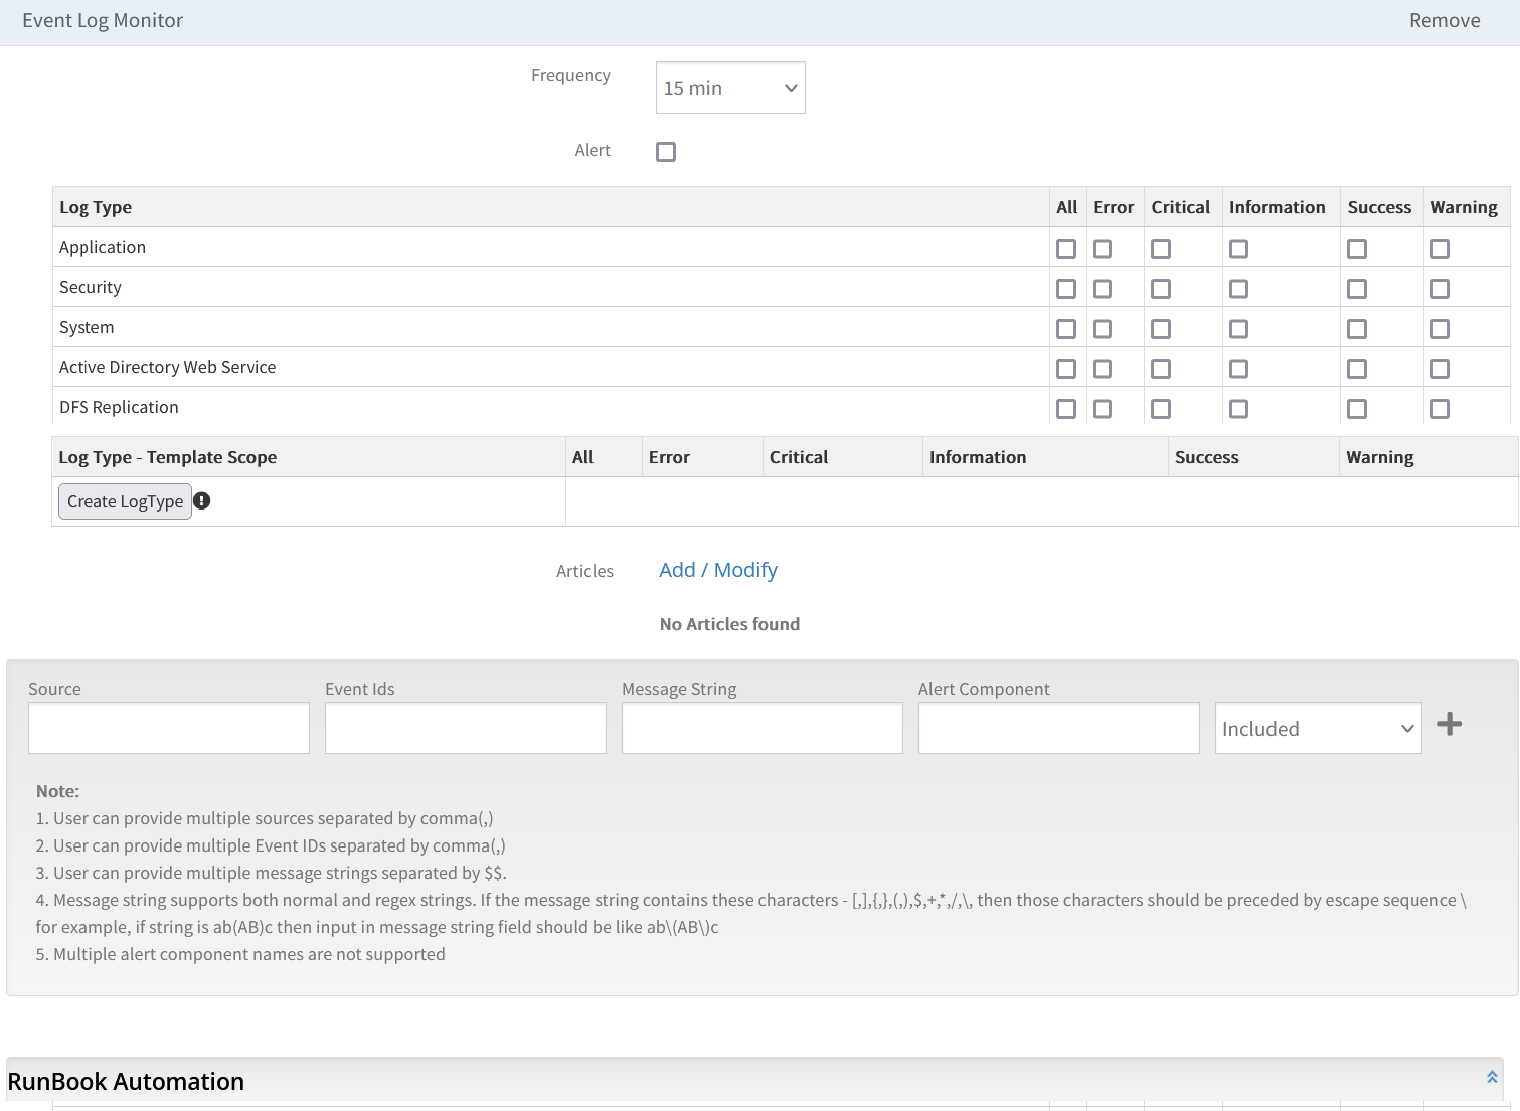
Property Description Frequency Log monitoring frequency. Recommended: 15 minutes. Alert Select the checkbox to initiate monitoring. Log Type For each category you want to associate with the event logs, select the severity level(s): - All: Select all severity levels.
- Error
- Critical
- Information
- Success
- Warning
Articles Knowledge base articles to attach to the template. Choose Select or Modify and select from the list of articles. Source Source names to monitor the events. You can enter multiple comma-separated sources. Note
If the Event Log Monitor is unable to find the given Source Name, you can use the Provider Name as an alternative.
Follow the steps below to retrieve the Provider Name:- Open the Event Viewer.
- Right-click on the event and select Properties.
- Go to the Details tab and switch to XML view.
- Locate the Provider Name field.
Event Ids Required event IDs. You can enter multiple comma-separated event IDs. Message String Event description or regex to to match against monitored events. You can enter multiple message strings separated by $$. The message string field supports both normal and regex strings. the following characters must be preceded by the\escape character:[,],{,},(,),$,+,*,/,\Alert Component The Alerts Component field requires users to enter the component name. The purpose of adding the Alert Component is that if the eventlog source names and eventid are the same but the message search string is different, the agent will create a separate eventlog alert based on the given component name.
The Alerts Component field is optional, and the alert component support is only available for the included drop-down filter.Included/Excluded From the drop-down, select: - Included: Monitor only the specified source name and event IDs or both from the specified input selected categories.
- Excluded: Skip specified source name and event IDs, or both, monitoring from the input selected categories.
RunBook Automation Configure the RunBook Automation. Click Save to apply the configuration parameters.
After configuring an event log monitor and assigning the template on the Windows resources, the agent starts collecting data according to the specified event log parameters and sends the alerts to the OpsRamp cloud.
Add custom event log monitors to the template
You can add, update, and delete the custom event logs to the template. This custom event log monitor will be available only to the specific template.
The purpose of this is to allow users to customize the event log monitors at the template scope by giving flexibility to add, update, and delete them as per their need without touching the global event log monitors.
Follow these steps to customize the event log monitors:
Select a client from the All Clients list.
Navigate to Setup > Monitoring > Templates.
Use the Advanced Search to search for the G1 based template with agent as collector type.
Click the template name to view the template details.
Go to the Event log monitor section.
Select the frequency of monitor and select the Alert check box.
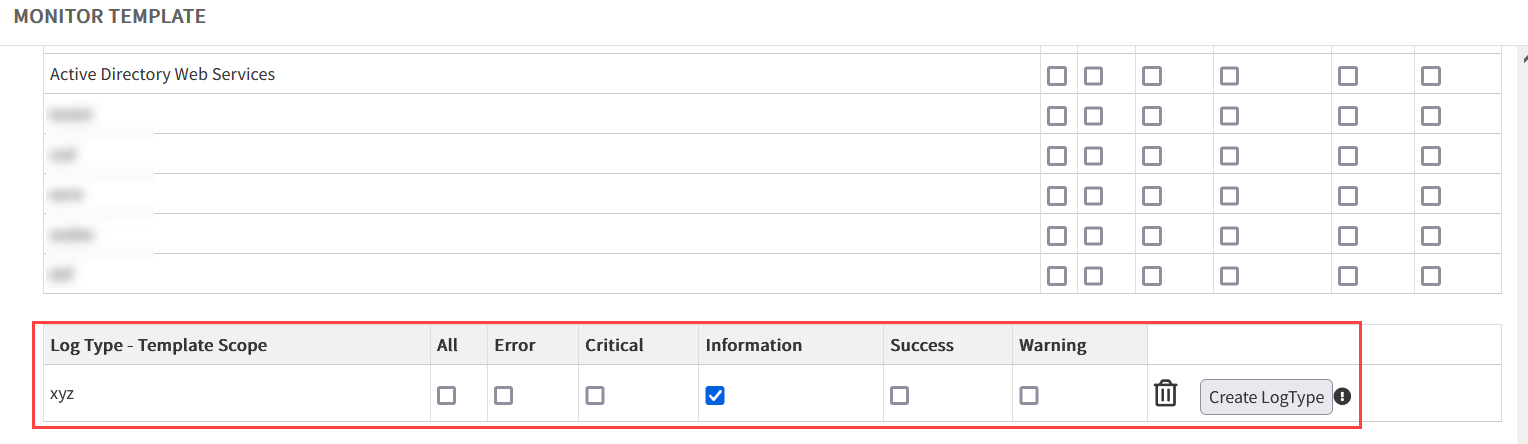
Go to the Log Type – Template scope section to add a custom event log for this template.
Enter the information and click the Create LogType button to create an event log monitor.
Click Save to save the template.
Important Notes
- When you create an event log monitor at the Service Provider scope, it will be available globally.
- If a partner user creates template-scope event log monitors, then any client under the partner can view the customized event log monitors, but they cannot modify the log type.
- If a client user wants to create custom Event log monitors, then he can create in the Log Type – Template Scope section and update or delete as per his requirement.
- Event log monitors only generate critical alerts and no heal alerts are supported.
- Graphical visualization is not supported for event log monitors.