Note
You now need to have the Device View permission in addition to Dashboard View permission to access cost and asset data in the Cloud Cost Trends, Cloud Cost Insights, and Cloud Cost Assets widgets.Introduction
The app offers insightful data on cloud cost usage and visualizations of the trends in cloud cost usage over time, allowing users to easily analyze and understand their cloud spending patterns and make informed decisions to optimize their cloud usage.
Configuration Parameters
- Client Selection: You can select a single client or All Clients from the dropdown list. Only selected client data will get into the report.
- Filter Criteria: Select specific Provider Types or Cloud Account.
- Select Provider Type: Choose the type of cloud provider (Azure, Google, AWS).
- Select Cloud Account: Cloud accounts of a selected provider type.
- Chart Type: Type of chart selected visualizes it in the report for cloud cost insights only.
- Bar: A bar chart is a visual representation of categorical data using rectangular bars.
- Pie: A pie chart is a circular graph divided into slices to illustrate numerical proportions.
- Include Trends: Enable this option to include cloud cost trends in the report. Once enabled, you can select the following inputs:
- View Type: The type of selected view visualizes in the report for cloud cost trends.
- Duration: The cloud cost trends distributed over the selected duration.
- Supported Analysis Period: Supported analysis periods are: Last 7 Days, Last Month, Last 3 Months, and Specific Period.
- Supported Format: Reports are generated only in XLSX format.
Reports Output
| Section | Description |
|---|---|
| Summary | This section provides the configuration details. |
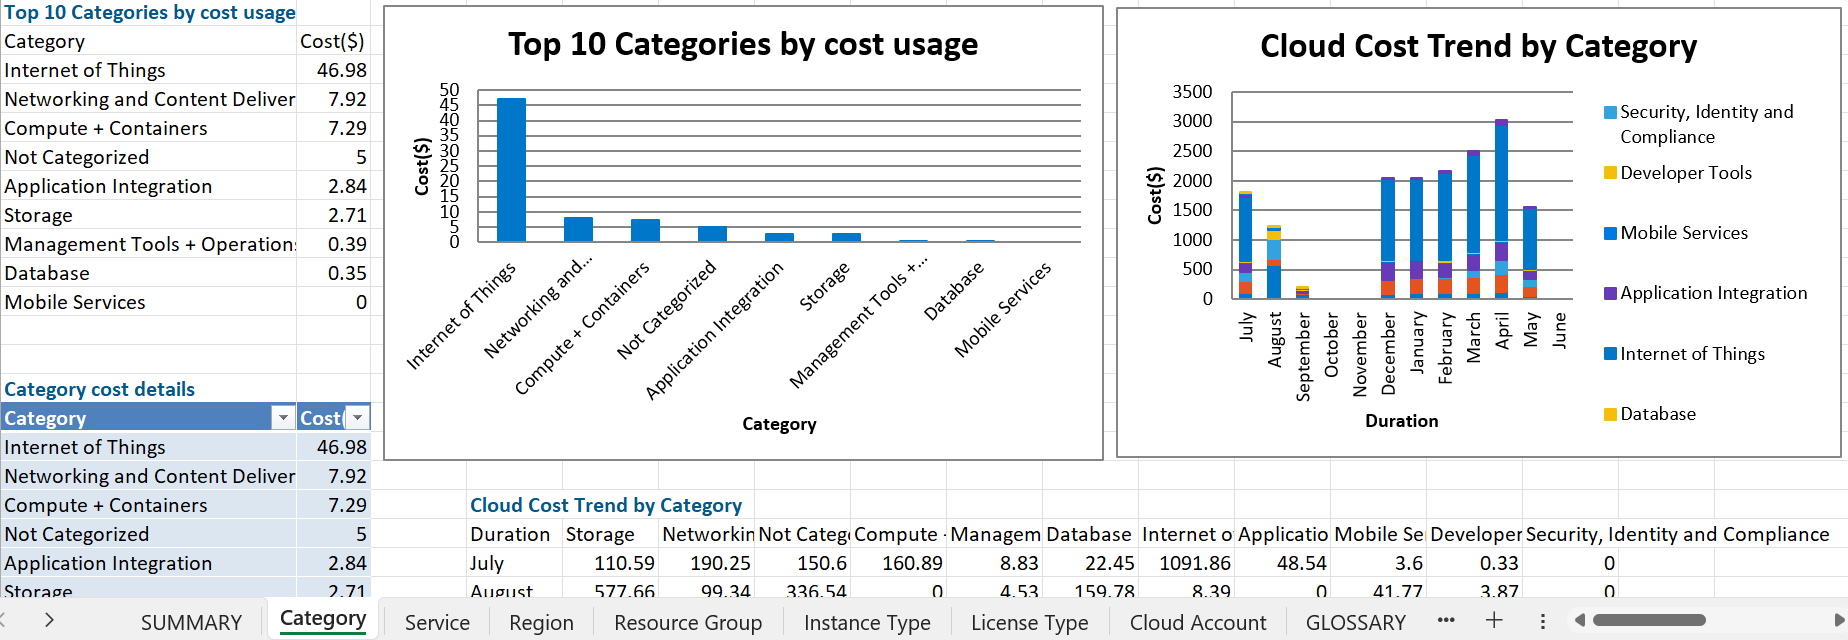
| Category | It presents a breakdown of the top 10 categories by cost usage, including details of all categories' usage. It includes trends of cloud cost by category of selected provider type(s) over the period. |
| Cloud Accounts | It presents a breakdown of the top 10 cloud accounts by cost usage, including details of all cloud accounts usage. It includes trends of cloud cost by cloud accounts of selected provider type(s) over the period. |
| Instance Type | It presents a breakdown of the top 10 instance types based on cost usage, along with comprehensive details of the usage for each instance type. Additionally, it encompasses the trends of cloud cost associated with each instance type of the selected provider type(s) over the period. |
| License Type | It presents a breakdown of the top 10 license types based on cost usage, along with comprehensive details of the usage for each license type. Additionally, it encompasses the trends of cloud cost associated with each license type of the selected provider type(s) over the period. |
| Region | It presents a breakdown of the top 10 regions by cost usage, along with comprehensive details of the usage for each region. Additionally, it encompasses the trends of cloud cost. |
| Resource Group | It presents a breakdown of the top 10 resource groups by cost usage, along with comprehensive details of the usage for each resource group. Additionally, it encompasses the trends of cloud cost associated with each resource group of the selected provider type(s) over the period. |
| Service | It presents a breakdown of the top 10 services by cost usage, along with comprehensive details of the usage for each service. Additionally, it encompasses the trends of cloud cost associated with each service of the selected provider type(s) over the period. |
Sample of reports in XLSX format: