Introduction
The Metric Insights app provides aggregated metrics data over a period for each resource. Users have the option to select a minimum of one metric and a maximum of five metrics from the available list of metrics.
Configuration Parameters
The Metric Insights app can be configured in two ways:
- Summary – Displays aggregated metric information in a summarized format.
- Roll Up Data – Consolidates detailed metric data across selected resources for higher-level analysis.
Using Summary option
Using Roll Up Data option
- Add Query: Use the query to select the entities that you wish to include in the report.
- Default query: The default query ( state = “active” AND monitorable = “true”) will be populated by default when open metric insight app. Users are able to modify/delete the default query and run his specific query.
- Using an OpsQL query, you can customize the report result. If users did not select
stateandmonitorableattributes in the query string, in that case the user selection query would be appended by default withstateandmonitorableattributes.
For example: If a user only selects theagentInstalledattribute, the query will automatically show asstate = ‘active’ AND monitorable = true
The query will look as follows:(agentInstalled = "true") AND state = 'active' AND monitorable = true
- Metric Selection: The metric will list out all of the metrics associated with the tenant. You can choose any of the five metrics from the list.
Info
The metrics that have been in an active state within the last 7 days will be loaded under this Metric selection dropdown. - Attributes Selection: Specify the attributes of the selected entities that you wish to include as columns in the report.
- Default attributes: The default attributes (Id, Resource Name, Make, Type, Native Type) will be populated by default. User can modify/delete the default attributes and select his required attributes to view in the report.
- Only selected attributes related data will be included in the report. If no attributes are selected, the default attributes data will be included in the report.
- You can customize the default attributes selection order by using the drag and drop functionality. You are allowed to select a maximum of 25 attributes.
- Select Data Format: Select a type of data format from the option below. The Consolidated List option would be the default.
- Consolidated List: Provides all selected metrics data as a consolidated list in the XLSX or PDF format report.
- MetricWise: Provides each selected metric data in a separate sheet in the XLSX or PDF format report.
- Consolidated List and MetricWise: Supports both of the above options in an XLSX or PDF format report.
- Supported Analysis Period: Supported analysis periods are: Last 24 hours, -7 days, Last month, Last 3 months, and specific period.
- Supported Formats: Reports are generated in XLSX or PDF format.
Note
The PDF format will only provide insights data.
- Metric Selection: The metric will list out all of the metrics associated with the tenant. You can choose a maximum of two metrics from the list.
Info
The metrics that have been in an active state within the last 7 days will be loaded under this Metric selection dropdown. - Resource Selection: The metric will list out all of the resources associated with the tenant. You can choose a maximum of two metrics from the list.
- Aggregations: Select the aggregations to generate in the report. The options are Min, Max, Average, or Select All.
- Supported Analysis Period: Supported analysis periods are: Last 24 hours, Last 7 days, Last month, Last 3 months, and specific period.
- Supported Formats: Reports are generated in XLSX or PDF format.
Info
The rollup data is designed only at the resource level, not at the instance level.Reports Output
- Summary: This section provides the configuration details.
- Consolidated List: List of all resources along with their corresponding resource IDs for the selected client.
- Glossary: This section contains detailed information about each section present in the report tab, helping you to understand the generated data better.
- Insights Report: This section provides a detailed distribution analysis and visualization of the selected metric and provides aggregated values for the minimum, maximum, mean, and standard deviation across all resources.
Sample of reports in XLSX format: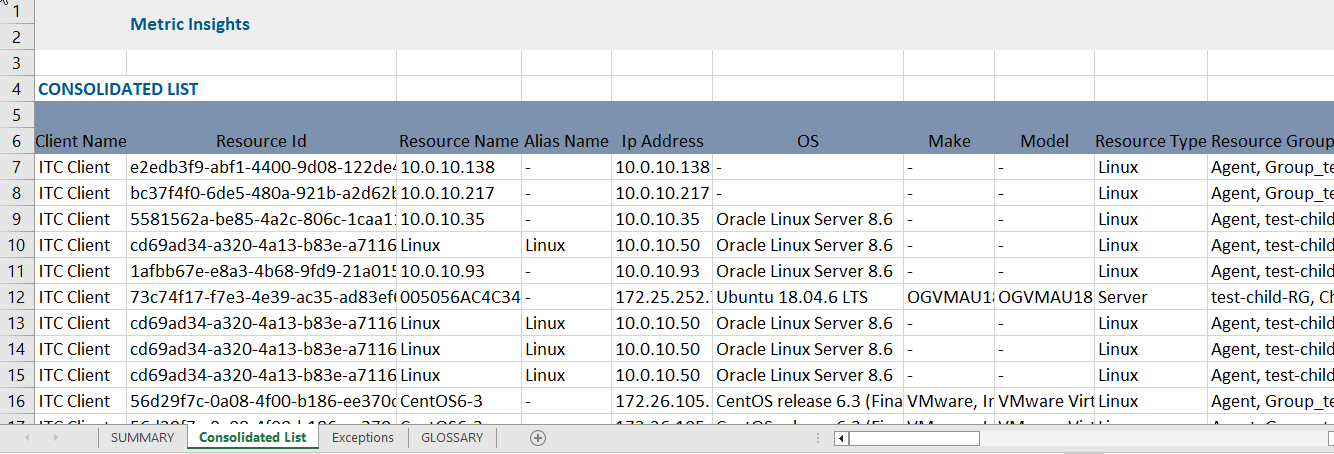
Sample of reports in PDF format:
The PDF report provides a visual representation of the selected metrics in a bar graph. The graph displays the minimum, maximum, and average values of the metric data.
The PDF format provides a higher-level overview of the insights report for all of the selected metrics, but does not provide detailed information.

New Metric Report Vs Metric Insights Atrributes
Click here to view the supported attributes
| New Metric Report | Metric Insights | |
|---|---|---|
| UI Atrributes Selection | Display Format In Report | |
| Resource Name | Resource Name | Resource Name |
| IP Address | IP Address | IP Address |
| Resource Id | Resource Id | Resource Id |
| Device Type / Resource Type | Resource Type | Resource Type |
| Location | Site | Site |
| Minimum | N/A | Min |
| Average | N/A | Avg |
| Maximum | N/A | Max |
| Instance Id | N/A | N/A |
| Component | N/A | N/A |
| N/A | Client Name | Client Name |
| N/A | Alias Name | Alias Name |
| N/A | Resource Group(s) | Resource Group(s) |
| N/A | Operating System | Operating System |
| N/A | Make | Make |
| N/A | Model | Model |
| N/A | Total Number of CPU Cores | Total Number of CPU Cores |
| N/A | Total Physical Memory | Total Physical Memory |