Introduction
The Network Utilization app provides insights into the network utilization of your resources over a specific time period. It generates aggregated metrics data for different network metrics over a period of time.
Configuration Parameters
- Add Query: Use the query to select the entities that you wish to include in the report.
- Default query: The default query
resourceTypePath CONTAINS "network device" AND state = "active" AND monitorable = "true"will be populated by default when open network utilization app. User can able to modify or delete the default query and run a specific query. - Using an OpsQL query, you can customize the report result. If users did not select
stateandmonitorableattributes in the query string, in that case the user selection query would be appended by default withstateandmonitorableattributes.
For example: if a user only selects the agentInstalled attribute, the query will automatically appendstate = ‘active’ AND monitorable = true
The query will look like as below:(agentInstalled = "true") AND state = 'active' AND monitorable = trueNote
There is support to filter out the WAN link interfaces in Opsql Query and also added a column in report to differentiate the WAN link interface.
Example Query:
resourceTypePath CONTAINS “network device” AND state = “active” AND monitorable = “true” AND networkCardDetails.linkMode = “MGNT_MODE_WLAN_LINK”
- Default query: The default query
- Client Selection: You can select a single client from the dropdown list. Only selected client data will get into the report.
- Select Metric Category: You can select one or more metric categories from the drop down list: Availability, Interface Utilization, Wan Utilization, Interface Traffic (kbps), Interface Traffic (mbps), Interface Error, and Interface Discard.
- Supported Analysis Period: The supported analysis periods are: Last 24 hours, 7 days, Last month, Last 3 months, and specific period.
- Supported Formats: Reports are generated only in XLSX format.
Reports Output
- Summary: This section provides the configuration details.
- Metric Category Section: This section contains aggregated data for metrics within the selected category.
- Glossary: This section contains detailed information about each section present in the report tab, helping you to understand the generated data better.
Sample of reports in XLSX format: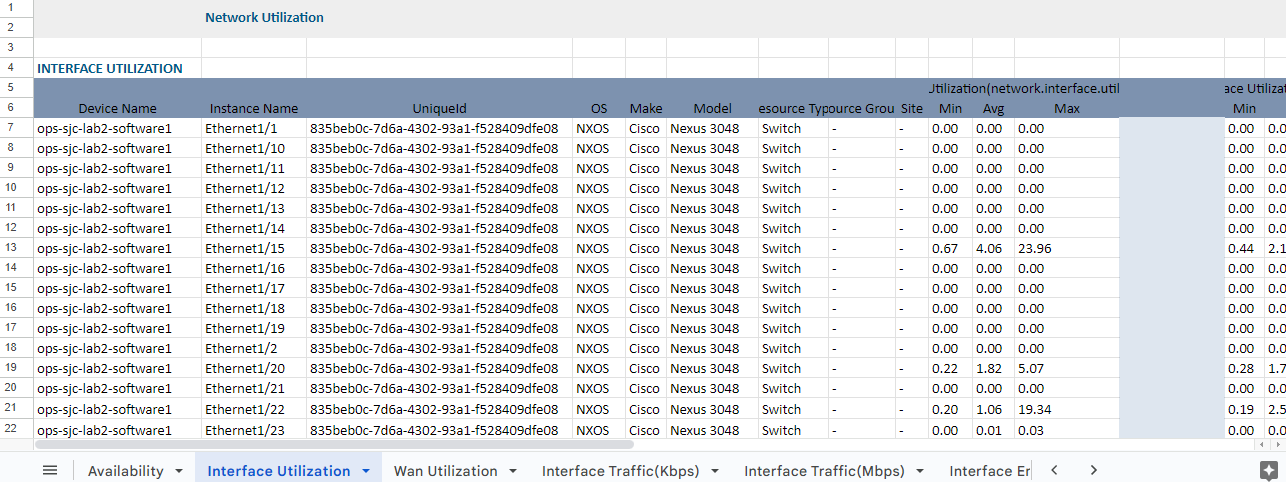
Network Statistics Report Vs Network Utilization
Click here to view the supported attributes
| Network Statistics Report | Network Utilization | |
|---|---|---|
| Interface Availability | Availability | |
| Interface Name | Instance Name | |
| Device Name | Device Name | |
| IP Address | Ip Address | |
| Alias Name | Interface Alias Name | |
| Device Availability (%) | N/A | |
| Interface Availability (%) | N/A | |
| N/A | UniqueId | |
| N/A | OS | |
| N/A | Make | |
| N/A | Model | |
| N/A | Resource Type | |
| N/A | Availability(network.interface.status) (Min, Avg, Max) | |
| N/A | Speed (Mbps) | |
| N/A | Partner Id | |
| N/A | Partner Name | |
| N/A | Client Id | |
| N/A | Client Name | |
| N/A | Interface Name | |
| N/A | Interface Alias Name | |
| N/A | IP Address | |
| N/A | Speed | |
| Interface Utilization | Interface Utilization | |
| Interface Name | Instance Name | |
| Device Name | Device Name | |
| Site | Site | |
| Alias Name | Interface Alias Name | |
| IP Address | Ip Address | |
| Group | N/A | |
| Speed (Mbps) | Speed (Mbps) | |
| Configured Speed(Mbps) | N/A | |
| Average (%) (IN, OUT, TOTAL) | N/A | |
| Minimum (%) (IN, OUT, TOTAL) | N/A | |
| Maximum (%) (IN, OUT, TOTAL) | N/A | |
| 95 Percentile (IN, OUT, TOTAL) | N/A | |
| 90 Percentile (IN, OUT, TOTAL) | N/A | |
| N/A | OS | |
| N/A | Make | |
| N/A | Model | |
| N/A | Resource Type | |
| N/A | UniqueId | |
| N/A | Interface Utilization(network.interface.utilization.in) (Min, Avg, Max) | |
| N/A | Interface Utilization(network.interface.utilization.out) (Min, Avg, Max) | |
| N/A | Interface Utilization(network.interface.utilization.total) (Min, Avg, Max) | |
| N/A | Partner Name | |
| N/A | Partner Id | |
| N/A | Client Name | |
| N/A | Client Id | |
| Interface Traffic | Interface Traffic(Kbps) | |
| Interface Name | Instance Name | |
| Device Name | Device Name | |
| Site | Site | |
| Alias Name | Interface Alias Name | |
| IP Address | Ip Address | |
| Group | N/A | |
| Speed (Mbps) | Speed (Mbps) | |
| Configured Speed(Mbps) | N/A | |
| Average (Kbps) (IN, OUT, TOTAL) | N/A | |
| Minimum (Kbps) (IN, OUT, TOTAL) | N/A | |
| Maximum (Kbps) (IN, OUT, TOTAL) | N/A | |
| 95 Percentile (IN, OUT, TOTAL) | N/A | |
| 90 Percentile (IN, OUT, TOTAL) | N/A | |
| Average (Mbps) (IN, OUT, TOTAL) | N/A | |
| Minimum (Mbps) (IN, OUT, TOTAL) | N/A | |
| Maximum (Mbps) (IN, OUT, TOTAL) | N/A | |
| N/A | OS | |
| N/A | Make | |
| N/A | Model | |
| N/A | Resource Type | |
| N/A | UniqueId | |
| N/A | Interface Traffic(Kbps)(network.interface.traffic.in) (Min, Avg, Max) | |
| N/A | Interface Traffic(Kbps)(network.interface.traffic.out) (Min, Avg, Max) | |
| N/A | Interface Traffic(Kbps)(network.interface.traffic.total) (Min, Avg, Max) | |
| N/A | Partner Name | |
| N/A | Partner Id | |
| N/A | Client Name | |
| N/A | Client Id | |
| Interface Traffic Mbps | Interface Traffic(Mbps) | |
| Interface Name | Instance Name | |
| Device Name | Device Name | |
| Site | Site | |
| Alias Name | Interface Alias Name | |
| IP Address | Ip Address | |
| Group | N/A | |
| Speed (Mbps) | Speed (Mbps) | |
| Configured Speed(Mbps) | N/A | |
| Average (Mbps) (IN, OUT, TOTAL) | N/A | |
| Minimum (Mbps) (IN, OUT, TOTAL) | N/A | |
| Maximum (Mbps) (IN, OUT, TOTAL) | N/A | |
| 95 Percentile (IN, OUT, TOTAL) | N/A | |
| 90 Percentile (IN, OUT, TOTAL) | N/A | |
| N/A | OS | |
| N/A | Make | |
| N/A | Model | |
| N/A | Resource Type | |
| N/A | UniqueId | |
| N/A | Interface Traffic(Mbps)(network.interface.traffic.in.mbps) (Min, Avg, Max) | |
| N/A | Interface Traffic(Mbps)(network.interface.traffic.out.mbps) (Min, Avg, Max) | |
| N/A | Interface Traffic(Mbps)(network.interface.traffic.total.mbps) (Min, Avg, Max) | |
| N/A | Partner Name | |
| N/A | Partner Id | |
| N/A | Client Name | |
| N/A | Client Id | |
| Interface Errors | Interface Errors | |
| Interface Name | Instance Name | |
| Device Name | Device Name | |
| IP Address | Ip Address | |
| Error Rate - Average (ppm) (IN, OUT, TOTAL) | N/A | |
| Error Rate - Minimum (ppm) (IN, OUT, TOTAL) | N/A | |
| Error Rate - Maximum (ppm) (IN, OUT, TOTAL) | N/A | |
| 95 Percentile (IN, OUT, TOTAL) | N/A | |
| 90 Percentile (IN, OUT, TOTAL) | N/A | |
| N/A | Site | |
| N/A | OS | |
| N/A | Make | |
| N/A | Model | |
| N/A | Resource Type | |
| N/A | UniqueId | |
| N/A | Interface Errors(network.interface.errors.in) (Min, Avg, Max) | |
| N/A | Interface Errors(network.interface.errors.out) (Min, Avg, Max) | |
| N/A | Interface Alias Name | |
| N/A | Speed (Mbps) | |
| N/A | Partner Name | |
| N/A | Partner Id | |
| N/A | Client Name | |
| N/A | Client Id | |
| Interface Discards | Interface Discards | |
| Interface Name | Instance Name | |
| Device Name | Device Name | |
| IP Address | Ip Address | |
| Discard Rate - Average (ppm) (IN, OUT, TOTAL) | N/A | |
| Discard Rate - Minimum (ppm) (IN, OUT, TOTAL) | N/A | |
| Discard Rate - Maximum (ppm) (IN, OUT, TOTAL) | N/A | |
| 95 Percentile (IN, OUT, TOTAL) | N/A | |
| 90 Percentile (IN, OUT, TOTAL) | N/A | |
| N/A | Site | |
| N/A | OS | |
| N/A | Make | |
| N/A | Model | |
| N/A | Resource Type | |
| N/A | UniqueId | |
| N/A | Interface Discards(network.interface.discards.in) (Min, Avg, Max) | |
| N/A | Interface Discards(network.interface.discards.out) (Min, Avg, Max) | |
| N/A | Interface Alias Name | |
| N/A | Speed (Mbps) | |
| N/A | Partner Name | |
| N/A | Partner Id | |
| N/A | Client Name | |
| N/A | Client Id | |
| Wan Utilization | Wan Utilization | |
| N/A | Instance Name | |
| N/A | Device Name | |
| N/A | Site | |
| N/A | OS | |
| N/A | Make | |
| N/A | Model | |
| N/A | Resource Type | |
| N/A | UniqueId | |
| N/A | Wan Utilization(wan.utilization.in) (Min, Avg, Max) | |
| N/A | Wan Utilization(wan.utilization.out) (Min, Avg, Max) | |
| N/A | Wan Utilization(wan.utilization.total) (Min, Avg, Max) | |
| N/A | Ip Address | |
| N/A | Interface Alias Name | |
| N/A | Speed (Mbps) | |
| N/A | Partner Name | |
| N/A | Partner Id | |
| N/A | Client Name | |
| N/A | Client Id | |
Next Steps
Refer to the Installation documentation on how to install and configure the apps.