Introduction
The Activity Logs provide a detailed, chronological record of system-initiated jobs, resource actions, and other automated activities within your environment. These logs are used to track, audit, and troubleshoot operational activities involving resource management, system integrations, and automated workflows.
Each system activity follows a specific sequence of events:
- Initiated Time – The point when the activity is scheduled or triggered by the system.
- Start Time – The moment the system begins executing the activity.
- Completed Time – When the activity finishes, either successfully or with errors.
These logs offer complete insight into each step of activity execution, facilitating effective auditing, monitoring, and issue resolution.
Best Practices
Follow these best practices to efficiently monitor, audit, and troubleshoot log activities in OpsRamp:
- Regularly review the Activity Log to detect and resolve failed jobs or configuration issues.
- Use the Initiated Time → Start Time → Completed Time sequence to analyze delays or failures in job execution.
- Focus on error messages for quick troubleshooting guidance.
- Retain logs in accordance with your organization’s compliance policies for auditing purposes.
Permissions
Following are the permissions required to perform various tasks.
| Category | Permission Type | Permission Value | Task |
|---|---|---|---|
| Account Administration | Devices | View | To view Activity listing screen. |
Access Activity Logs
Follow these steps to view and analyze Activity Logs:
- To select your client, navigate to All Clients, and click the Client/Partner dropdown menu.
Note: You may either type your client’s name in the search bar or select your client from the list. - Navigate to Infrastructure → Activity. The Activity listing screen is displayed.
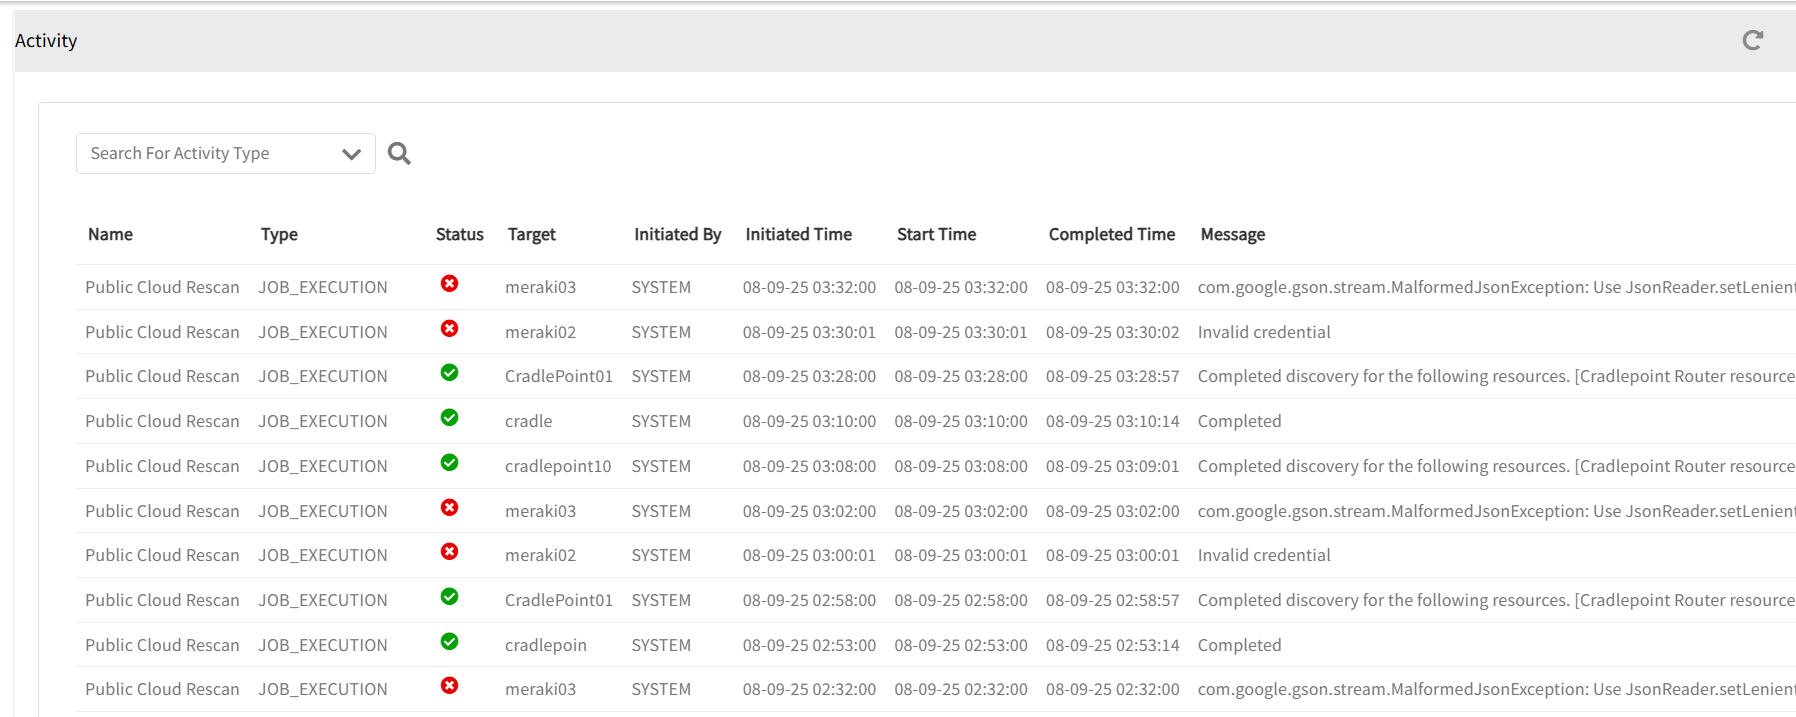
The following table provides a description of each column:
| Column | Description |
|---|---|
| Name | The name of the activity being executed (e.g., Public Cloud Rescan). |
| Type | Type of system action (e.g., JOB_EXECUTION, RESOURCE_CREATE). |
| Status | Success or Failure of the activity. |
| Target | The specific resource the job acts upon (e.g., device name or resource identifier). |
| Initiated By | The entity triggering the activity (usually SYSTEM). |
| Initiated Time | The timestamp when the activity was scheduled or triggered. |
| Start Time | The timestamp when the system started executing the activity. |
| Completed Time | The timestamp when the activity completed execution. |
| Message | A detailed description of the activity’s result, including any errors encountered. |
Search and Filter
You can filter activities by several criteria using the search option:
Follow these steps to filter and search for activities:
- To select your client, navigate to All Clients, and click the Client/Partner dropdown menu.
Note: You may either type your client’s name in the search bar or select your client from the list. - Navigate to Infrastructure → Activity. The Activity listing screen is displayed.
- Click the arrow next to Search for Activity Type dropdown.
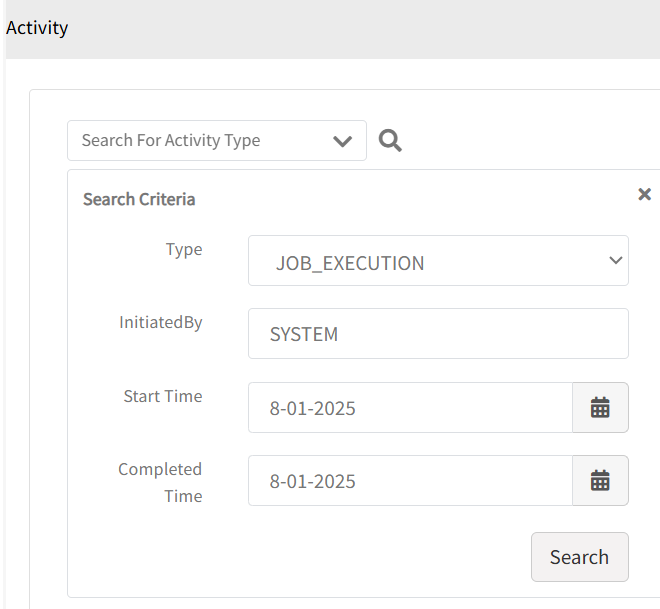
- Select one or more criteria to narrow down results.
- Type: Click the Type dropdown to select the kind of activity.
Choose from predefined activity types such as
NETWORK_CONFIG_BACKUP, DEVICE_RESCAN, RESOURCE_CREATE. - InitiatedBy: Provide the initiator name. Example: SYSTEM.
- Start Time: Select a start time.
- Completed Time: Select a completed time.
- Type: Click the Type dropdown to select the kind of activity.
Choose from predefined activity types such as
- Click Search.
- Click the refresh icon available at the right-top corner of the screen to refresh the screen.