The topology explorer provides visualization of resources in your infrastructure, their relationships, and availability, to help troubleshoot network-related issues.
Prerequisite
A user should have Device Manage and Device View permissions.
HostName/IP Address-based Topology
View the topology of a specific resource by providing the hostname or IP address.
- Click All Clients and select a client.
- Go to Infrastructure > Topology.
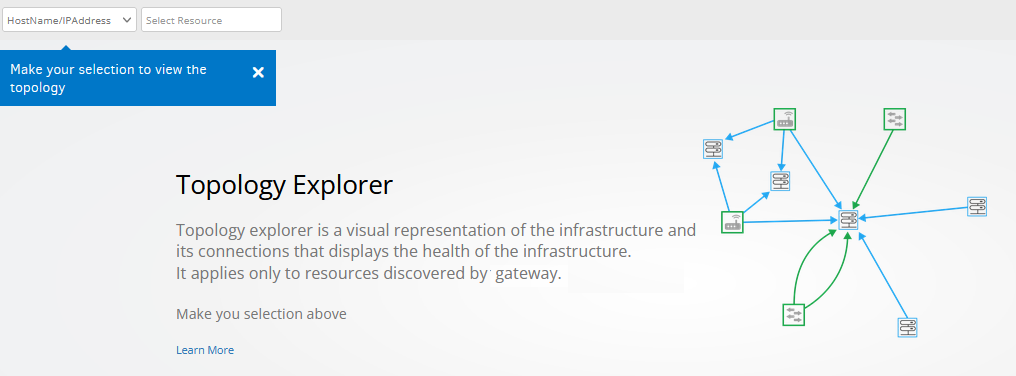
- In the drop-down list, select HostName/IP Address, which is the default selection.
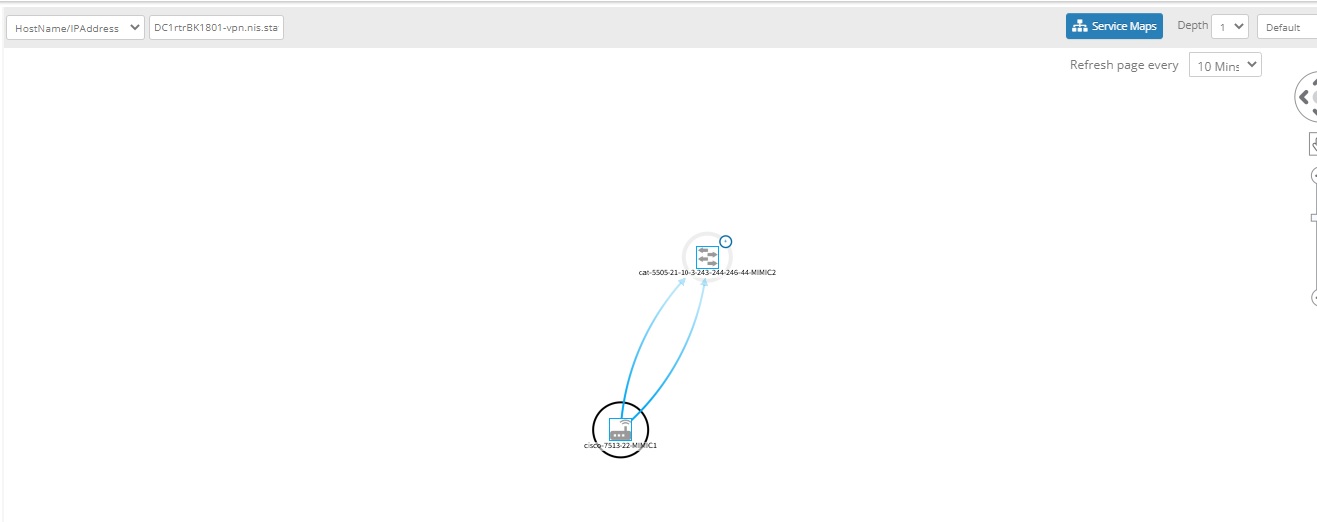
Note: Select the required network device from the list to see the topology view. - Select the resource, and check the topology layout. The topology explorer is displayed with the base resource you selected and its neighbors including the connections based on Depth level.Note: following are the different Depth Levels (Supported Depth levels - 1,2,3,4,5)Example
Depth level 1 : (Source Device)
Depth Level 3 :
Source
Availability of source is based on the infrastructure. Source has five availability state, which are as follows:
- Up
- Down
- Undefined
- Unknown
- Default
Link
Link has their own source interface and target interface. Availability status for links will be shown based on source interface. Link had three availability state, which are as follows:
| Availability Link | Label | Colour |
|---|---|---|
| Up | Okay Alert | Green |
| Down | Critical Alert | Red |
| Degrade | Warning Alert | Yellow |
Notes:
- All links generated from the source node (target links) are represented with dotted lines, when the source is down.
- The default colour for links is Blue.
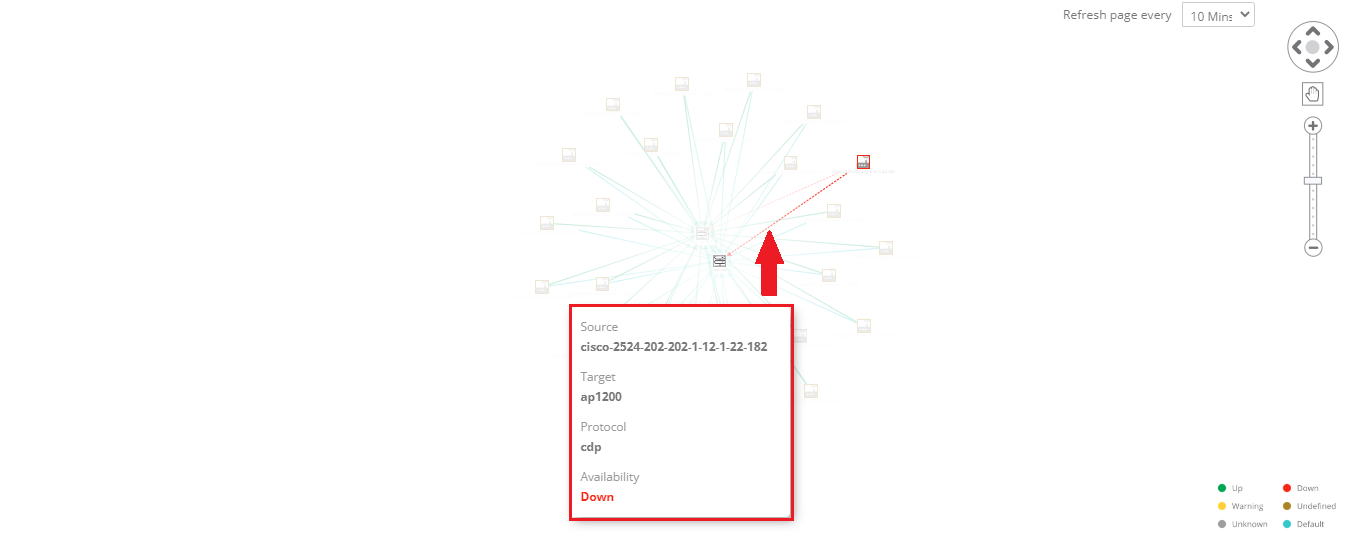
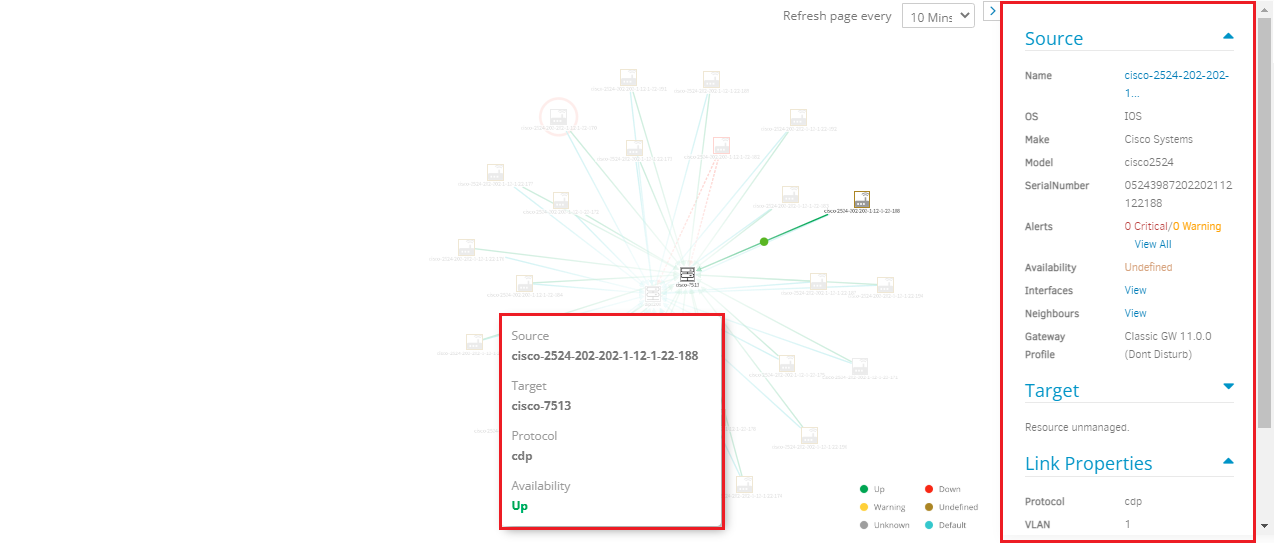
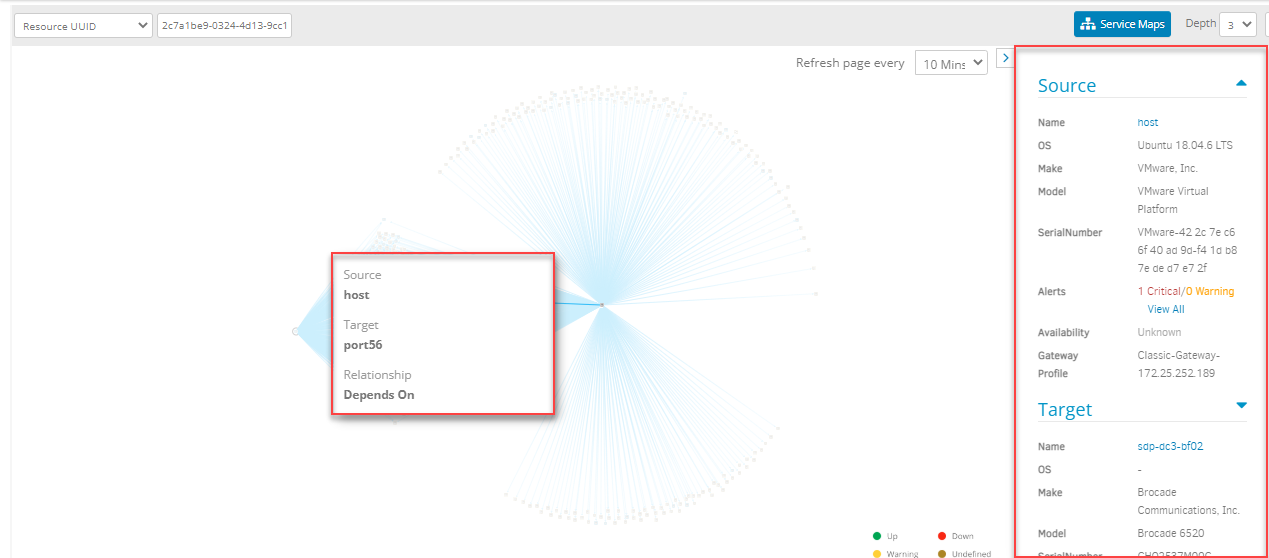
- Click anywhere on a link (on a line) to view the Source and Target interface details.
Following is the information with description:
| Object Name | Details | Description |
|---|---|---|
| Source | Name | Name of the source |
| OS | OS name of the device. | |
| Make | Make details of the device. | |
| Model | Model name of the device. | |
| SerialNumber | Serial name of the device. | |
| Alerts | Alert information. Note: You can click View All, to check all the alert details. | |
| Availability | Check the availability status. | |
| Interfaces | Check the details of the interface. | |
| Neighbors | Check the details related to CDP or LLDP MIB information. | |
| Gateway Profile | Details related to the Gateway Profile. | |
| Target | Resource unmanaged | Information related to the target. |
| Link Properties | Protocol | Name of the device protocol. |
| VLAN | Number of VLAN is displayed. | |
| Speed | Speed of the link is displayed. | |
| Source Interface | Information related to the source interface is displayed. | |
| Target Interface | Information regarding the Target interface. |
- Click a resource to view more information about the resource, including resource availability status. Click the external link icon beside the resource name to view the resource details page.
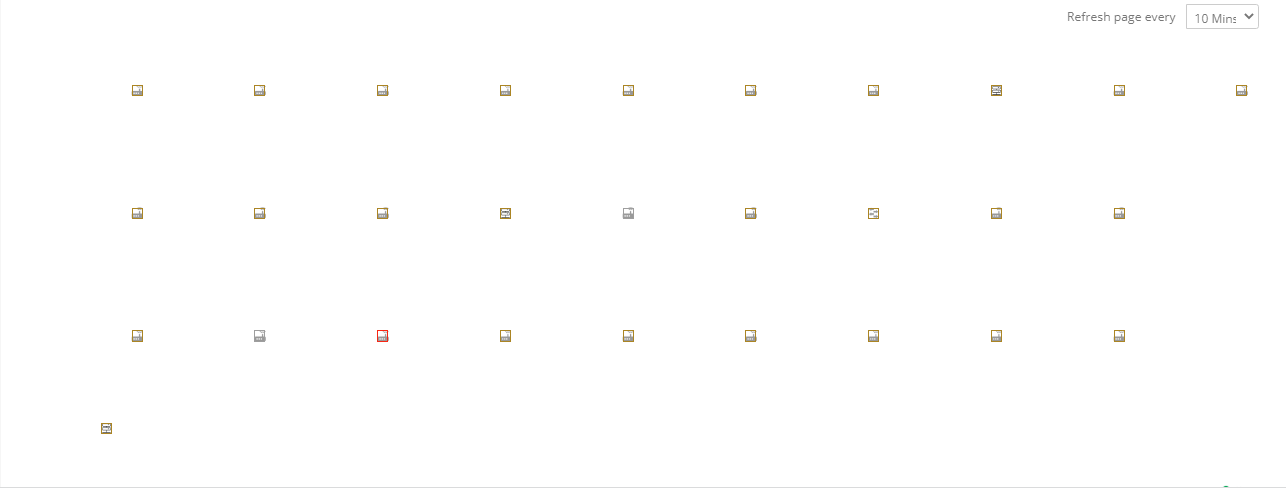
Refresh Page
The page is refreshed based on the selected frequency:
- 5 Mins
- 10 Mins
- 15 Mins
- 30 Mins
- 60 Mins
Note: By default 10 min is selected.
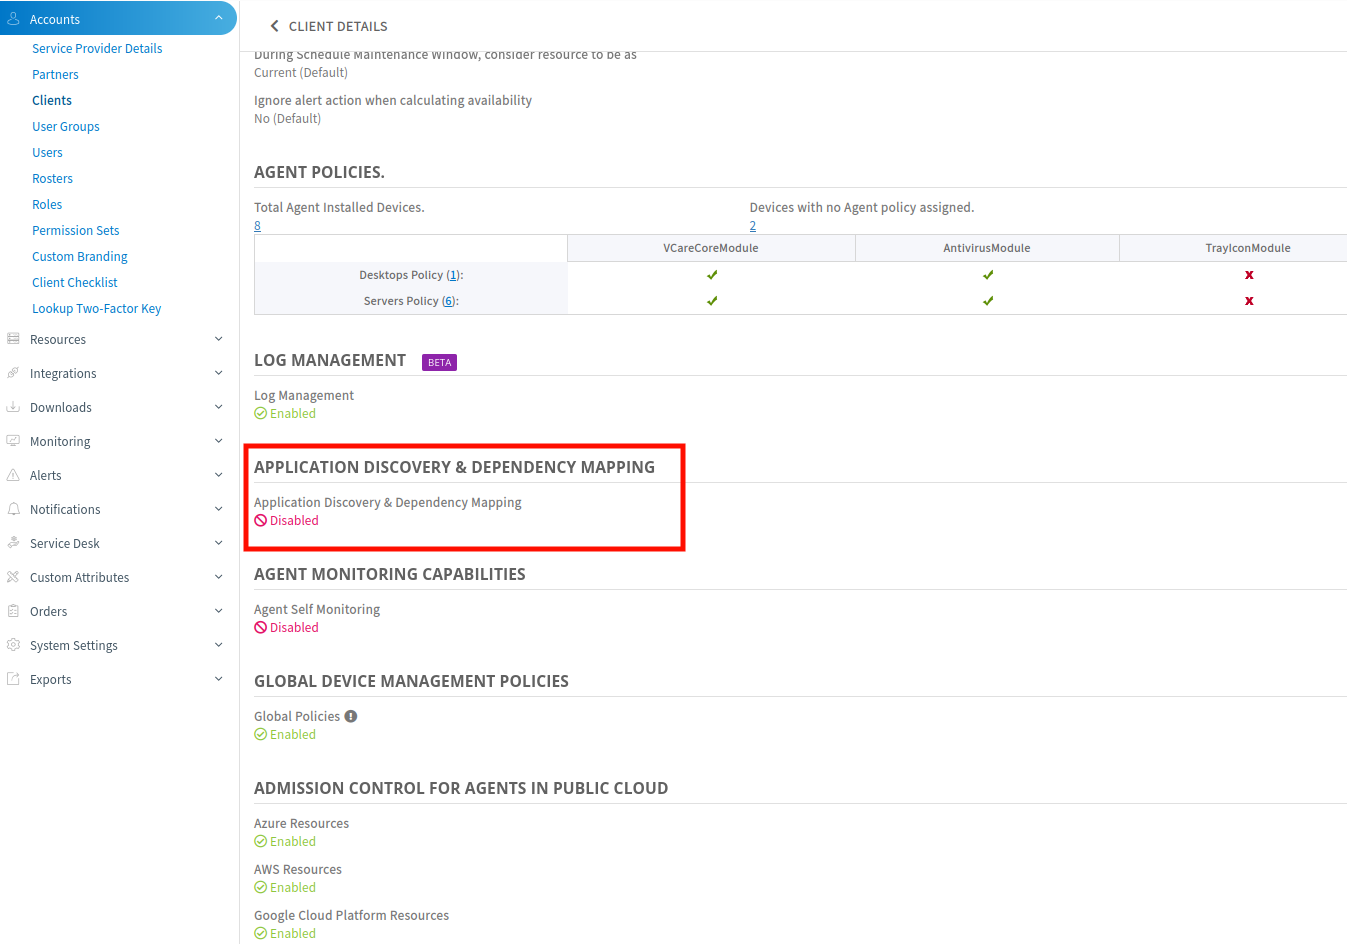
Application Topology
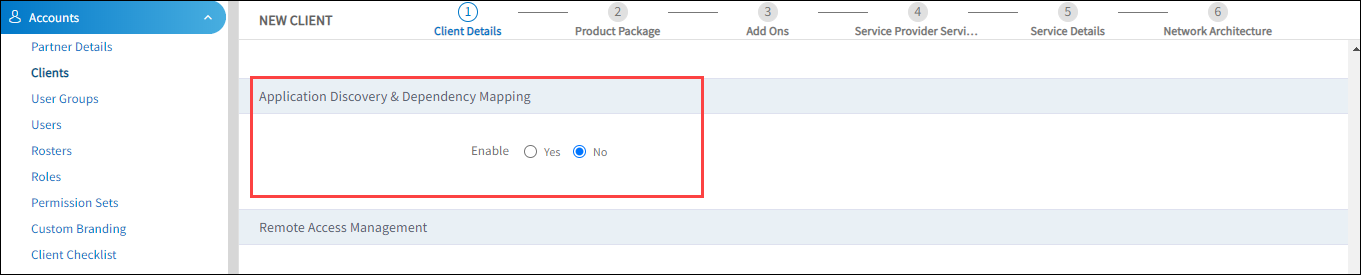
View the topology for applications running in your environment. This requires the agent to be installed on the resource running the application. Also, make sure Application Discovery & Dependency Mapping is enabled for the client:
- Click All Clients and select a client.
- Go to Infrastructure > Topology.
- In the drop-down list, select Applications.
- Select the Depth and topology layout. the application topology is displayed, including inbound and outbound connections, number of alerts, incidents, and patches missing on an application.
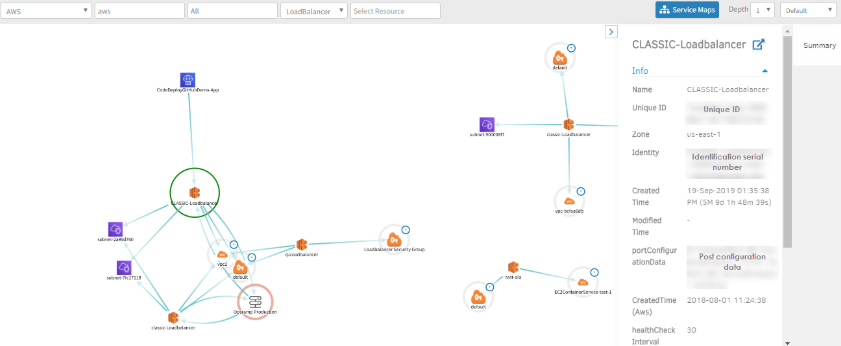
AWS Topology
After integrating AWS cloud services, use topology explorer to view the resource service dependencies.
- Click All Clients and select a client.
- Go to Infrastructure > Topology.
- In the drop-down list, select AWS.
- In the Select Account and Select Location drop-down lists, select the AWS account and location.
- In the services drop-down list, select the service, which displays the AWS topology map of the selected account. If you want to view the topology of an AWS instance, select the instance from the Resource drop-down menu.
- Click a resource to view more information about the resource, including resource availability status. Click the external link icon beside the resource name to view the resource details page.
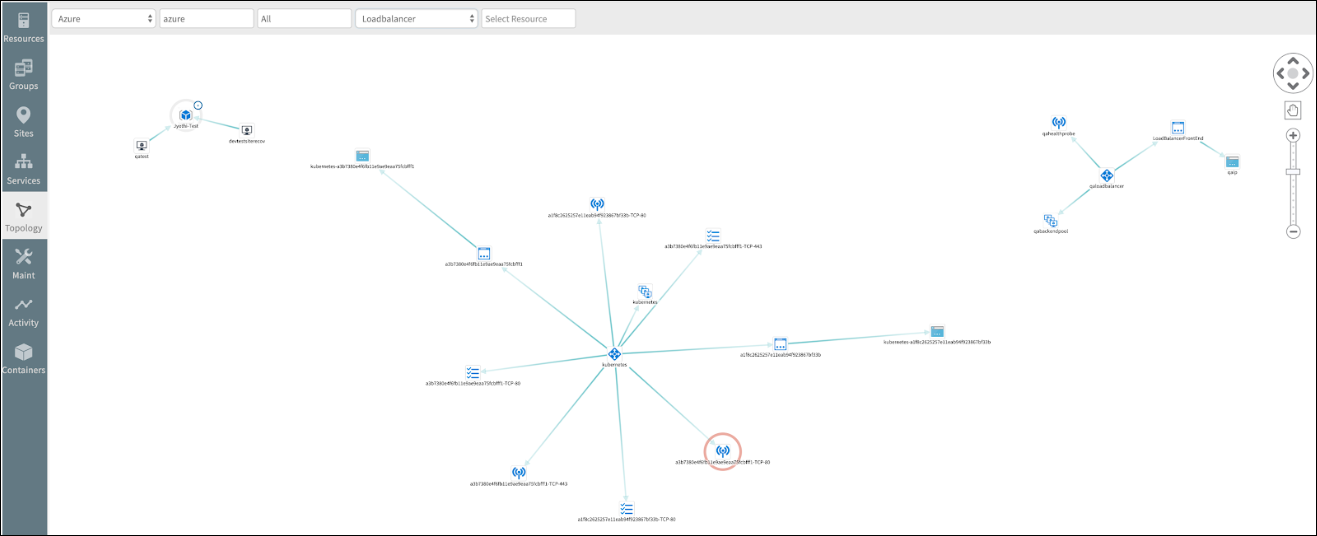
Azure Topology
After integrating Azure cloud services, use topology explorer to view the resource service dependencies.
- Click All Clients and select a client.
- Go to Infrastructure > Topology.
- In the drop-down list, select Azure.
- In the Select Account and Select Location drop-down lists, select the Azure account and location.
- In the services drop-down list, select the service, which displays the Azure topology map for the selected account. If you want to view the topology of an Azure instance, select the instance from the Resource drop-down menu.
- Click a resource to view more information about the resource, including resource availability status. Click the external link icon beside the resource name to view the resource details page.
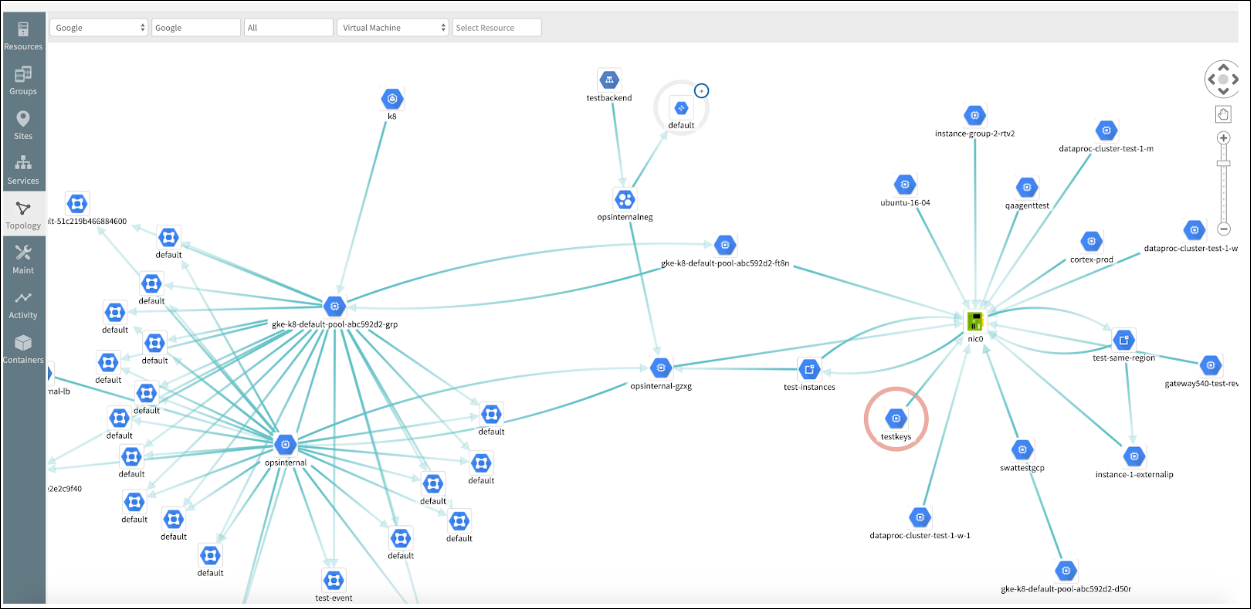
Google Topology
After integrating Google cloud services, use topology explorer to view the resource service dependencies.
- Click All Clients and select a client.
- Go to Infrastructure > Topology.
- In the drop-down list, select Google.
- In the Select Account and Select Location drop-down lists, select the Google account and location.
- In the services drop-down list, select the service, which displays the Google topology map for the selected account. If you want to view the topology of a Google instance, select the instance from the Resource drop-down menu.
- Click a resource to view more information about the resource, including resource availability status. Click the external link icon beside the resource name to view the resource details page.
Hypervisor Topology
The hypervisor environment consists of KVMs, vCenter, and ESXi hosts. After onboarding these resources, you can view the topology map containing the resources, including dependent hosts.
- Click All Clients and select a client.
- Go to Infrastructure > Topology.
- In the drop-down list, select the entities KVM, vCenter, or ESXi Host.
- In the Select Resource drop-down menu, select the resource to display the topology.
- Click a resource to view more information about the resource, including resource availability status. Click the external link icon beside the resource name to view the resource details page.
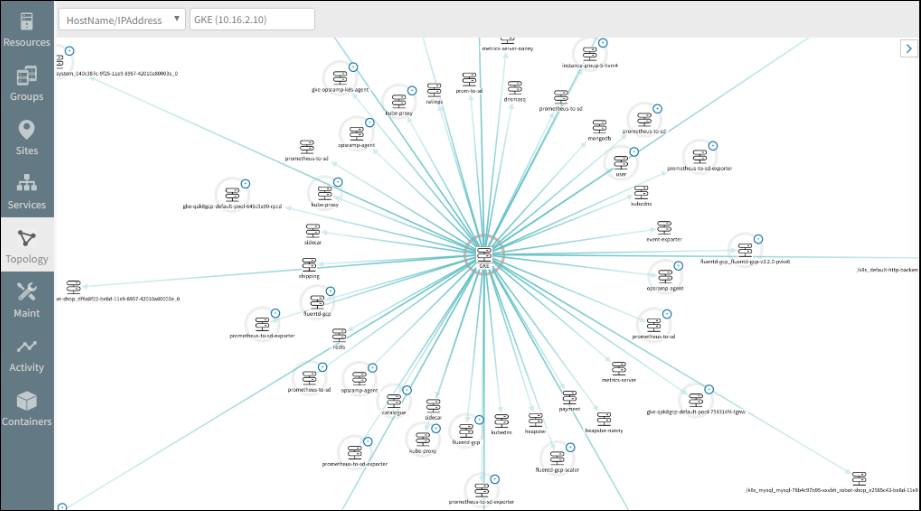
Kubernetes Topology
After onboarding Kubernetes and installing the agent on the Kubernetes resource, use topology explorer to view the Kubernetes topology nodes and containers.
- Click All Clients and select a client.
- Go to Infrastructure > Topology.
- In the drop-down list, select Kubernetes.
- In the Select Resource drop-down menu, select the required resource.
- Select Nodes or Containers from the drop-down menu.
- Select the Depth and topology layout to display the Kubernetes topology.
- Click the resource to view more information. The Summary pane displays the inbound connections, outbound connections, and applications running on the resource.
- Click a resource to view more information about the resource, including resource availability status. Click the external link icon beside the resource name to view the resource details page.
Note
After onboarding Kubernetes, the agent will not send topology mapping information until the flag for Application Discovery & Dependency Mapping is enabled.
Please reach out to our support team for activation of this flag. Once enabled, you will start receiving topology mapping information from the agent.
Resource Group Topology
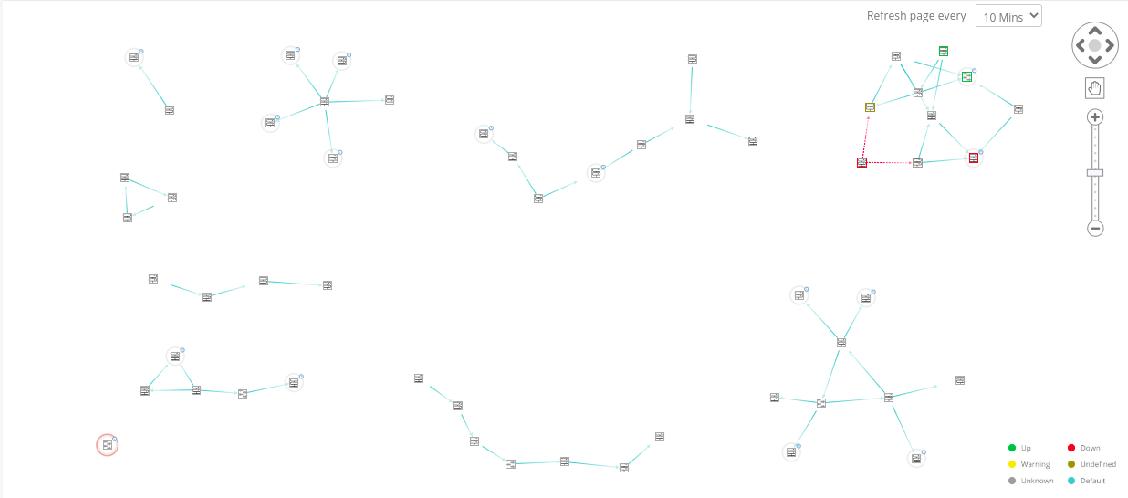
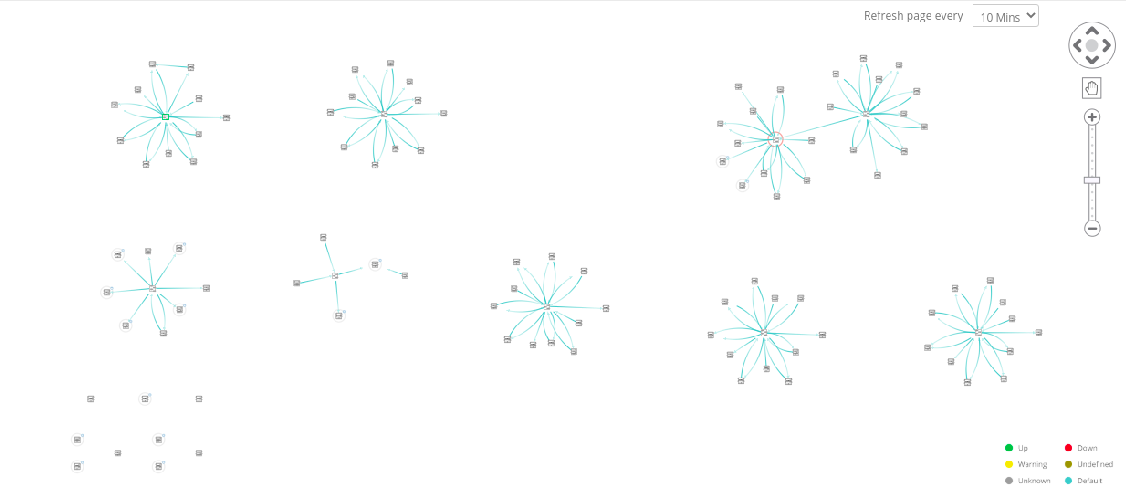
Resource group topology groups all devices in a single location, where you can see the complete network topology map. Every resource has a connection, if there is no connection between those two resources, it will display as an island.
Business Use case: Let us assume that one node contains twenty network devices, which are connected to thirty servers, for those twenty network devices, the availability of the network device and the link node status of the other end connected devices is displayed.
- Click All Clients and select a client.
- Go to Infrastructure > Topology.
- In the drop-down list, select Resource Group.
- In the Select Resource drop-down menu, select the required resource.
- The topology explorer is displayed with the base resource you selected and its neighbors including the connections.
Note: The Depth option is unavailable for the Resource Group Topology. - Click a resource to view more information about the resource, including resource availability status. Click the external link icon beside the resource name to view the resource details page.
Limitations
- Resource group topology supports up to 250 devices.
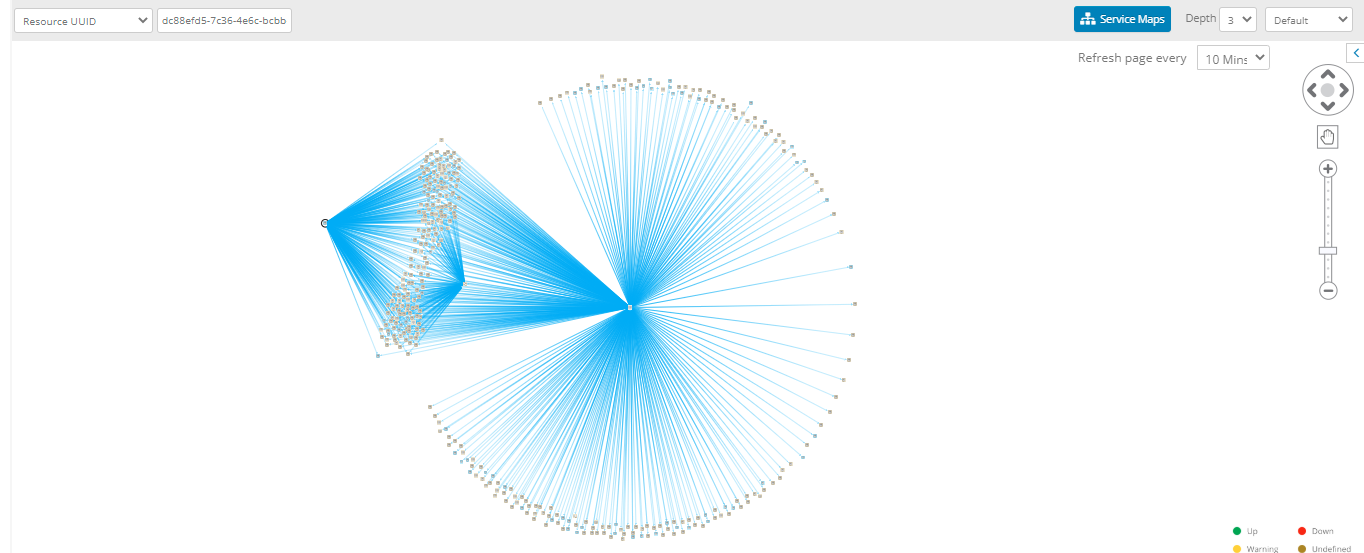
Resource UUID
View the topology of a specific resource by providing the Resource UUID. The filter facilitates the topology map for the SDK adapter with the Resource UUID. You can navigate to the Resource UUID by the following methods
- Click All Clients and select a client.
- Go to Infrastructure > Topology.
- In the drop-down list, select the entities Resource UUID.
- In the Enter Resource UUID, paste the Resource UUID.
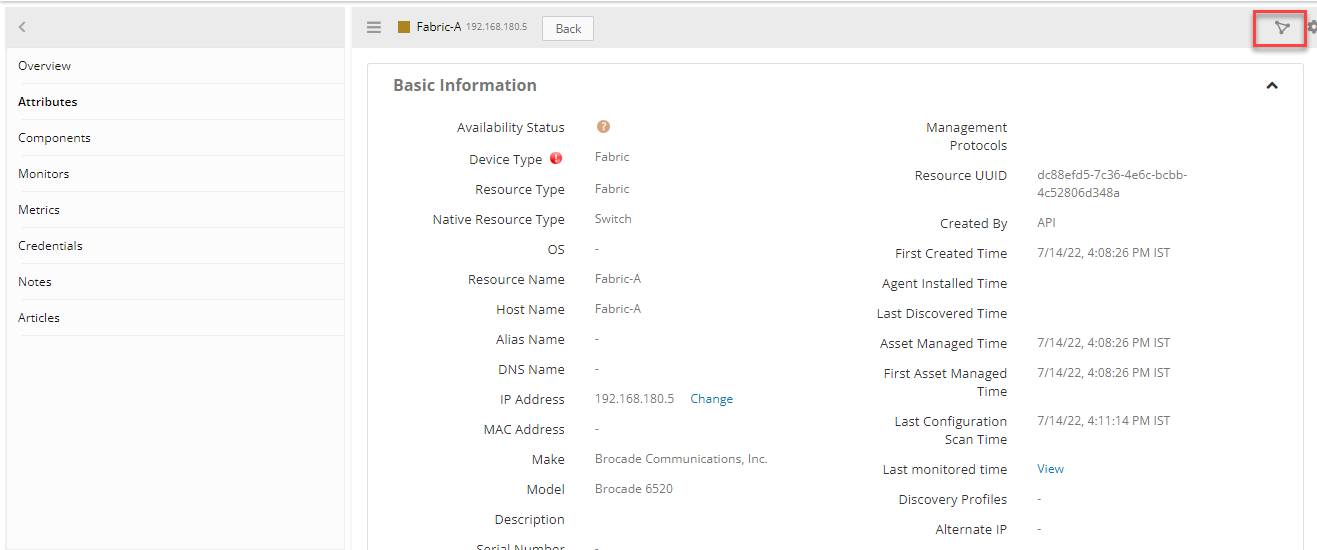
Note: You can acquire the Resource UUID by navigating to Infrastructure > Resource, select a resource and navigate to Attributes.
- Click a resource to view information about the resource.
Following is the information with description:
| Object Name | Details | Description |
|---|---|---|
| Source | Name | Name of the source |
| OS | OS name of the device. | |
| Make | Make details of the device. | |
| Model | Model name of the device. | |
| SerialNumber | Serial name of the device | |
| Alerts | Alert information. Note: You can click View All, to check all the alert details. | |
| Availability | Check the availability status | |
| Interfaces | Check the details of the interface. | |
| Neighbors | Check the details related to CDP or LLDP MIB information. | |
| Gateway Profile | Details related to the Gateway Profile. | |
| Target | Name | Name of the Target |
- Click a resource to view more information about the resource, including resource availability status. Click the external link icon beside the resource name to view the resource details page.
Topology Icon
You can navigate to the topology of a specific resource by clicking the Topology Icon from any resource.
- Click All Clients and select a client.
- Go to Infrastructure > Resource.
- Select a resource and click the Topology Icon.
This will redirect you to the topology map for the SDK adapter with the Resource UUID.
Classic UI
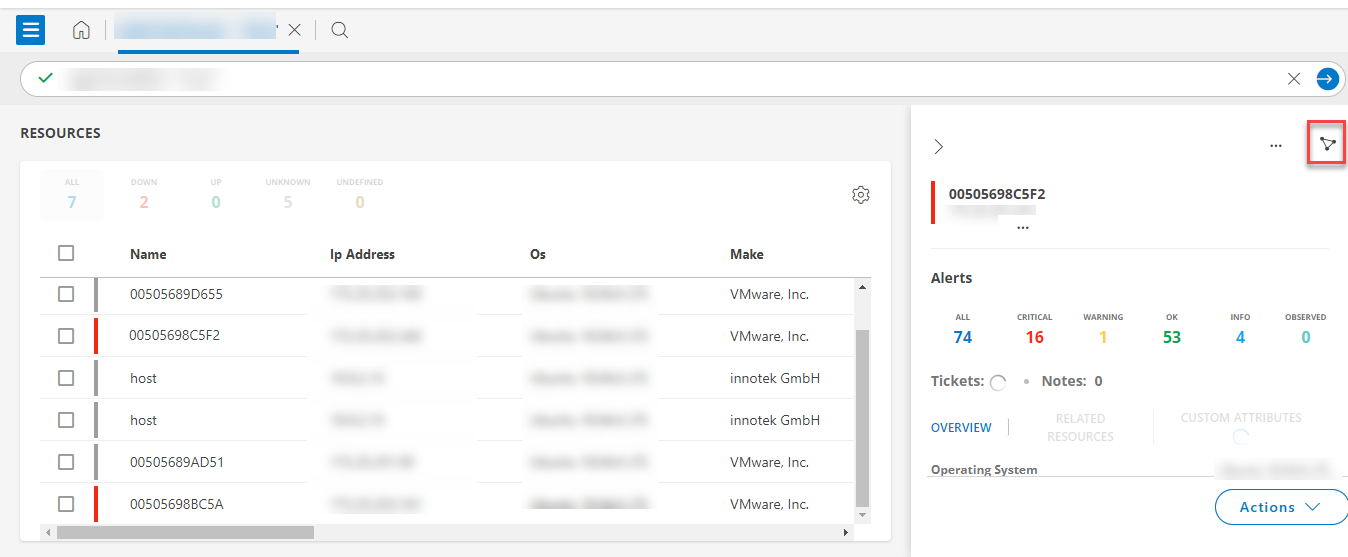
You can navigate to the topology of a specific resource from the Classic UI resource details page or by navigating to the Infrastructure > Search > Resource side panel.
- Click All Clients and select a client.
- Go to Infrastructure > Search.
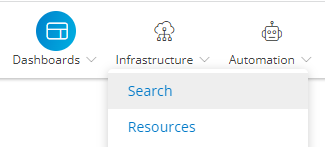
- The advanced search page is displayed.

- Click the search icon to look for a specific resource. The NEW VIEW tab is displayed.
Note: The NEW VIEW tab has an Advanced search box. A Recent Queries list is also displayed, if you searched for resources previously.
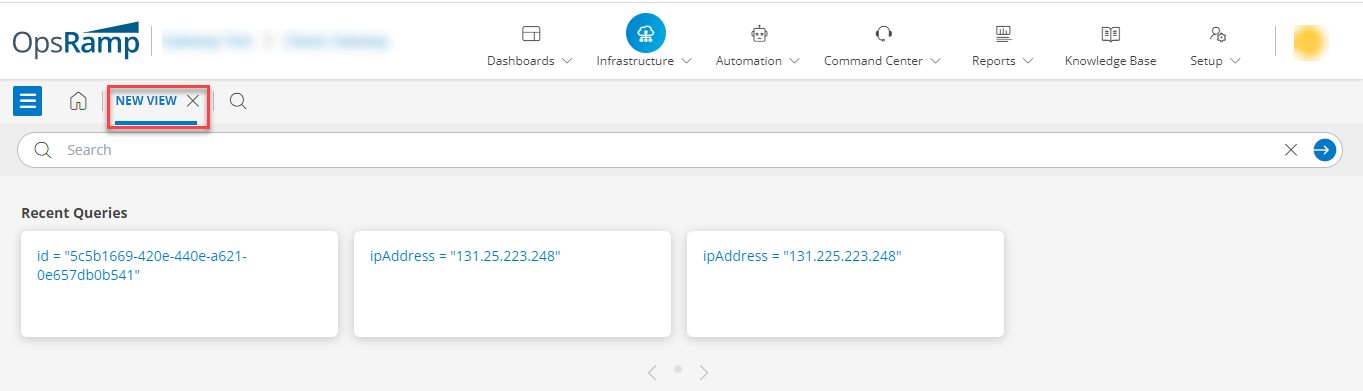
- Enter a query in the search field.
- From the list of resources displayed, select the target resource and click it.
A slide-out screen that contains the Overview tab and the following information is displayed:
| Functionality | Description |
|---|---|
| Operating System | Information of the operating system. |
| IP Address | Information of the IP address. |
| Make | Make of the device. |
| Model | Model number of the device. |
| Serial Number | Serial number of the device. |
| Resource Group | Resource group information related to the device. |
| Traits | Information about the traits installed in the device. |
- Click the Topology icon, This will redirect you to the topology map for the SDK adapter with the Resource UUID.