Overview
Alerts 2.0 is a comprehensive alert management system that enables you to efficiently query, interpret, and act on alerts using OpsQL. This guide explains the key features and workflows available in Alerts 2.0.
Key Features
With Alerts 2.0, you can:
- Search for alerts using OpsQL, and save or share your views.
Note
When you select a specific client for alert queries, only alerts for that client are displayed. - View alert summaries in a slide-out panel for quick reference.
- Take actions on alerts directly from the slide-out panel.
- Perform bulk actions on multiple alerts.
- Set a refresh interval from 1 minute to 24 hours.
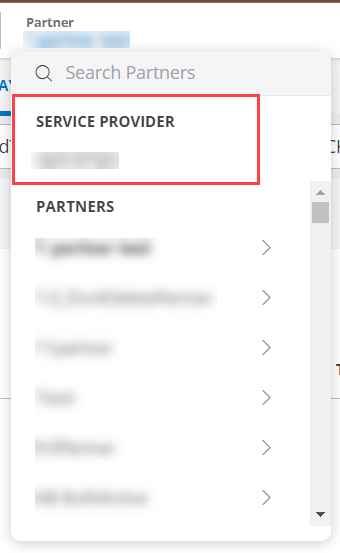
- Service Provider users can search for alerts across all clients within All Partners.
Alerts Column Settings
You can customize the alert listing by selecting alert and resource attributes from the Column Settings popup.
To add or remove columns:
- Click the Settings icon in the upper-right corner of the alerts listing screen to view available attributes.
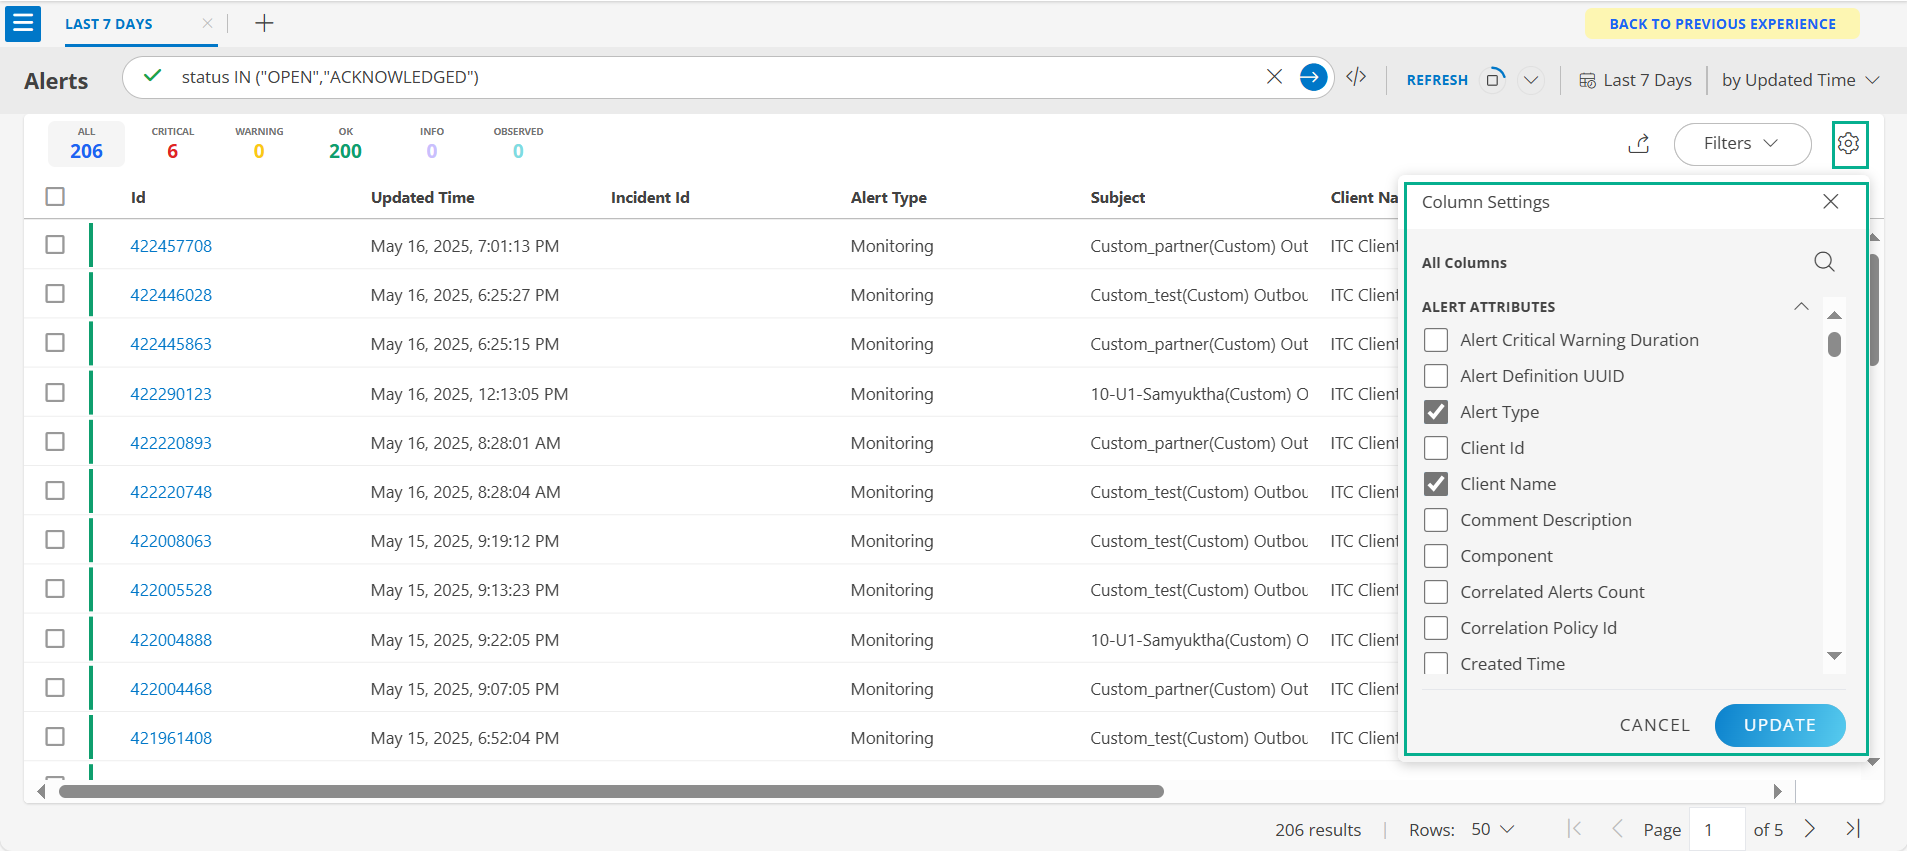
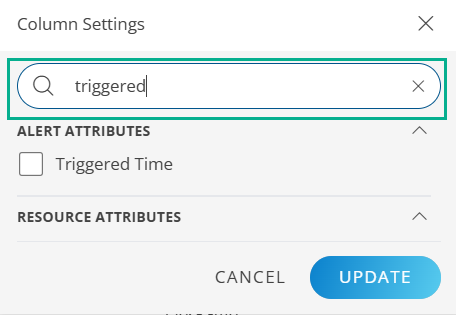
- Search for the desired attribute.
- Click Update. The listing updates accordingly.
- The selected attribute appears as a column. Scroll right to view additional columns.
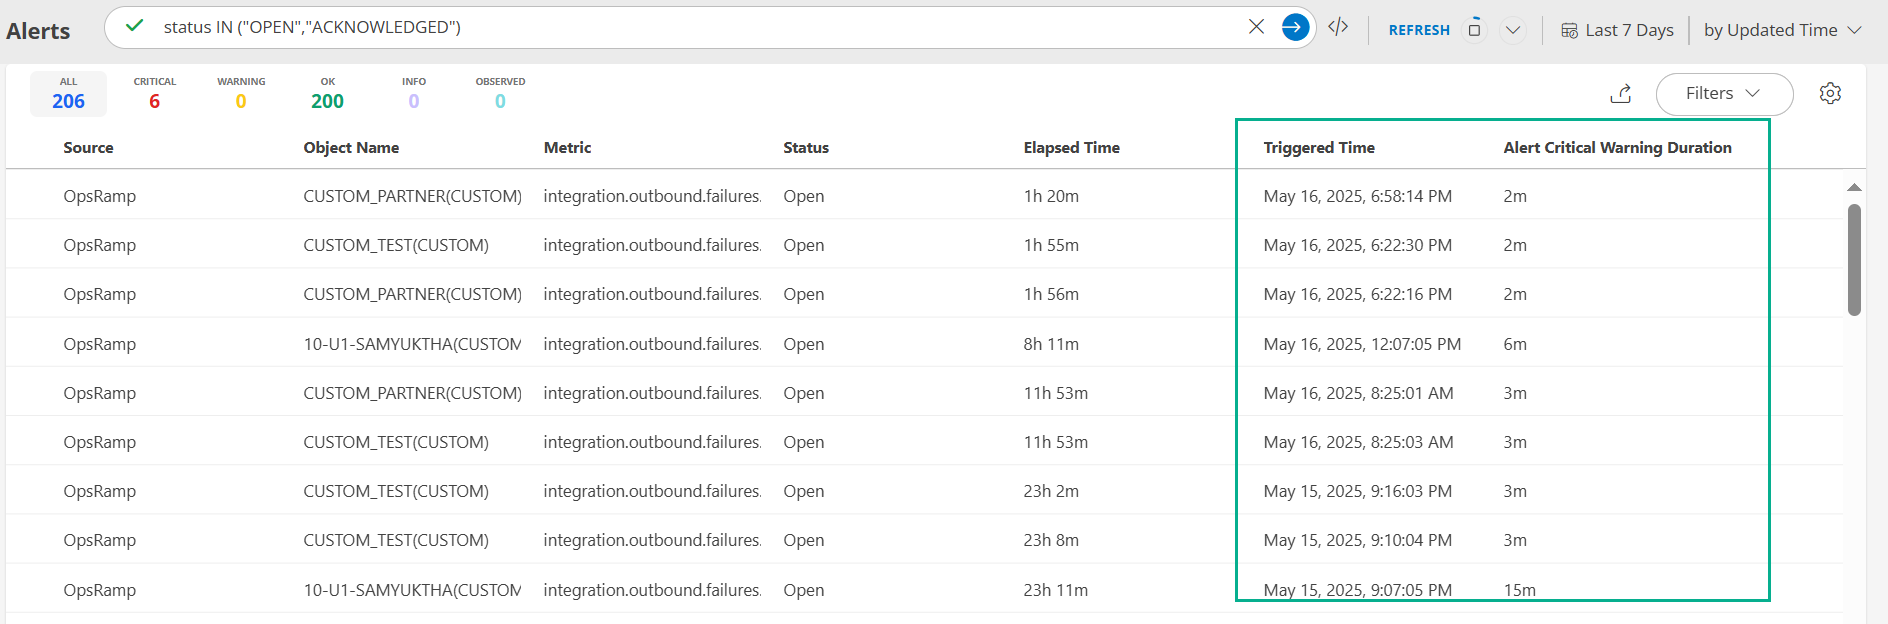
Updated Attribute Names:
- Heal Time is now Alert Critical Warning Duration.
- Created Time is now Triggered Time.
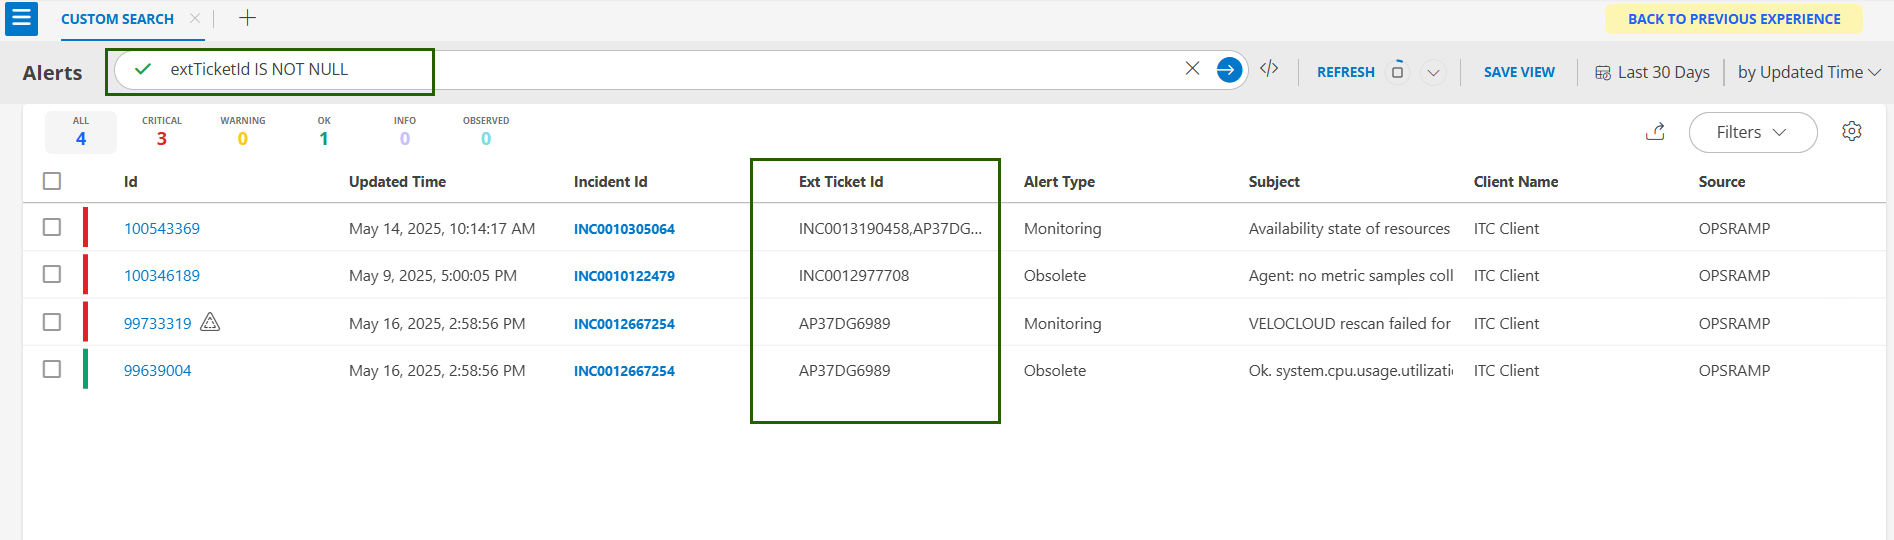
Manage External Ticket IDs
You can track and manage external ticket IDs directly from the Alert Browser:
- Filter Using OPSQL: Use the
extTicketIdattribute in your queries to find alerts linked to external tickets.Note
Use the contains operator with `extTicketId` in OPSQL queries. - Add as a Column: Add the External Ticket ID field via column settings for quick access. See Alerts Column Settings.
- View Multiple IDs: If an alert is linked to multiple tickets, all IDs are shown as comma-separated values.
Alert Email Notification
Alert email notifications now redirect to the new Alerts page. Actions such as Acknowledge and Suppress from escalation emails open directly in the new alert details page with the action applied.
Filtering Alerts
Use OpsQL to build custom queries for filtering and analyzing alert data. Queries consist of attributes, operators, and values, allowing you to define precise conditions (e.g., severity, state, source, timestamps). Combine multiple conditions using logical and comparison operators.
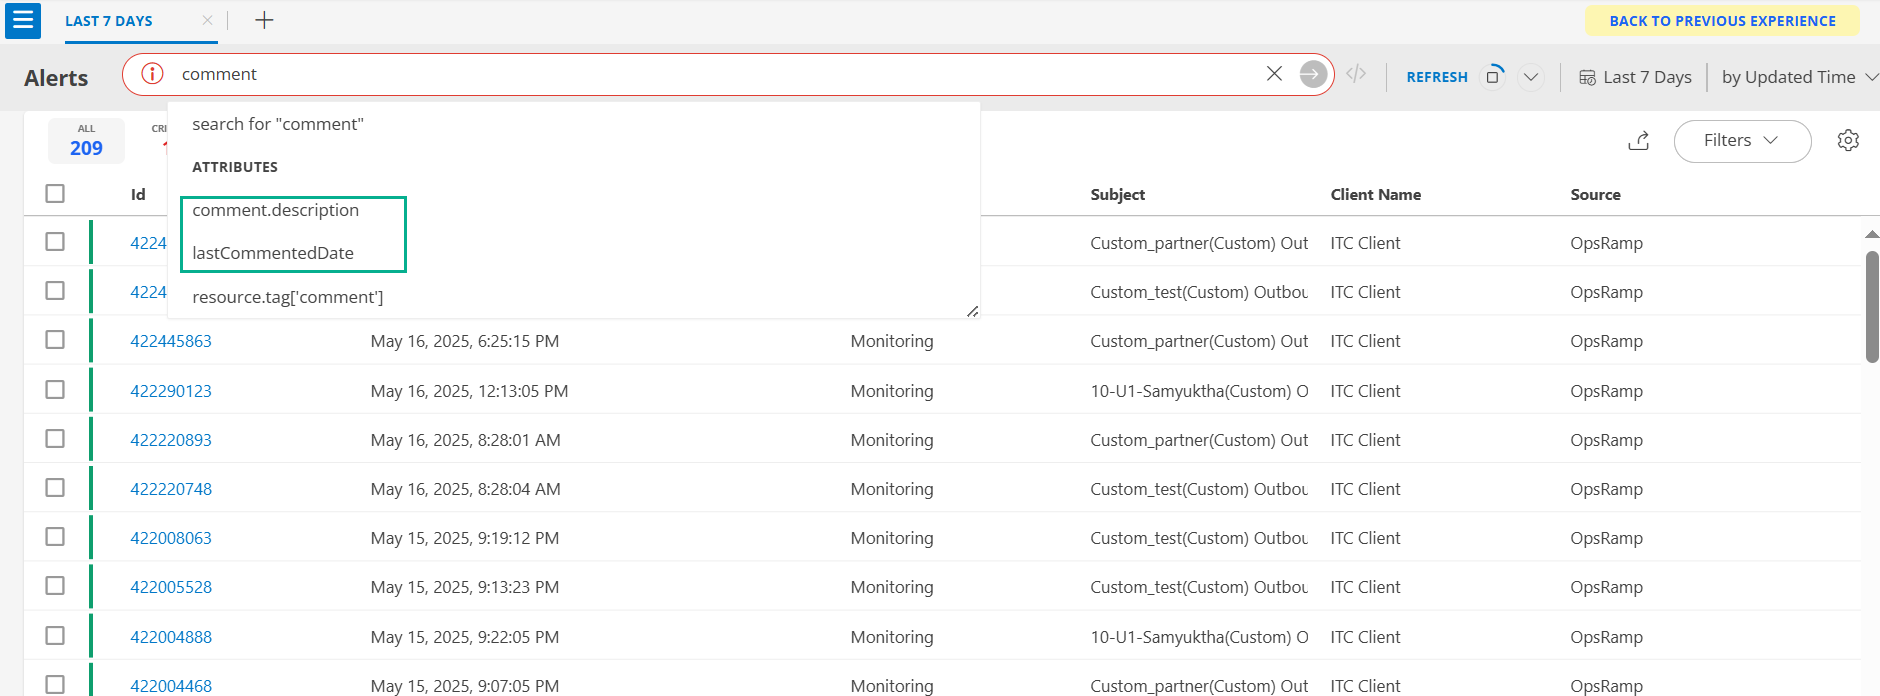
Filter by Comments
You can filter alerts based on comments and the timestamp of the last comment.
Supported Attributes:
comment.description: Search for keywords or phrases in alert comments.lastCommentDate: Filter alerts by the date/time of the last comment.
Note
- When using
lastCommentDate =, provide the full timestamp (date, time, seconds).
Example:lastCommentDate = "2025-05-15T10:45:30Z" - Older alerts may not appear if comments were added before comment indexing.
- Alerts with multiple matching comments may appear multiple times in results.
- Each row corresponds to a unique matching comment, even if multiple comments belong to the same alert.
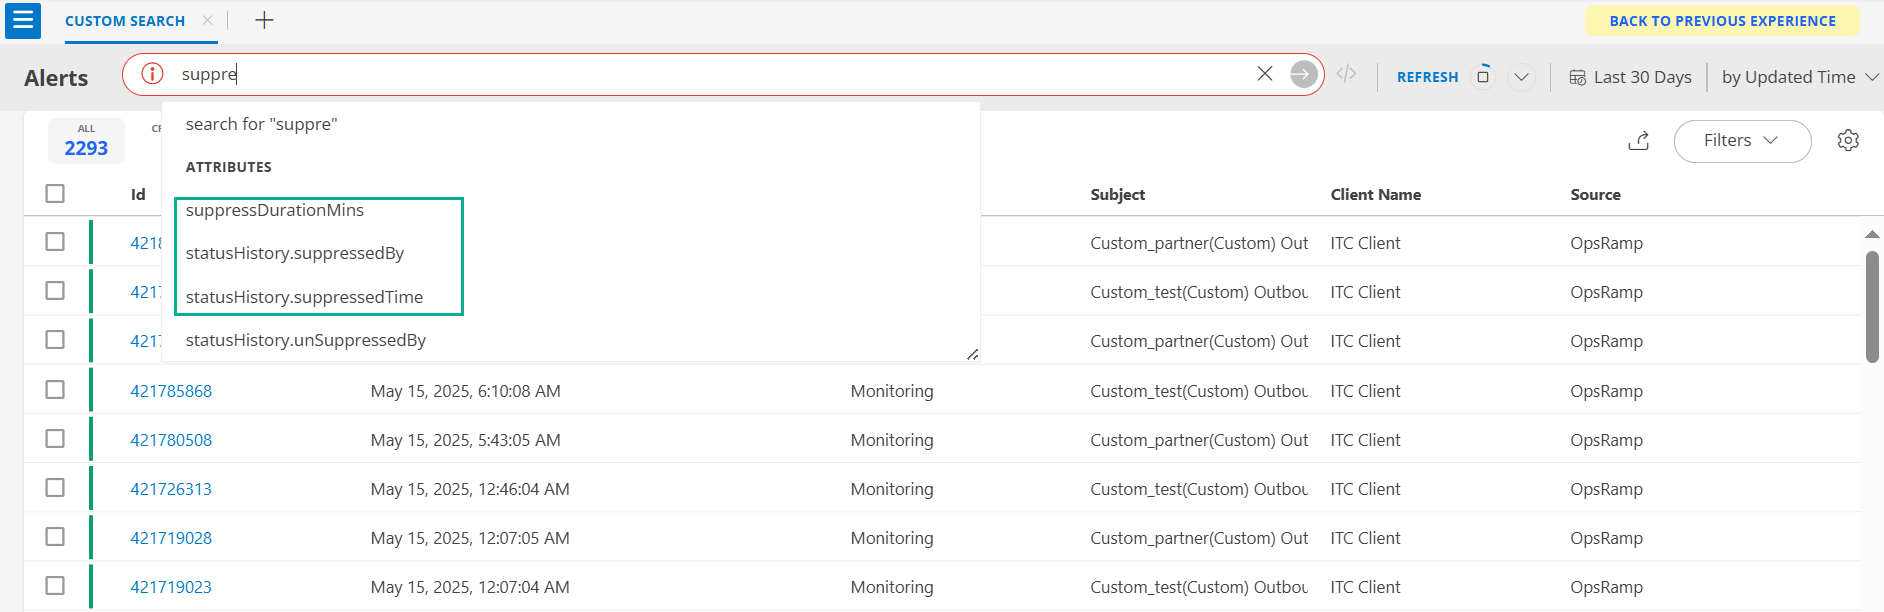
Filter by Suppression Duration
You can filter suppressed alerts by duration and time period using OpsQL.
Suppressed for a specific duration (in minutes):
createdTime > -30d AND suppressDurationMins = 5Example: To search for 2 hours:Note
Suppression duration in hours is not directly supported. Convert hours to minutes and use `suppressDurationMins`.createdTime > -30d AND suppressDurationMins = 120Suppressed permanently:
createdTime > -30d AND suppressDurationMins = 0 AND status = 'Suppressed'Suppressed between specific dates/times:
status = 'Suppressed' AND statusHistory.suppressedTime > '2025-03-10T10:05:00+0000' AND statusHistory.suppressedTime < '2025-03-11T10:05:00+0000'
Alerts Slide-Out
The Alerts Slide-Out provides a summary of an alert.
To view the slide-out:
- Click the Alert ID in the listing page.
By default, open and acknowledged alerts from the last 7 days are shown.
For query building, see How to build queries.
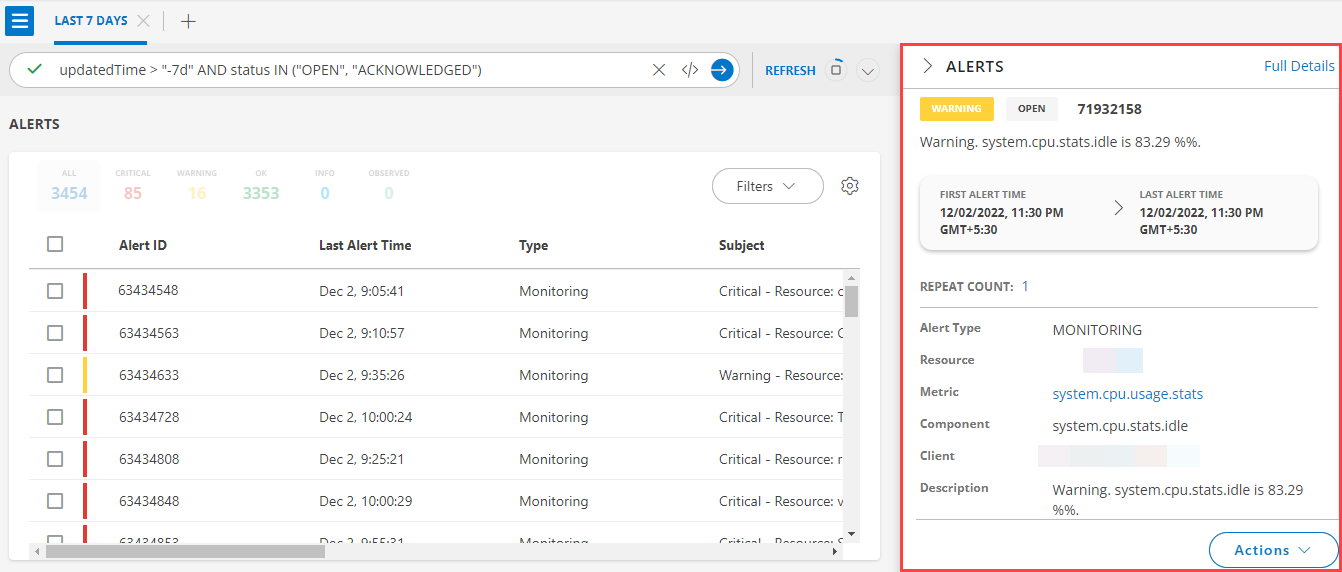
Slide-Out Information:
- Current alert status, state, and ID
- First and last alert times
- Total occurrences (repeat count), inference, and correlation details
- Alert type, resource, metric, component, client, description, resource type
- Last comment
- View Details for more information
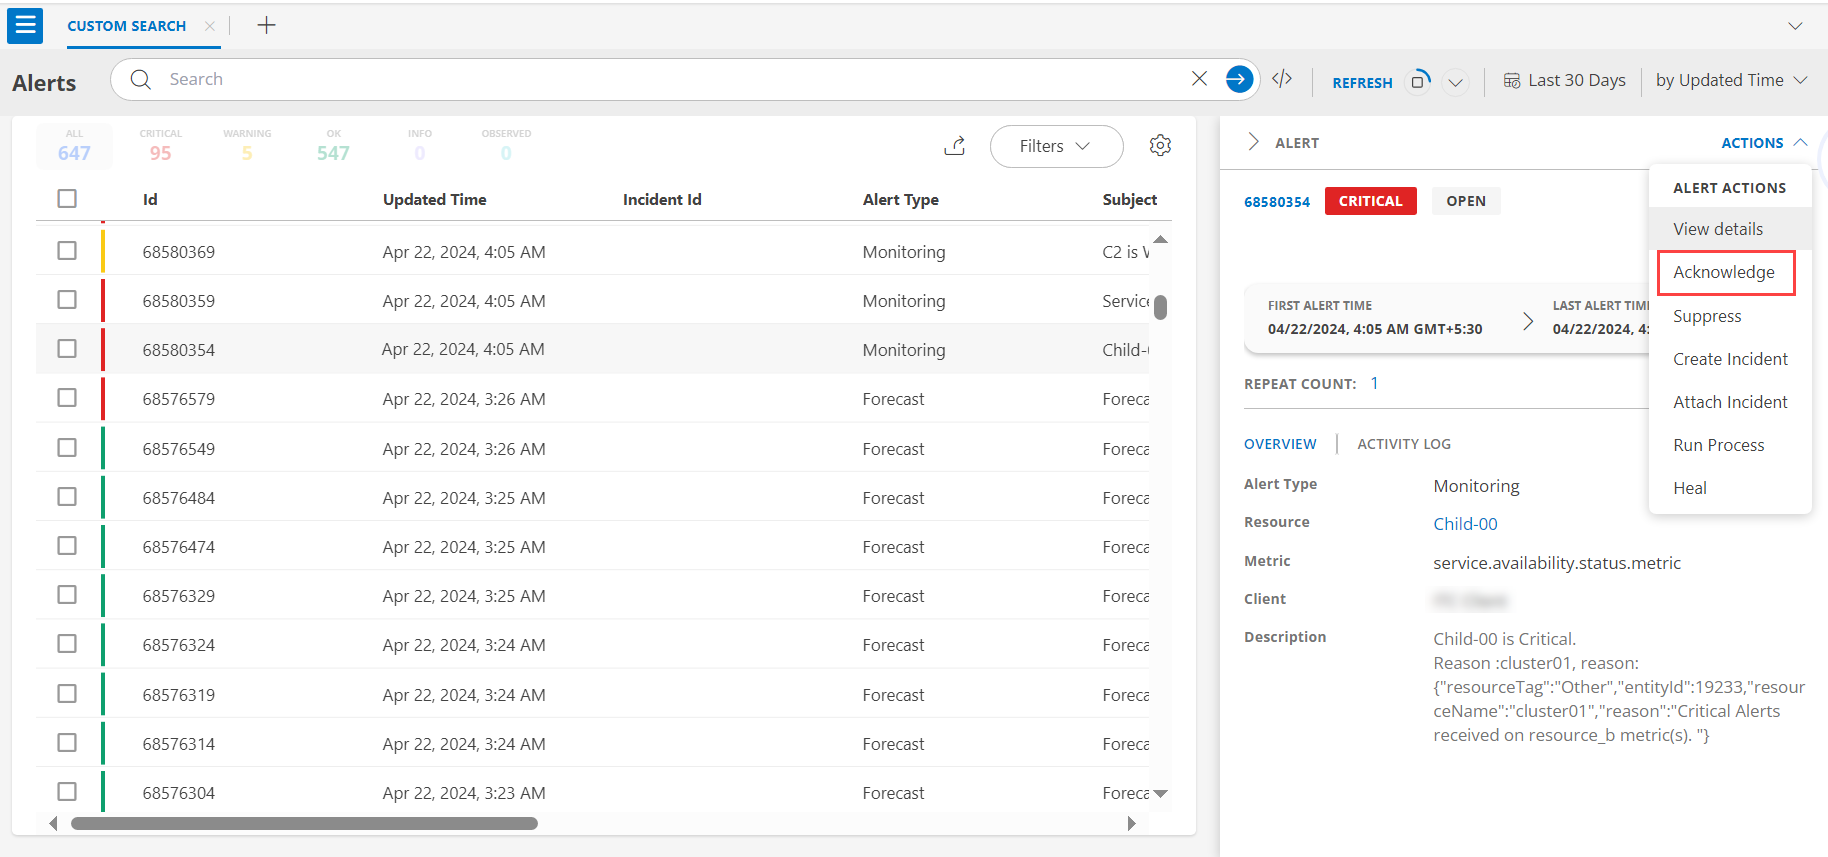
- ACTIONS button for alert actions:
| Action | Description |
|---|---|
| View details | See more information about the alert. |
| Acknowledge | Confirm you have seen the alert. See [Acknowledge an alert](#acknowledge-an-alert). |
| Suppress | Suppresses the current and duplicate alerts. |
| Create Incident | Create a ticket for the alert, assign users, and set priority. See [Create incident](#create-incident). |
| Attach Incident | Attach an incident to the alert. |
| Run Process | Add and run a process definition on the alert. |
| Heal | Heals an alert. |
Acknowledge an Alert
Acknowledging an alert confirms you have seen and are aware of it. This helps ensure critical issues are addressed and clarifies responsibility among team members.
As per the design, when an alert notification is triggered in a critical state, a corresponding notification is also sent when the alert transitions to a heal state.
If the alert is acknowledged after the notification is sent, any further escalations for subsequent critical or warning states are skipped.
To acknowledge:
- Select an alert in the browser. The slide-out appears.
- Click Actions.
- Select Acknowledge.
- Enter comments.
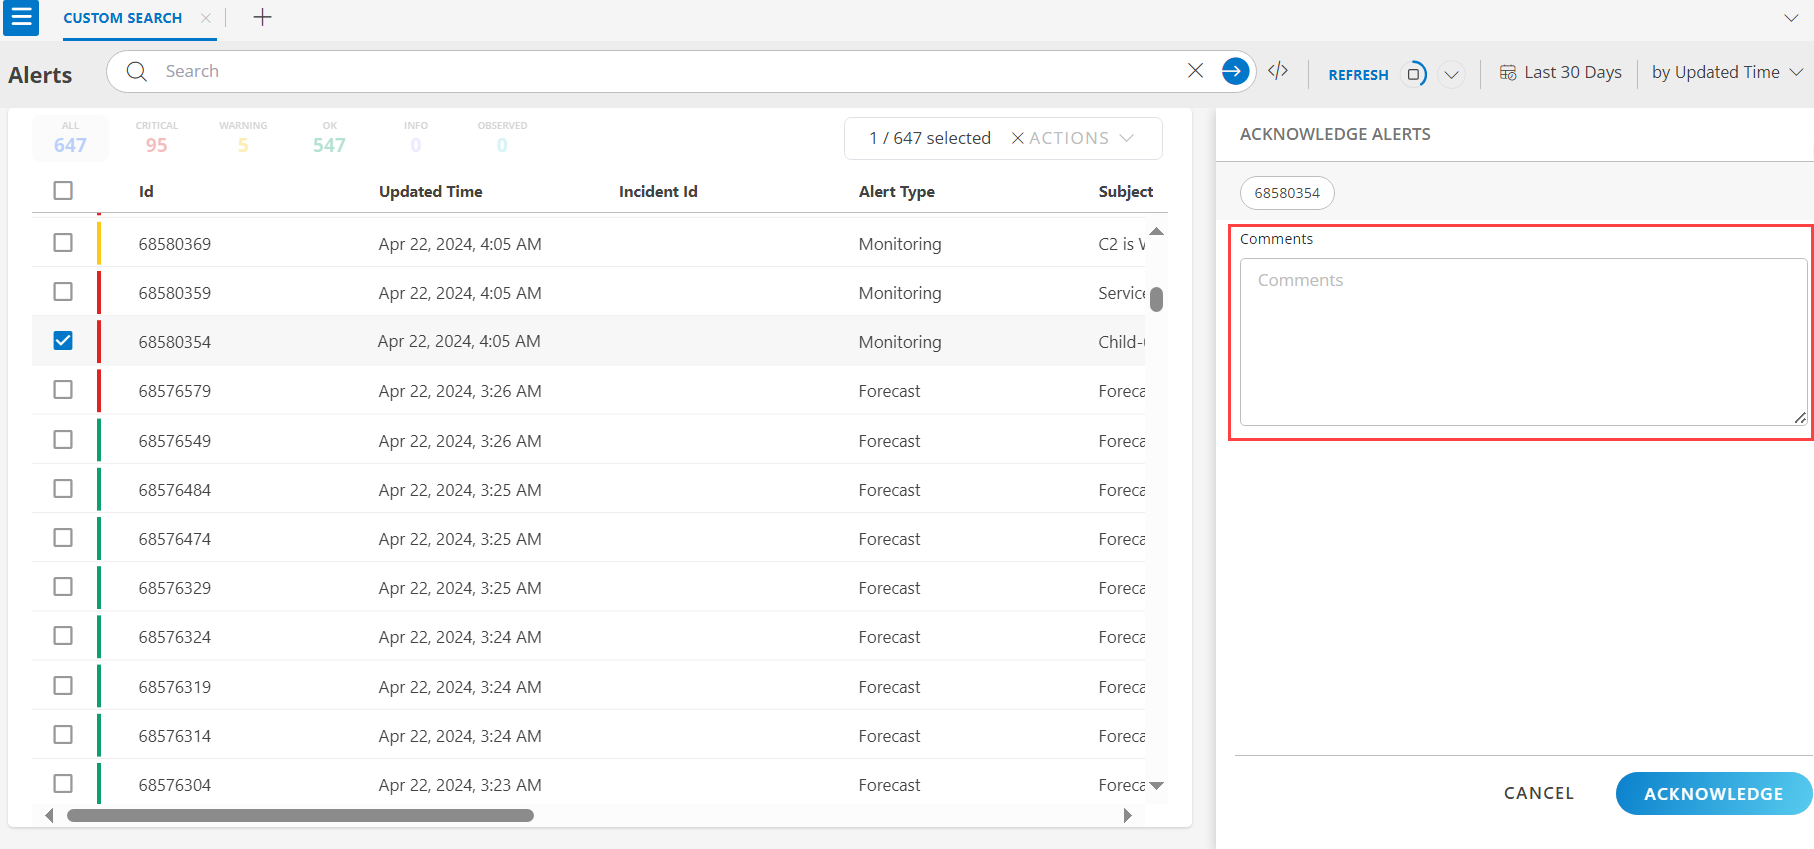
- Click ACKNOWLEDGE. The alert is acknowledged.
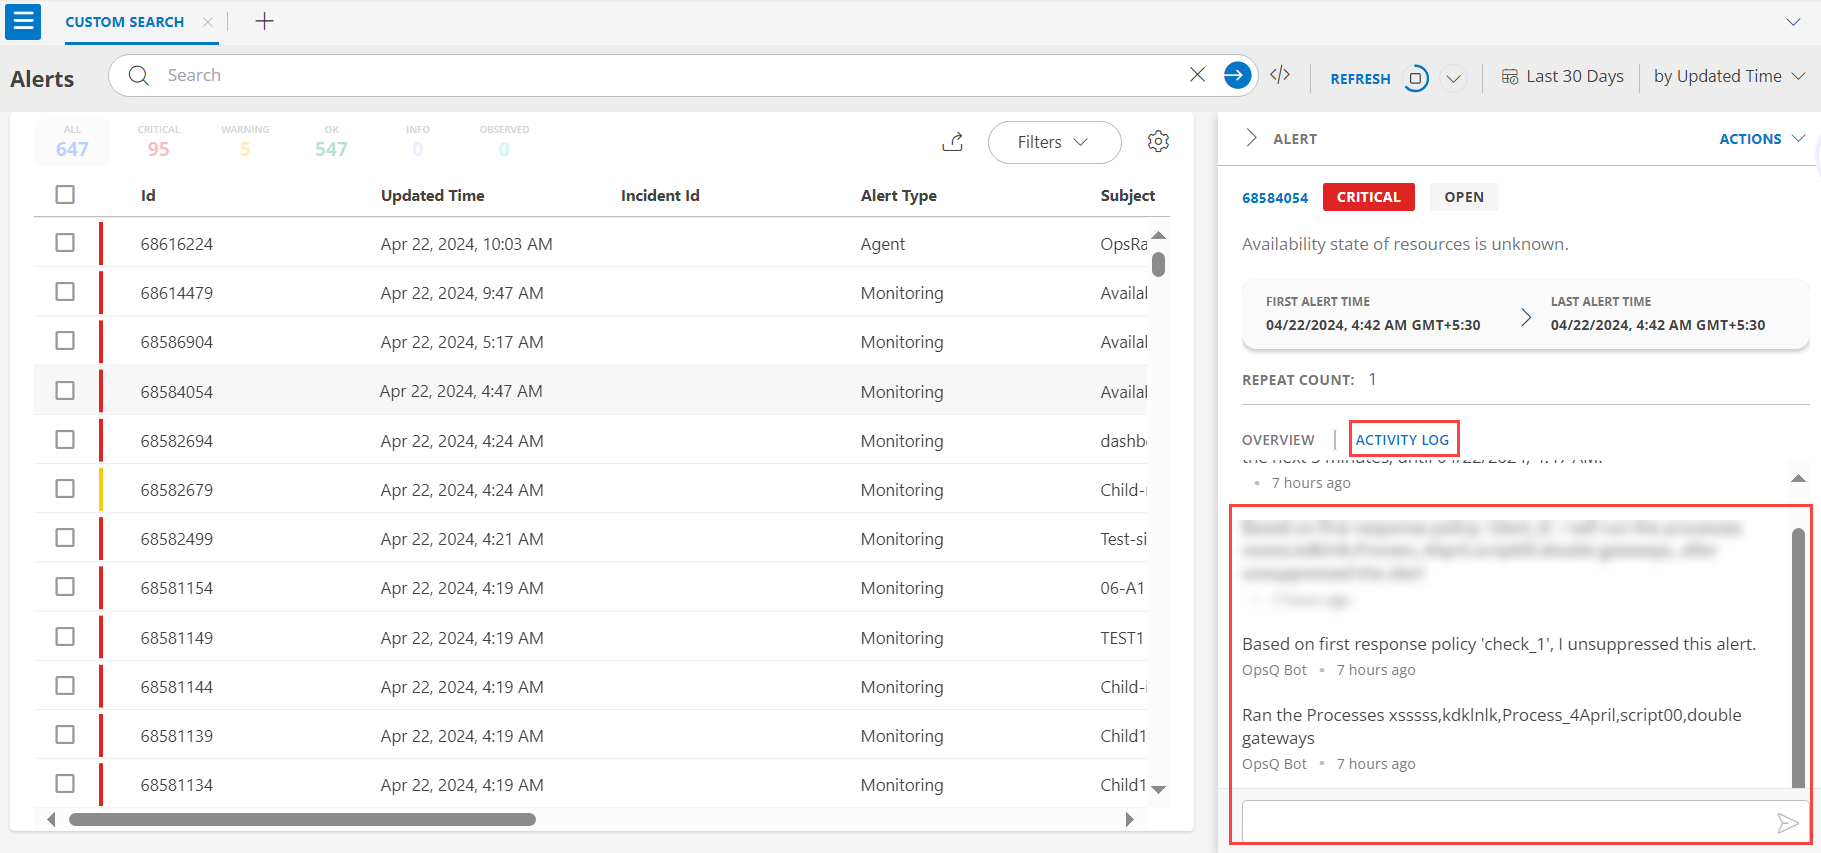
You can view the last acknowledged user and comments in the ACTIVITY LOG tab.
Create Incident
Go to the Alerts page.
Select an alert.
On the alert details page, click Create / Attach.
On the Add Incident page, fill the details and click SAVE. See Create an Incident for more details.
Note
When you create an incident from the Alert Details page using the Create option, the ticket description automatically includes Canned Response token values. If no default Canned Response template is available, a default message with the incident details is automatically applied to the description.Enter incident details and click Save.
The incident number appears in the “incidentId” column. Click it to view or modify the incident.
Suppress an Alert
- Go to the Alerts page.
- Select an alert. The slide-out appears.
- Click Actions.
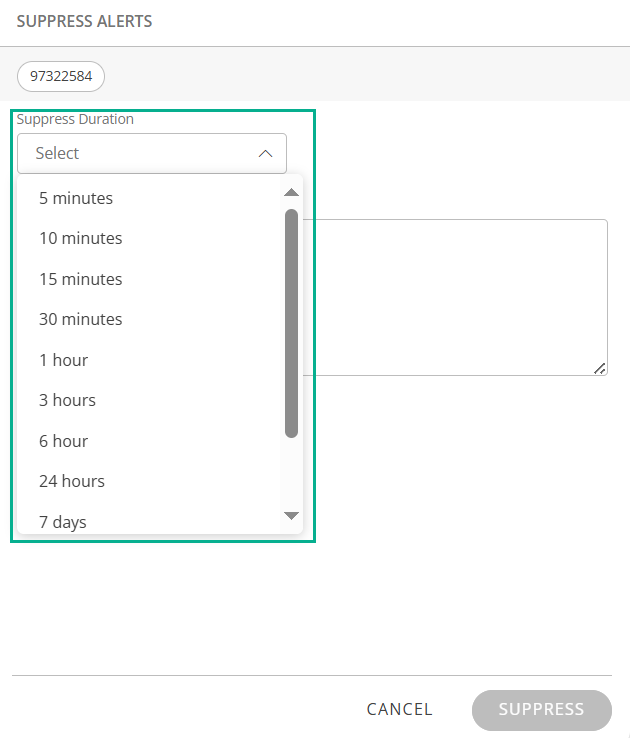
- Select Suppress.
- Set the suppress duration and enter comments.
- Click SUPPRESS.
Create Inference
Note
You need ALERTS_MANAGE permission to create an inference.Creating an inference groups related alerts into a single event, helping identify root causes.
- Go to the Alerts page.
- Select multiple alerts.
- Click Actions > Create Inference.
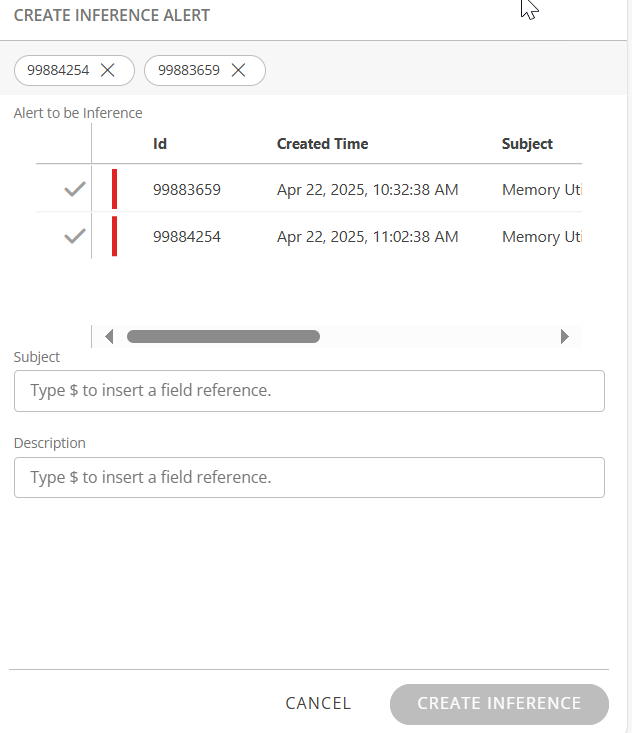
- On the Create Inference Alert page, enter:
- Alert to be Inference: List of selected alerts (ID, Created Time, Subject)
- Subject: Enter a summary (use
$for dynamic fields) - Description: Add details (use
$for dynamic fields)
- Click CREATE INFERENCE.
Merge Inferences
You can merge multiple child inferences (Open or Acknowledged) into a manually created Master Inference Alert.
Note
Only manually created inferences can be used as master alerts. System-generated inferences are not supported.Go to the Alerts page.
Select multiple child inferences.
Note
 To list manually created inferences, use:
 `isInferenceAlert = "true" AND correlationPolicyId IS NULL`
Click Actions > Attach Inference.
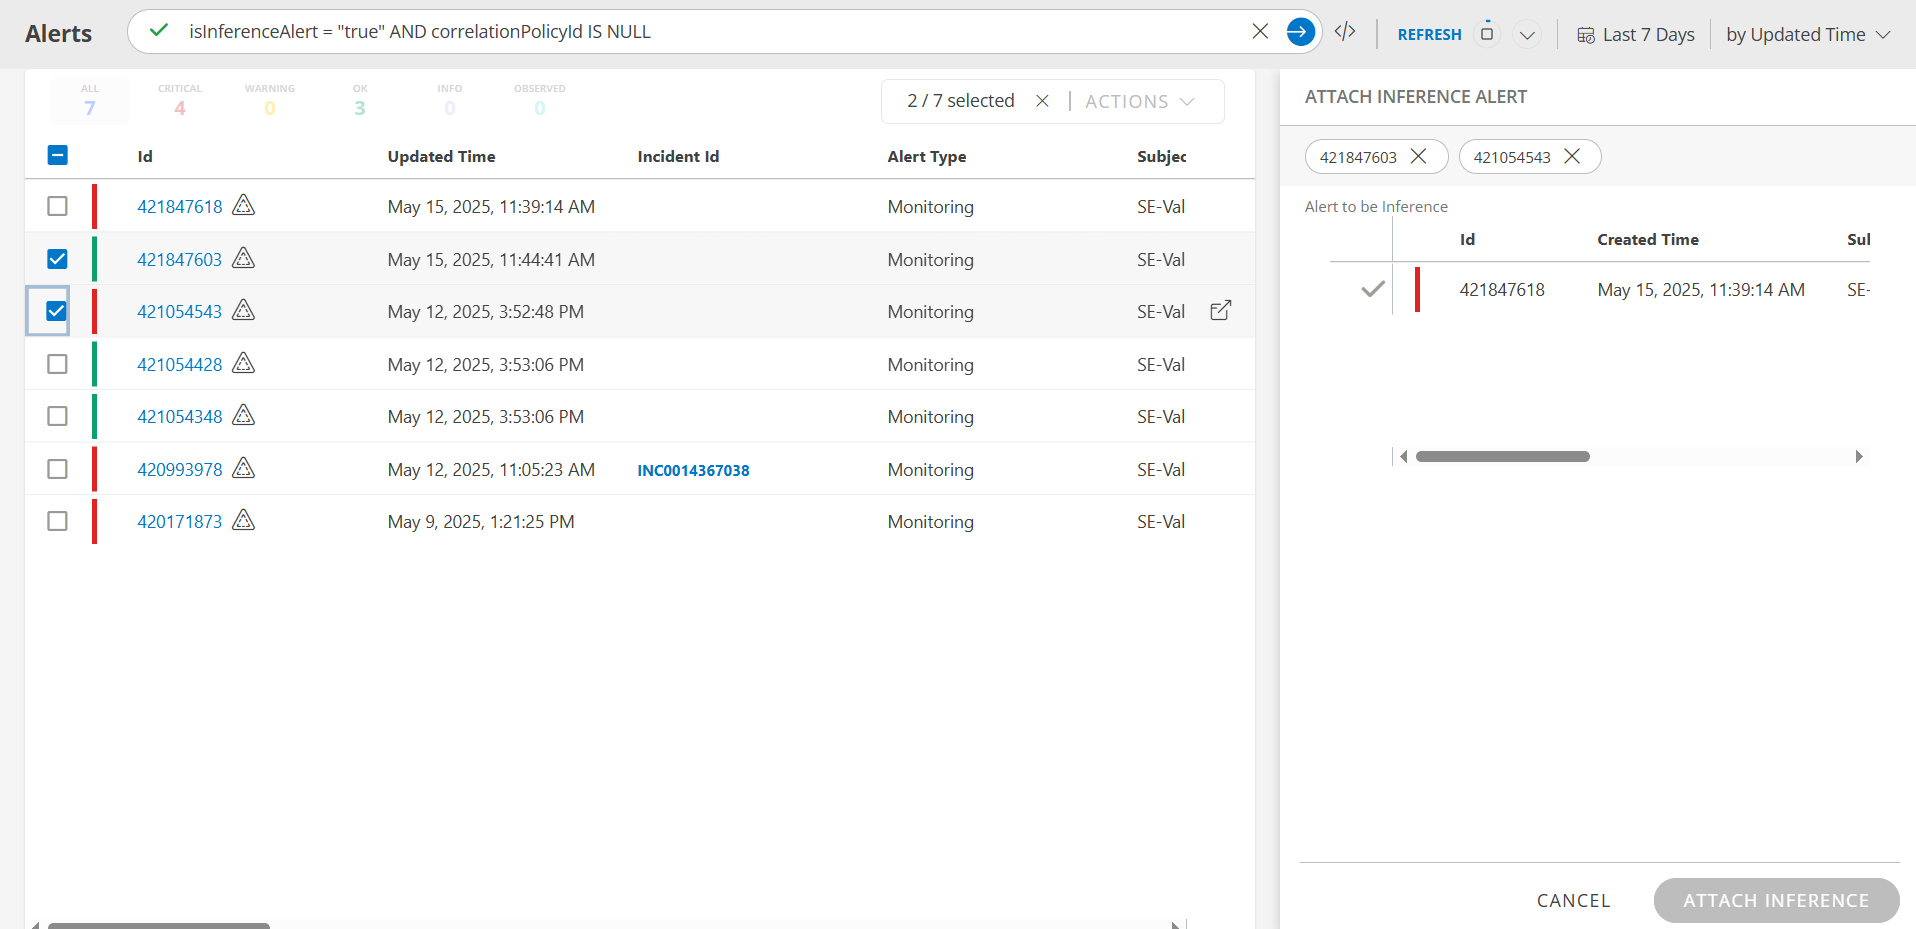
- Select the master inference to attach the selected child inferences.
Note
- Up to 250 alerts can be selected for manual inference. If any are inference alerts, the limit is 50.
- Older inferences can be attached as child alerts to a new master inference created within the last 24 hours.
- Inferences older than 24 hours cannot be used as master inferences but can be attached as child inferences.
- Click ATTACH INFERENCE.
Attach Incident
The Attach Incident feature allows users to associate multiple relevant alerts with a single applicable incident directly using bulk actions.
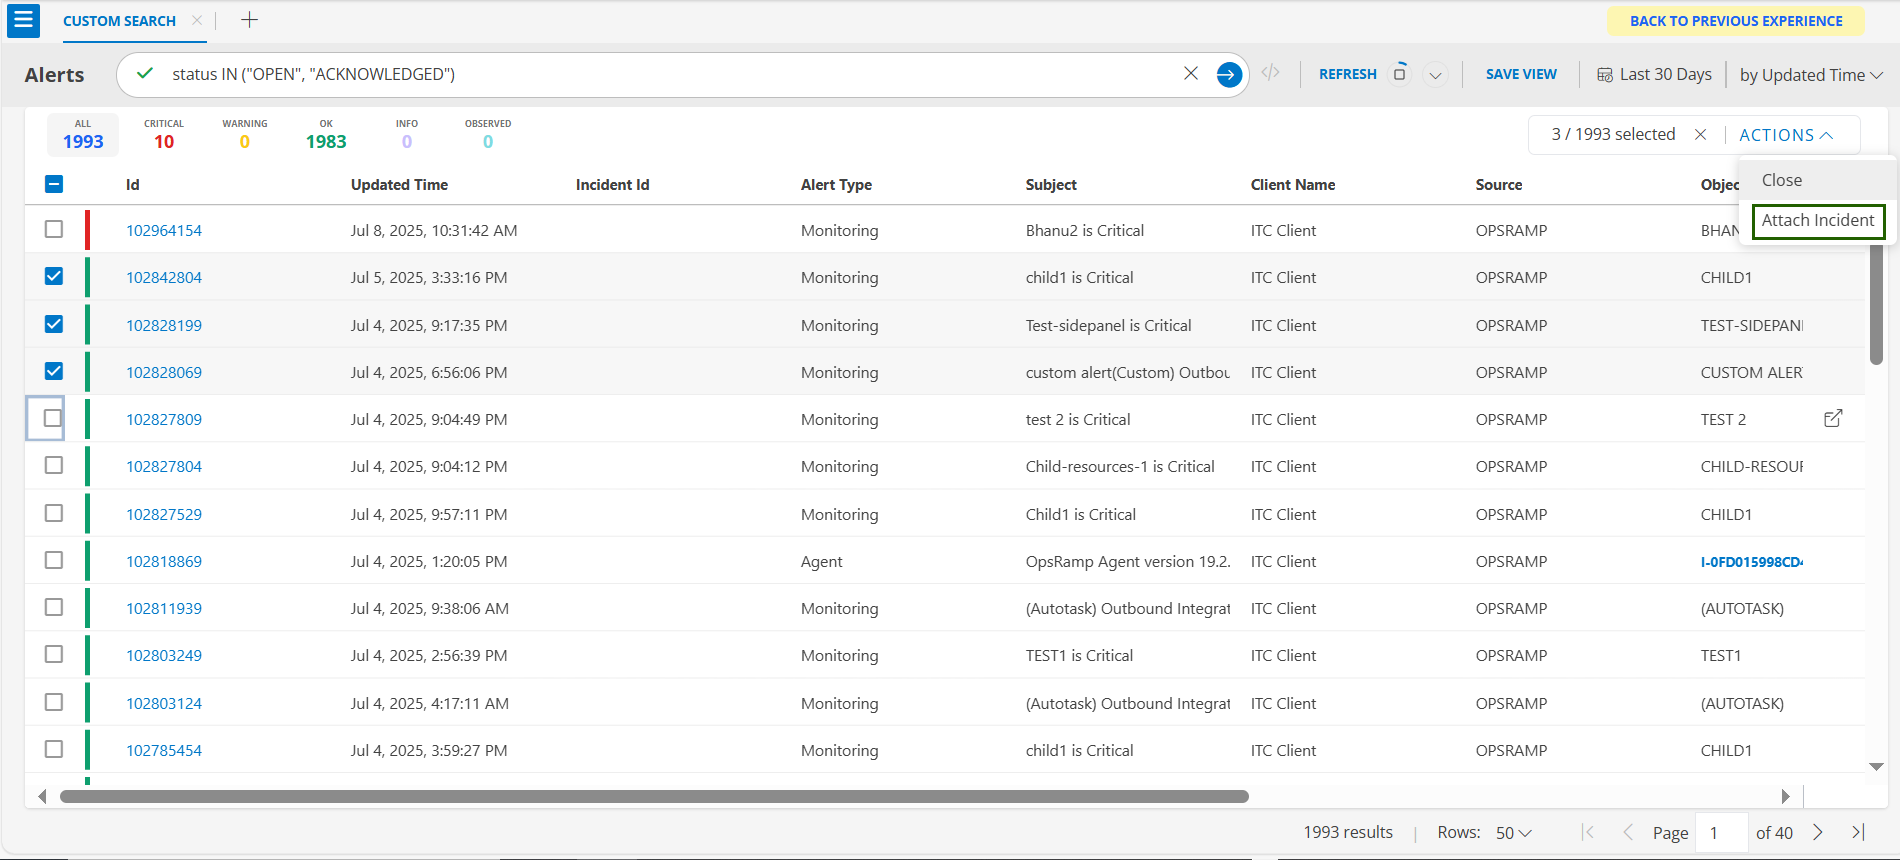
To attach incident:
Select multiple alerts and click Attach Incident under the Actions menu.The Attach Incident screen appears.
This screen displays a list of incidents with statuses New or Open.
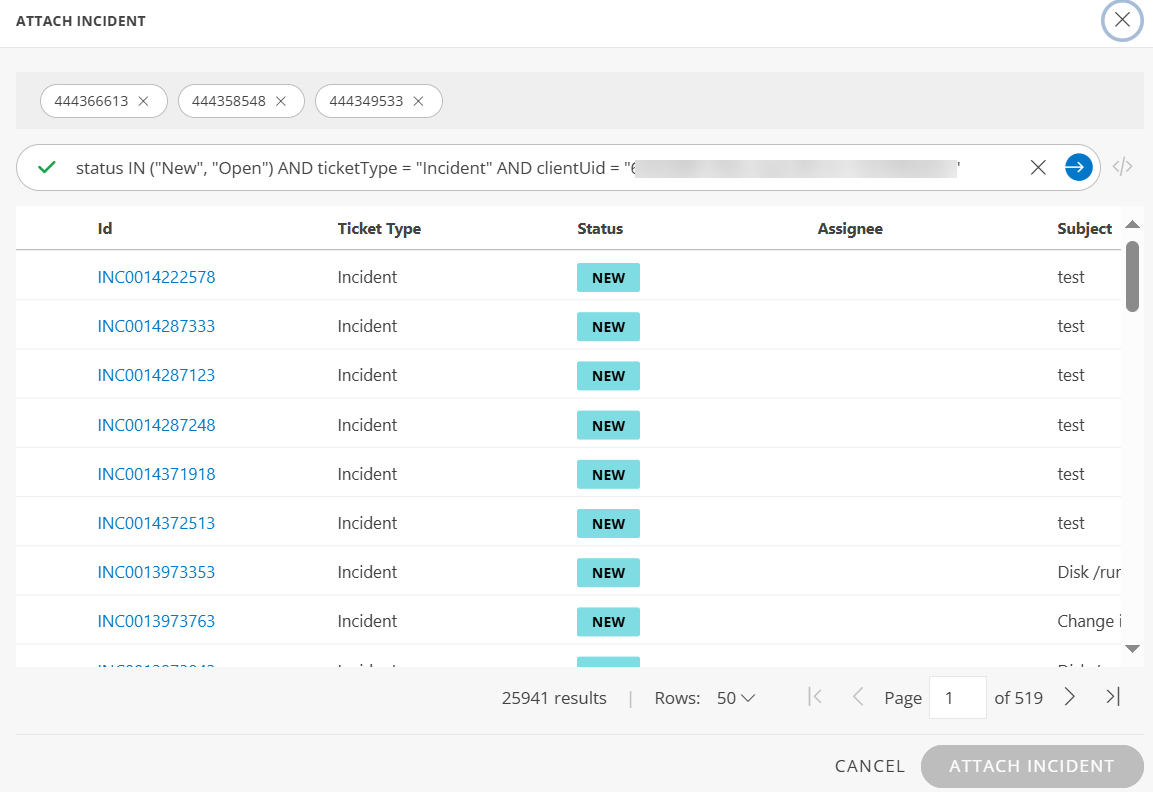
You can select any of these incidents to attach the selected alerts.
Note
If an incident has a Closed status, it will be listed with the Attach Incident button disabled.Export Alerts
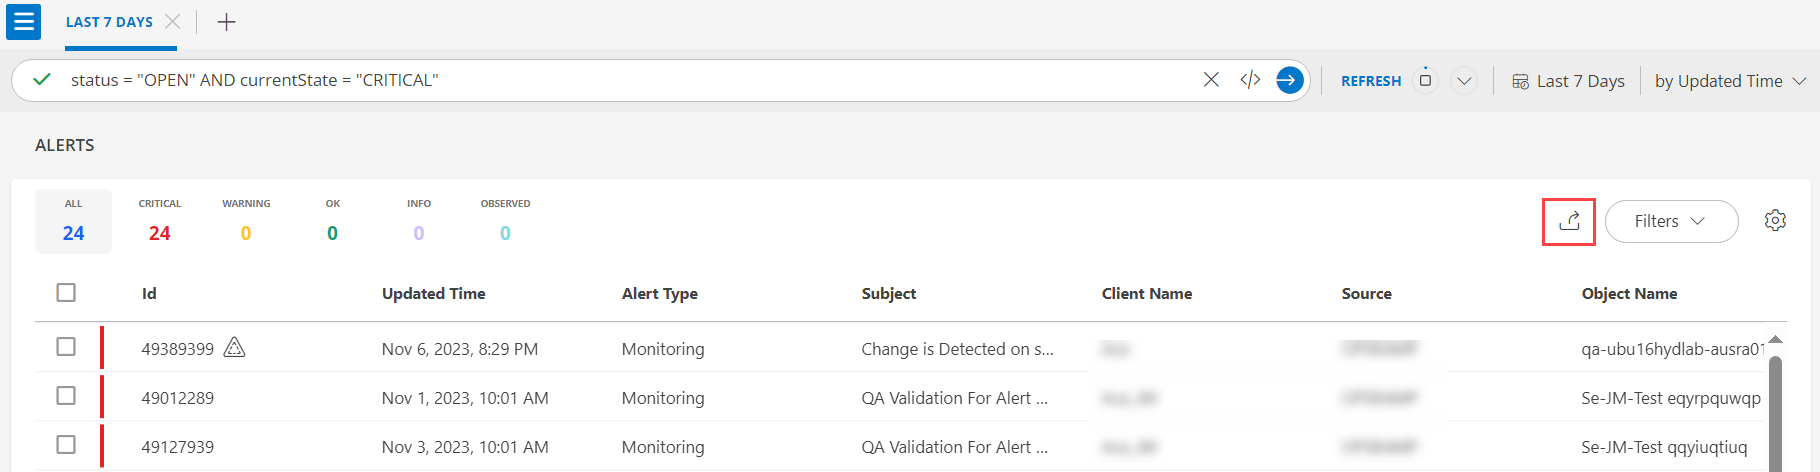
Export alerts from the Alerts 2.0 page as a report.
Prerequisite: The Alert Listing app must be installed.
To export:
- Select a client from All Clients.
- Use OpsQL to search for alerts.
- Click the Export icon next to Filters.
 - If the app is not installed, click **Install App**.
 - The Alert Listing app opens with your filter criteria pre-filled.
 - The export process starts automatically.
- Click the Recent icon in Configure Parameters to view progress.
How to Build Queries
Build queries using Basic or Advanced modes. Both modes provide dynamic lists of attributes, operators, and values.
For Basic Users
The Basic Query mode lets you build queries without knowing the syntax.
To build a query:
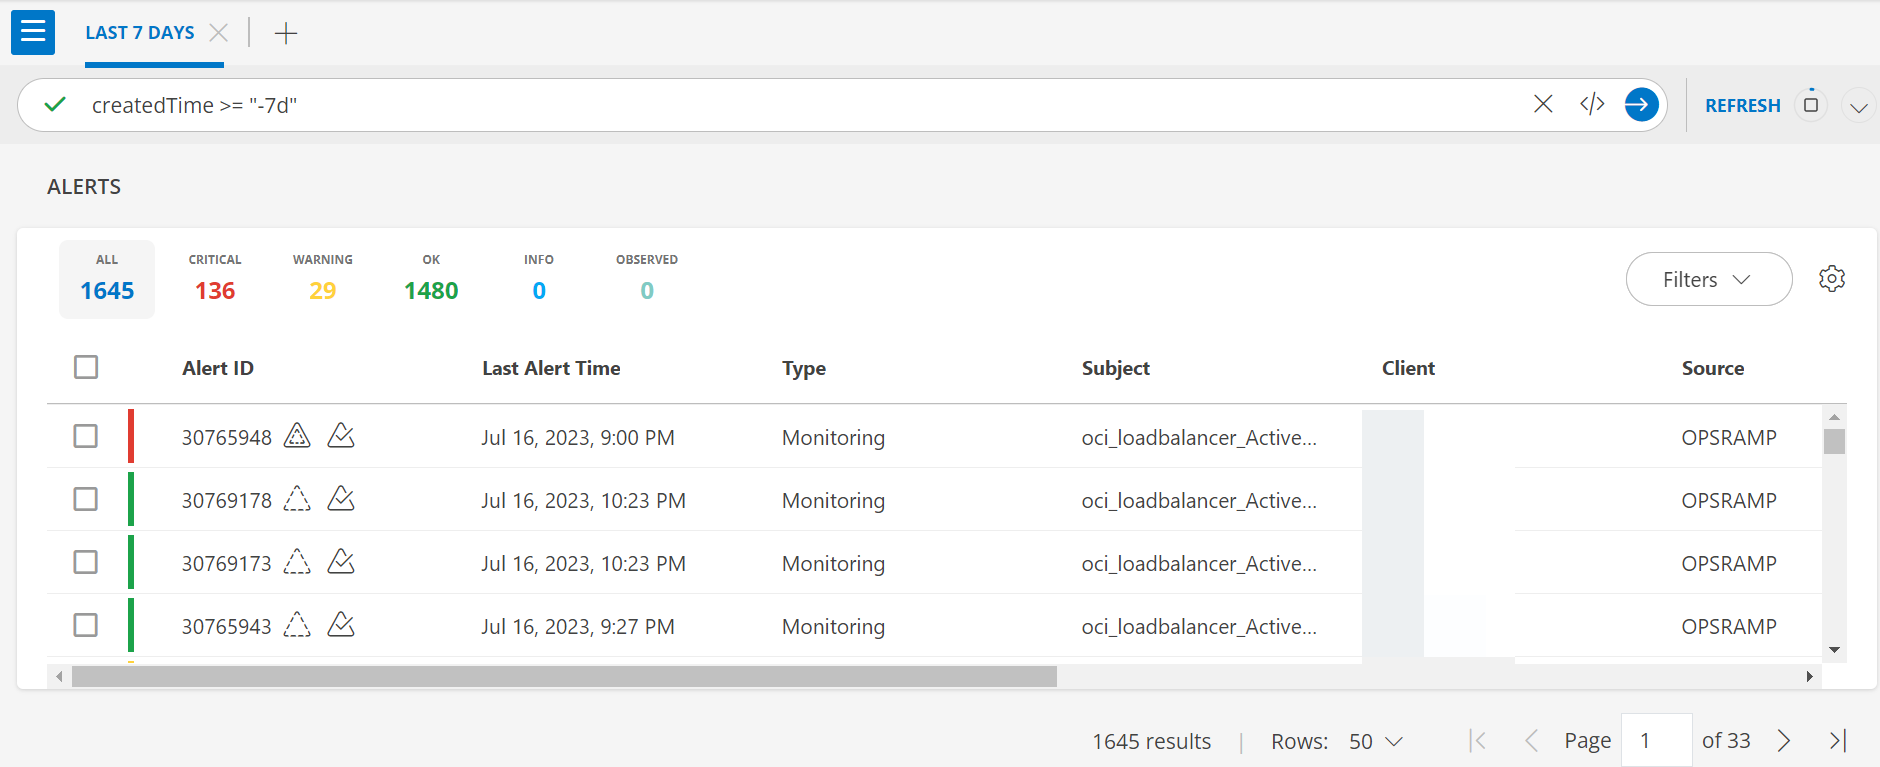
- Click Command Center > Alerts.
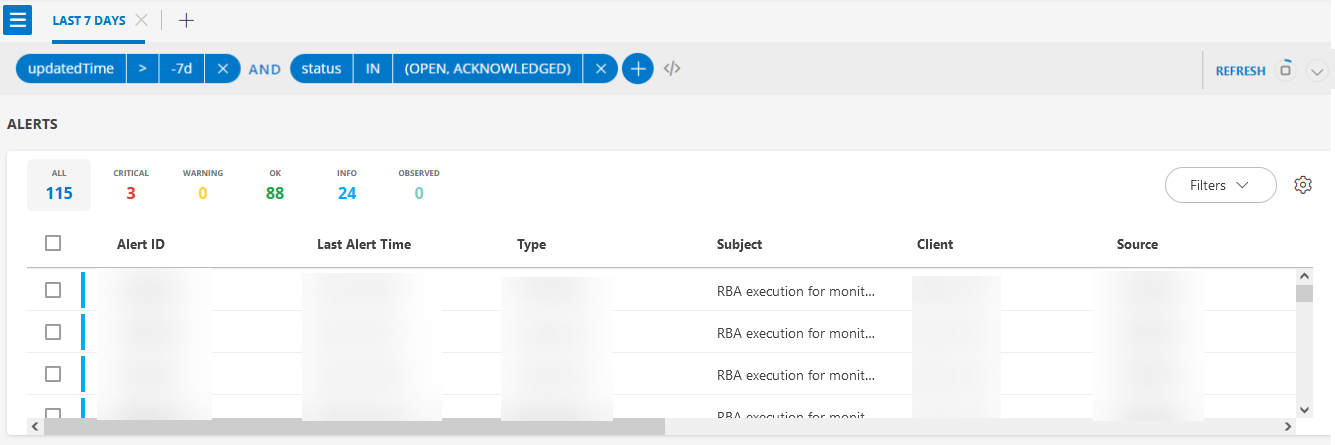
- By default, Open and Acknowledged alerts from the last 7 days are shown.
- Click +QUERY to start.
- Select an attribute, operator, and value.
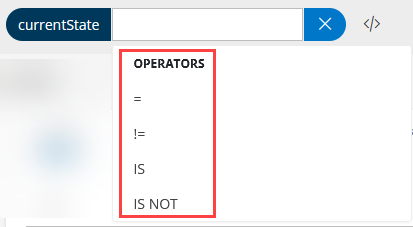
- Click + to add more expressions.
- The AND operator is selected by default; change if needed.
- Continue adding expressions as needed.
- To create a new tab, click +.
- To delete a query, click X.
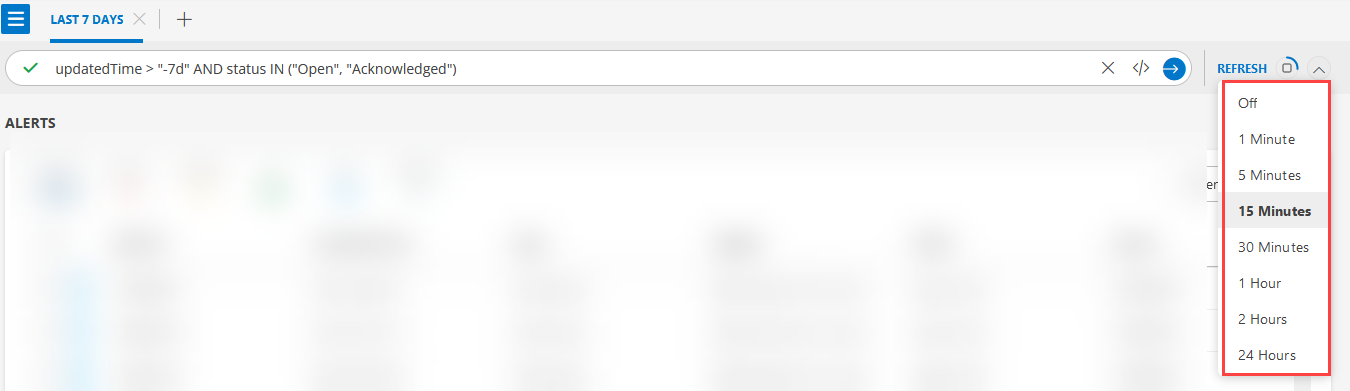
- Click REFRESH to update results. Set refresh duration from 1 minute to 24 hours (default: 15 minutes). Click Off to disable auto-refresh.
For Power Users
Advanced Query mode allows direct entry of OpsQL queries.
To use Advanced mode:
- Click Command Center > Alerts.
- Click the Advanced Query mode icon.
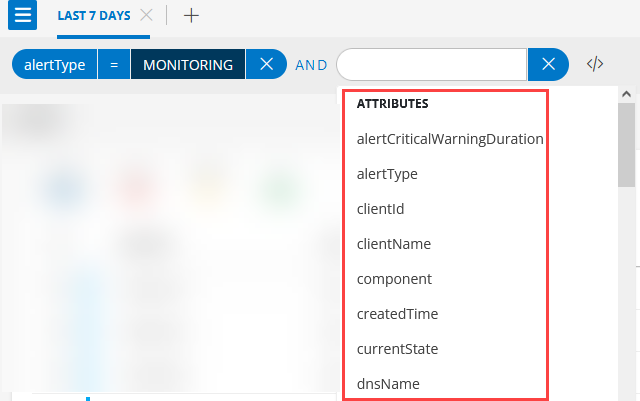
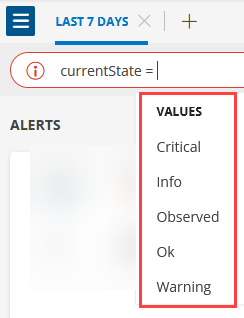
- Start typing an attribute in the Search box; matching attributes appear.
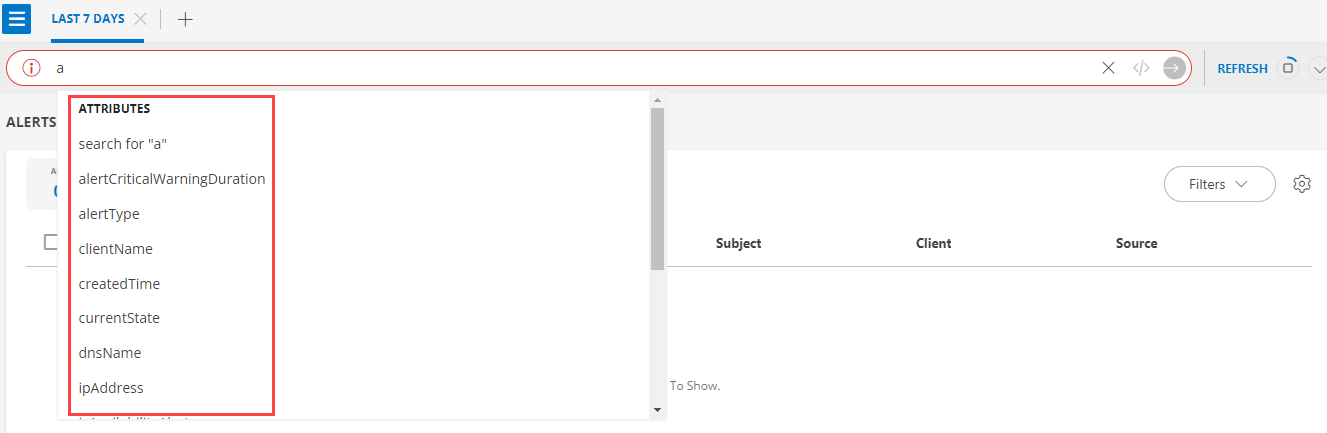
- Select the attribute, operator, and value.
- Select logical operators (AND or OR).
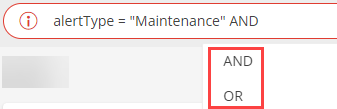
- Add more expressions as needed.
- Click the search icon or press Enter to run the query.
You can switch between Basic and Advanced modes at any time.
For more on OpsQL, see Query Language Reference.
Alert Filters
You can apply the following filters in Alerts 2.0:
| Attribute Name | Description |
|---|---|
| Created Time | Alert created time. Select the date range. |
| Updated Time | Alert updated time. Select the date range. |
| Resources | Search for the resources. Note: Also available as an inline filter. |
| Entity Type | Filter alerts by entity type:
|
| Metrics | Filter alerts by metric name. Note: Also available as an inline filter. |
| Resource Types | Filter alerts by resource type. |
| Alert Types | Filter alerts by alert type:
|
| Priorities | Filter alerts by priority, where P0 is the highest priority and P5 is the lowest priority. |
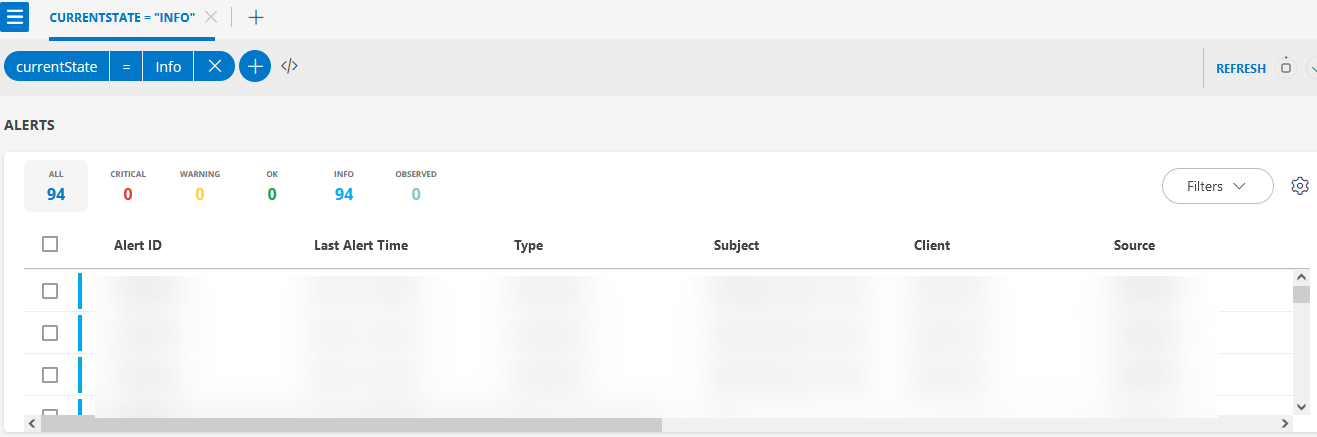
| Current States | Filter alerts by their current state:
|
| Status | Filter alerts by their current status:
|
Inline Filter
The Inline filter lets you add a cell value as an additional filter. For example, clicking the filter icon next to a metric filters results by that metric.
View Resource Custom Attributes as Alert Tags
Prerequisite
Custom attributes must be defined as alert tags on the associated resources. See Add custom attribute values.Resource-level custom attributes marked as Alert Tags are automatically reflected in alerts from those resources, improving visibility and filtering.
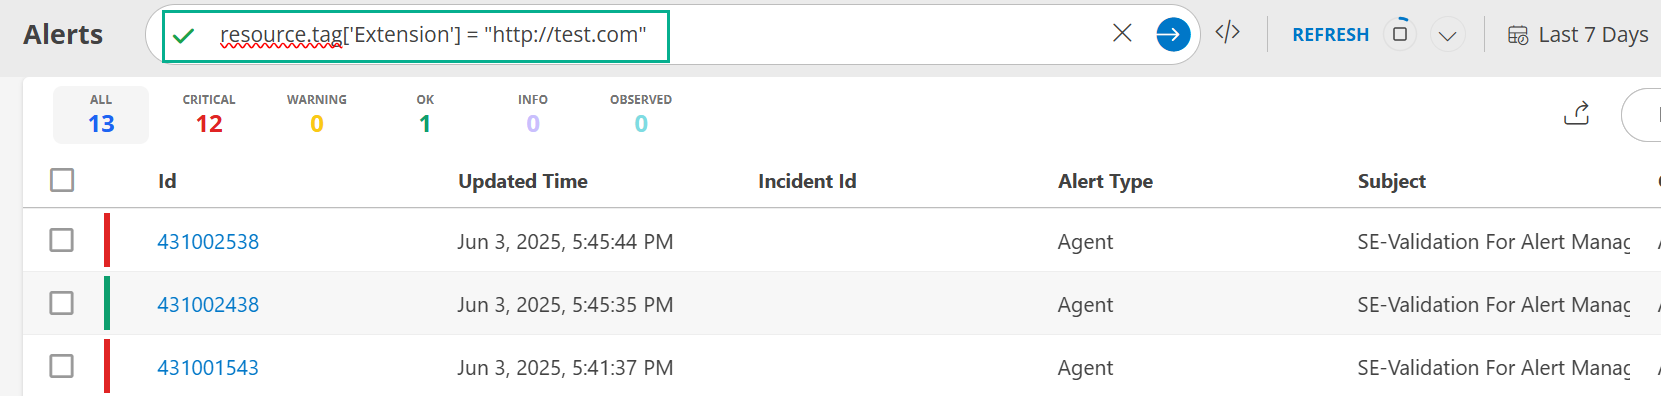
Filtering Using Resource Tags:
Use alert tags in OPSQL queries to filter relevant alerts.
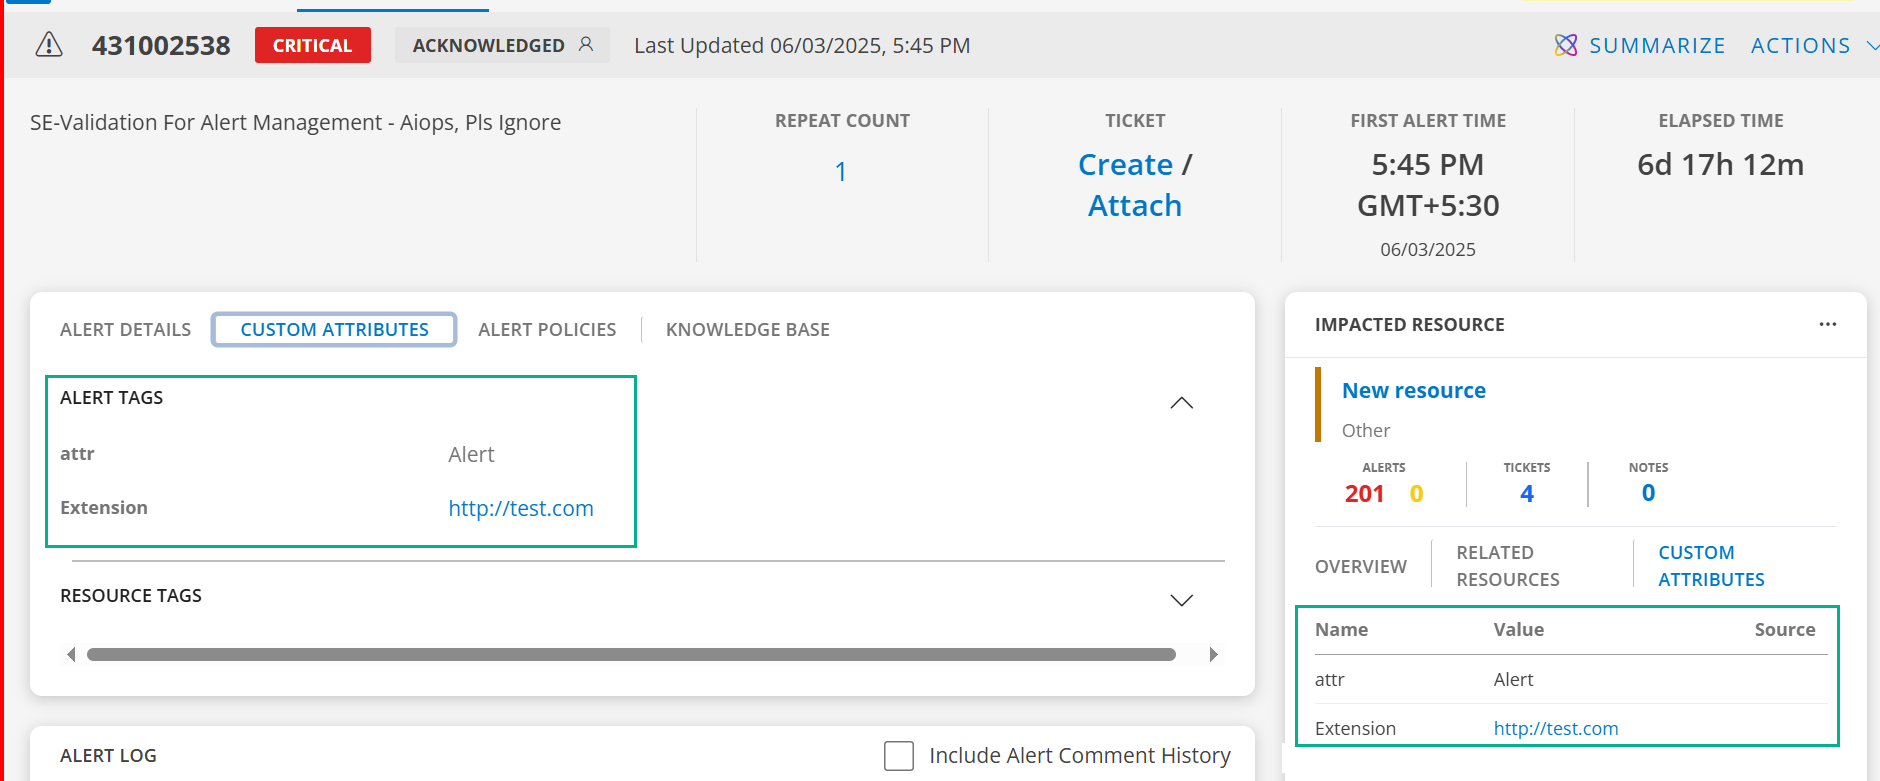
Viewing Alert Tags:
- On the Alerts page, select an alert.
- In the alert details, go to the CUSTOM ATTRIBUTES tab.
- Under ALERT TAGS, view all resource custom attributes marked as alert tags.
Correlated and Inference Alert Icons
You can identify Correlated and Inference alerts by icons in the Alerts 2.0 page. To identify the correlated and inference alerts, hover over the icon next to the Alert ID, on the Alerts 2.0 page.
De-Correlate Alerts
You can de-correlate one or more correlated alerts from the Alerts 2.0 page.
To de-correlate:
Select correlated alerts.

Click Actions.
Select De-Correlate from the drop-down list.
The DE-CORRELATE ALERTS slide-out page is displayed.
Enter the comments and click DE-CORRELATE.
The correlated alert is de-correlated.
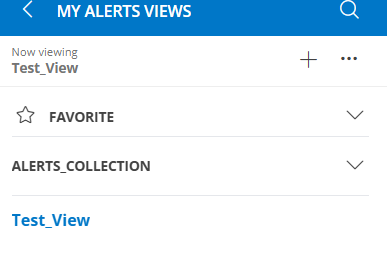
My Alerts Views
Access the My Alerts Views slide-out by clicking the hamburger menu at the upper-left of the Alerts page.
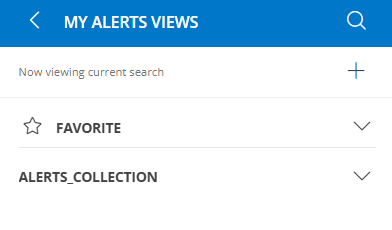
Available actions:
Save a View
Save query results as a view for future use.
To save:
- Click the hamburger menu.
- Click the + icon. The SAVE VIEW popup appears.
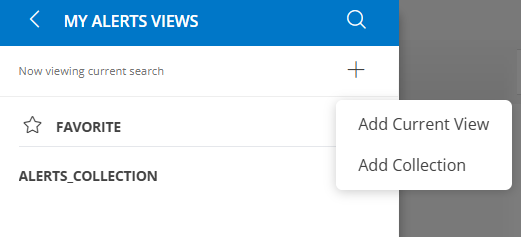
- Enter a name and click ADD.
- Use up/down arrows to show/hide views.
- Save and Restore icons appear after creating a view.
- Click the three dots next to a view for more actions.
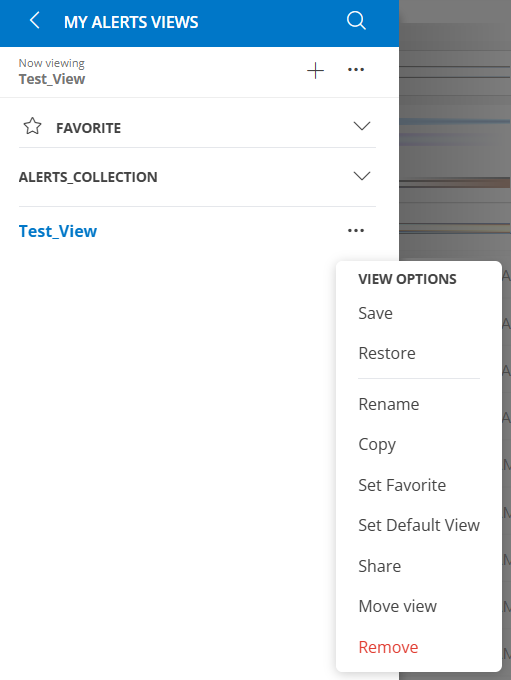
Set Favorite
To mark a view as favorite:
- Search for the view.
- Hover over the view name.
- Click the star icon. The view appears under FAVORITE. Click again to remove from favorites.
Restore
Restore reverts a view to its previous query.
- Hover over the view name.
- Click the actions menu.
- Click Restore. The previous query appears in the Search box.
Note: Do not save changes before restoring, or the query will not revert.
Rename
To rename a view:
- Hover over the view name.
- Click the actions menu.
- Click Rename.
- Enter a new name and click SAVE.
Copy
To copy a view:
- Hover over the view name.
- Click the actions menu.
- Click Copy.
- Enter a name and click SAVE.
Set Default View
Set a view as the default for the current user.
Hover over the view name.
Click the actions menu.
Click Set Default View.
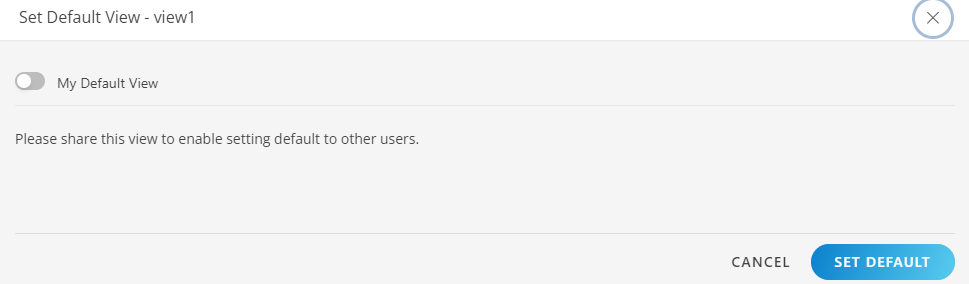
Enable My Default View and click SET DEFAULT.
Refresh the browser to see the default view.
To set as default for others, share the view and set it as default for the desired user.
Share
Share a view with specific partner or client roles.
- Hover over the view name.
- Click the actions menu.
- Click Share.
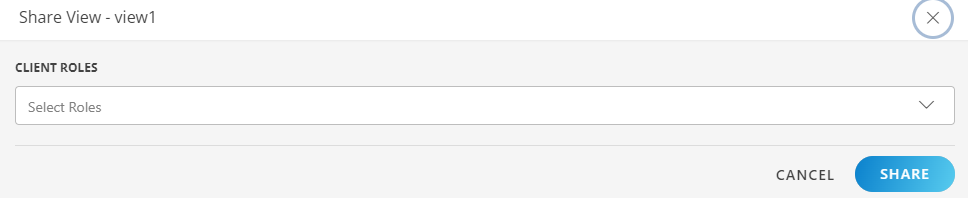
- Select a role and click SHARE.
Notes:
- The view is available to users with assigned roles.
- Partners can share with both partners and clients; clients can share only with clients.
- Views can be shared with multiple roles.
- Users can assign a default view to others by sharing it.
Remove
To remove a view:
- Hover over the view name.
- Click the actions menu.
- Click Remove and confirm.
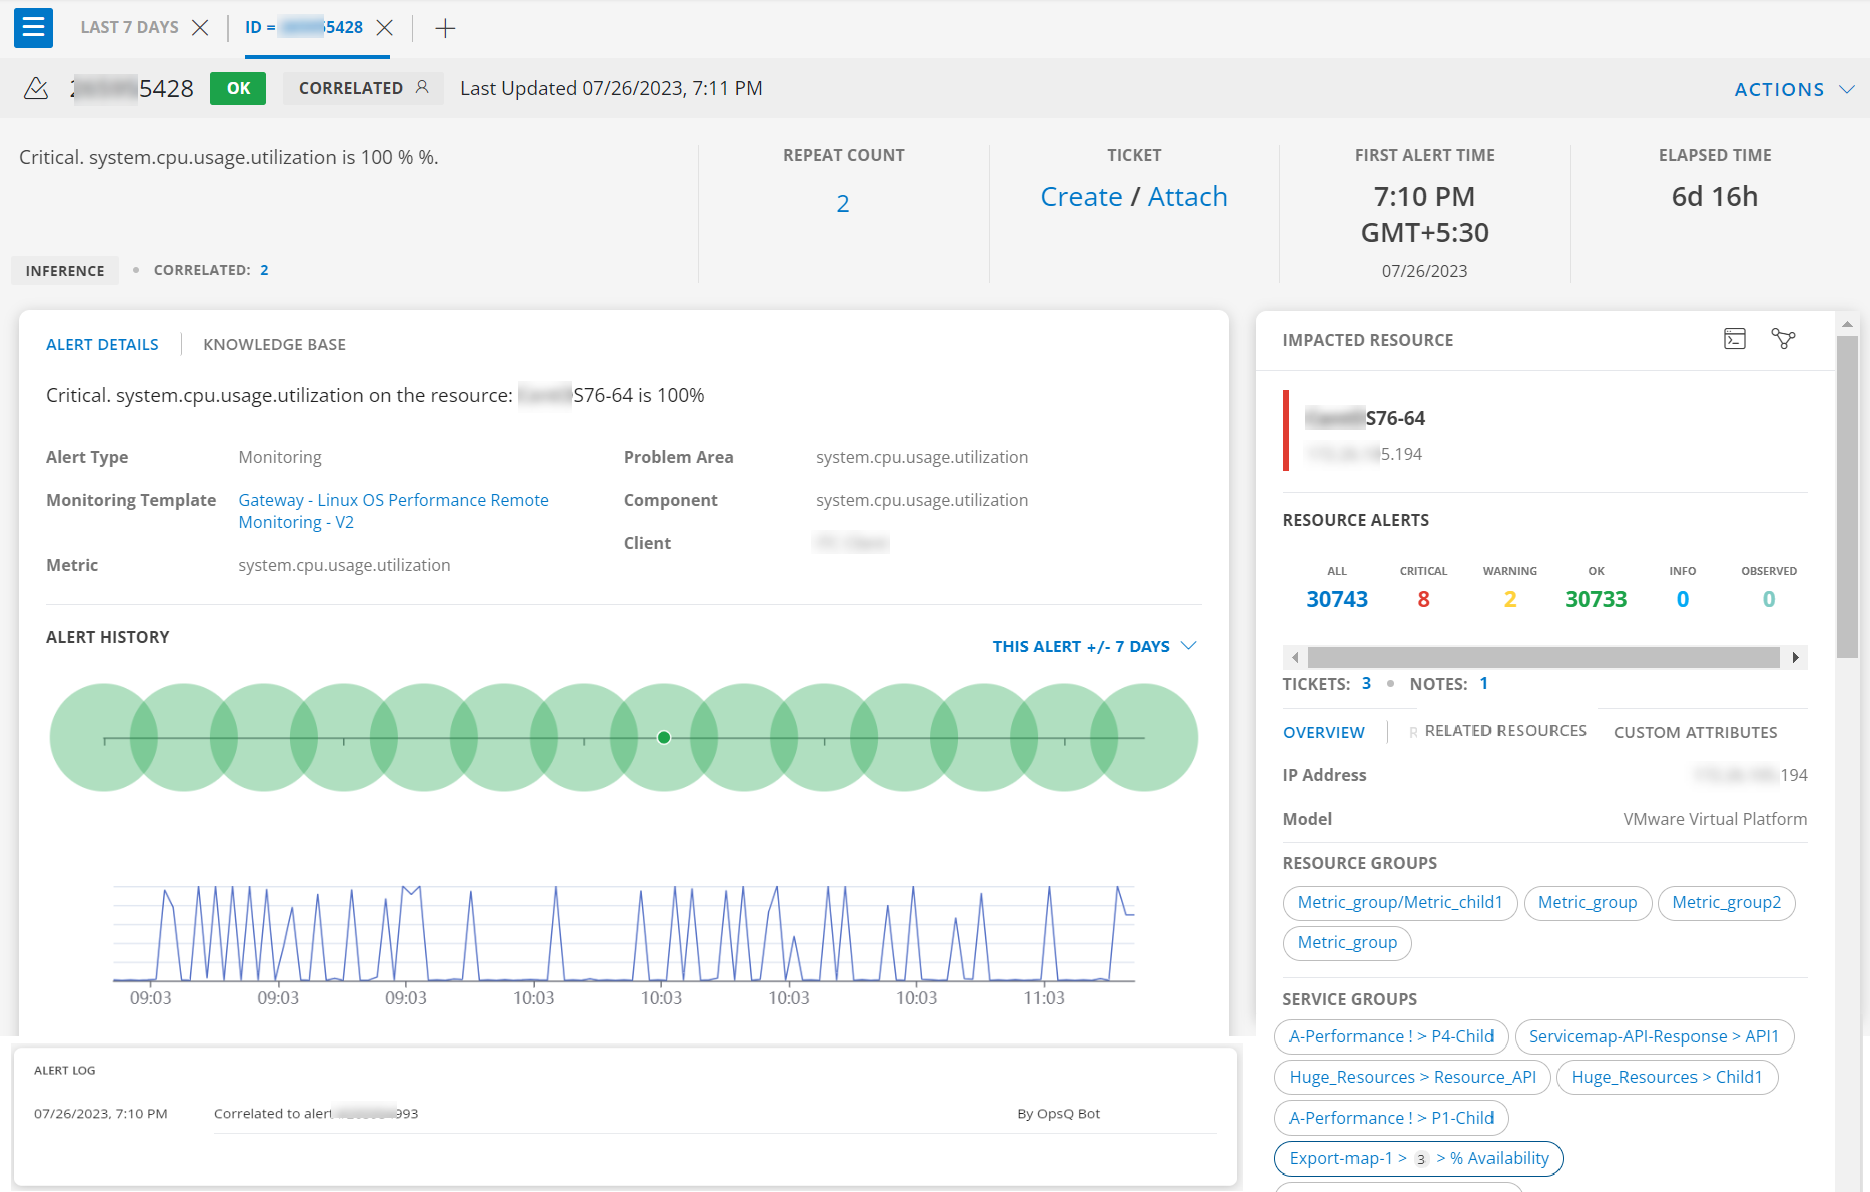
Alerts Details Page
The Alerts Details page provides a comprehensive view of each alert and allows you to:
- View alert information
- Perform actions such as create/attach incidents, view history, and resource alerts
To access:
- Click Command Center > Alerts.
- Click the Alert ID. The slide-out appears.
- Click View details.
Details and Actions:
| Information | Action/Description |
|---|---|
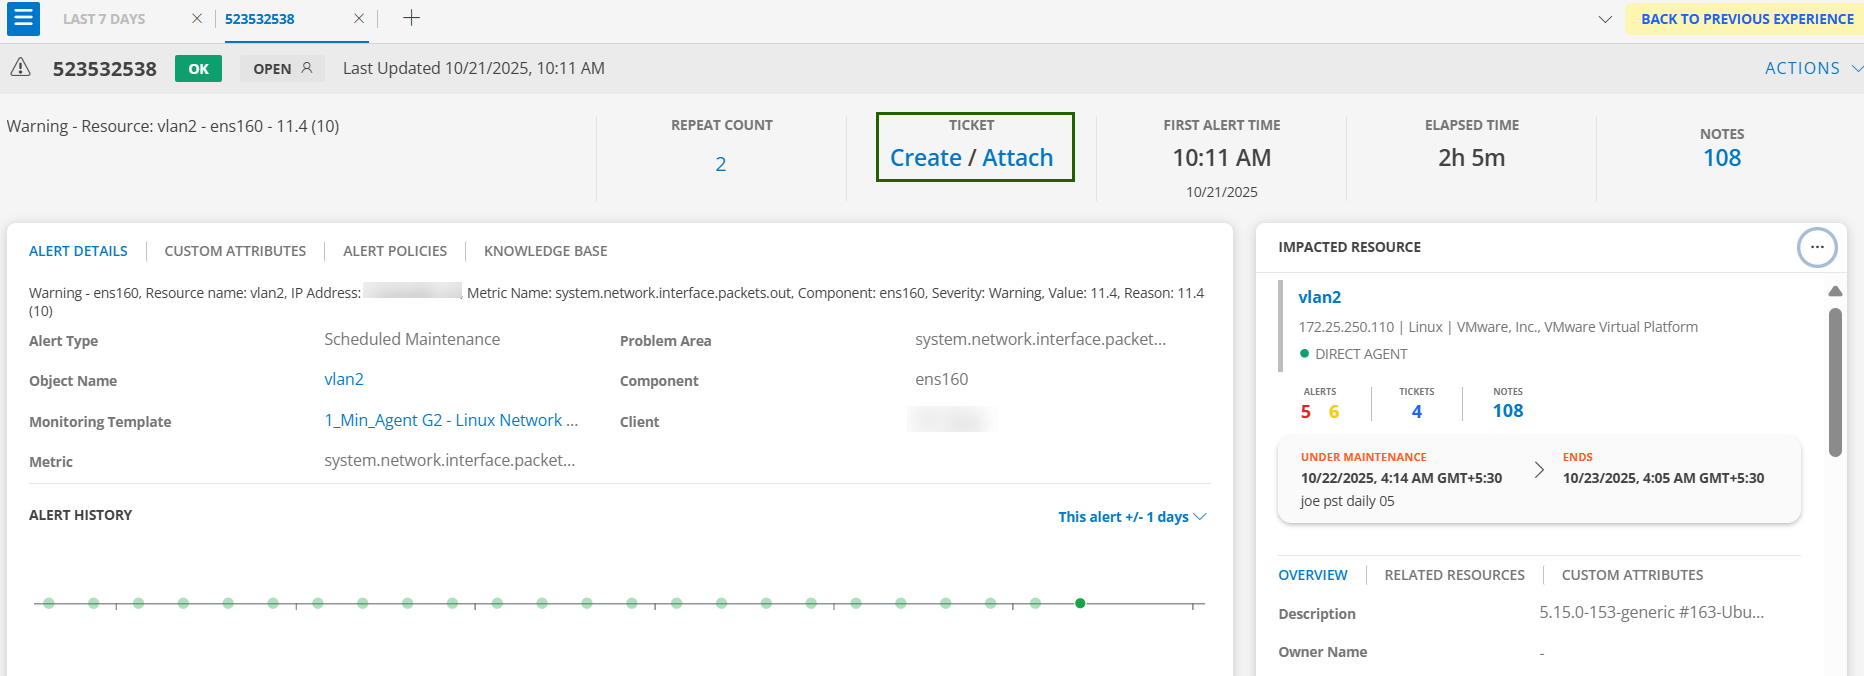
| Repeat Count | Number of duplicate alerts. Click to view details. |
| Ticket - Create or Attach | Create or attach an incident to the alert. |
| First Alert Time | Time when the first alert was generated. |
| Elapsed Time | Time since the first alert was generated. |
| Inference | Opens the inference alerts listing page. |
| Correlated | Opens the correlated alerts listing page. |
| Alert History | Shows alert occurrence over time, with options to change the time period and view logs. |
| Knowledge Base | View related KB articles. |
| Actions | Perform actions such as escalation, acknowledge, suppress, create/update incident, run process, heal, or close the alert. |
| Remote consoles and Run Command icons | Launch troubleshooting tools directly from the page. |
| Topology icon | Navigate to the topology map of connected devices. |
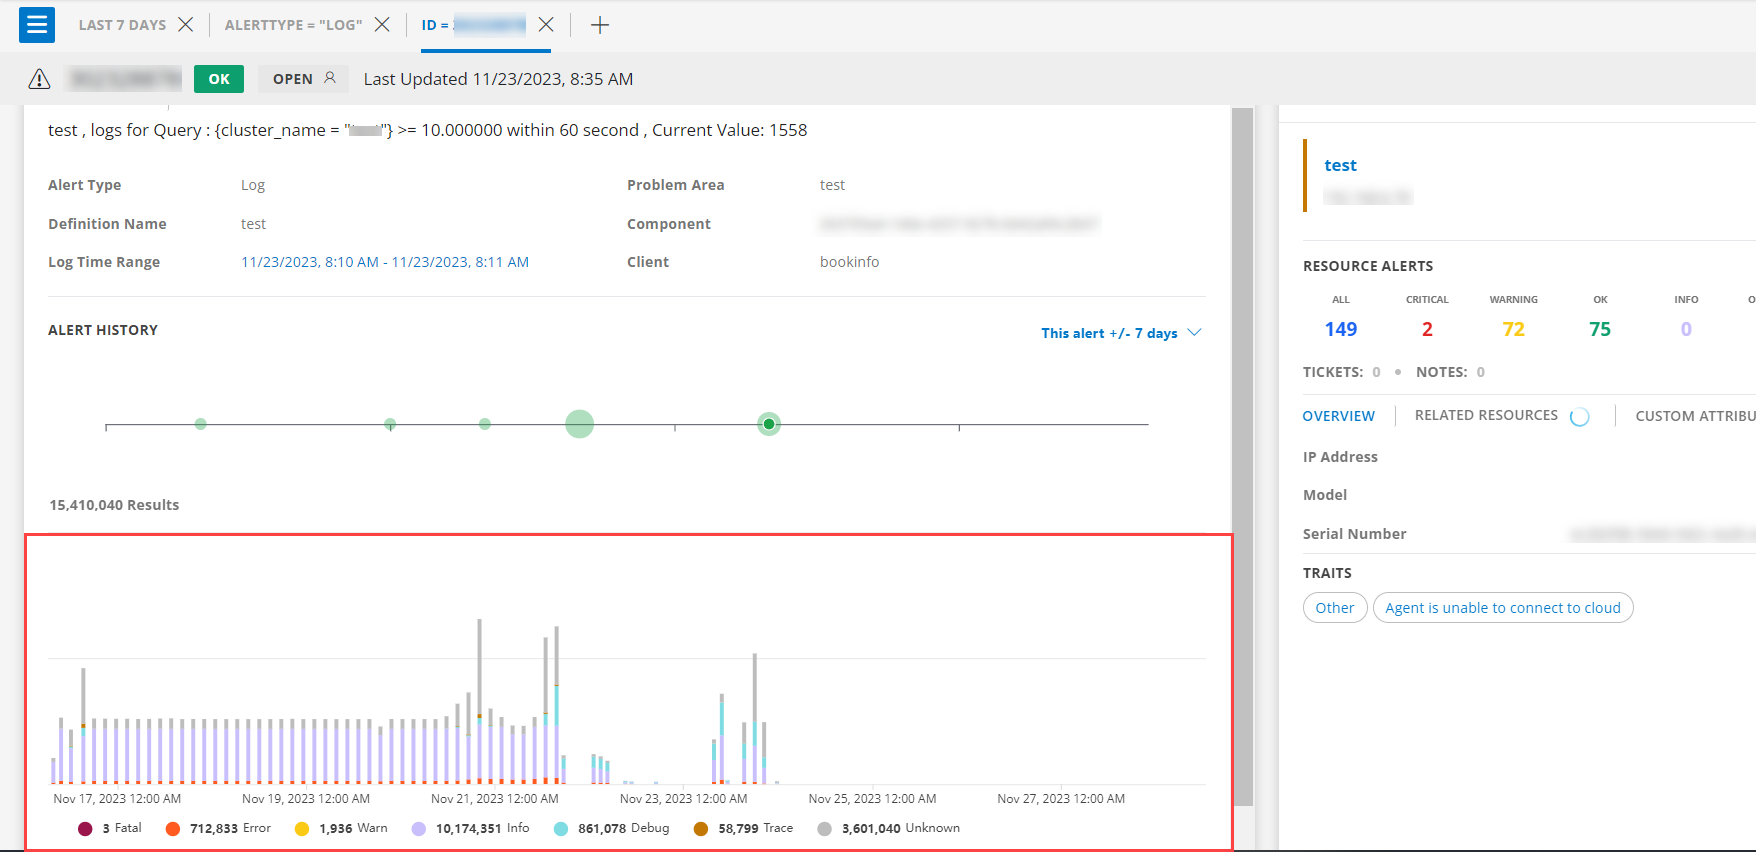
Examples
Log Alert Visualization
Displays log alerts and their inputs. The log time range is shown and links to the logs page.
Filter: alertType = LOG
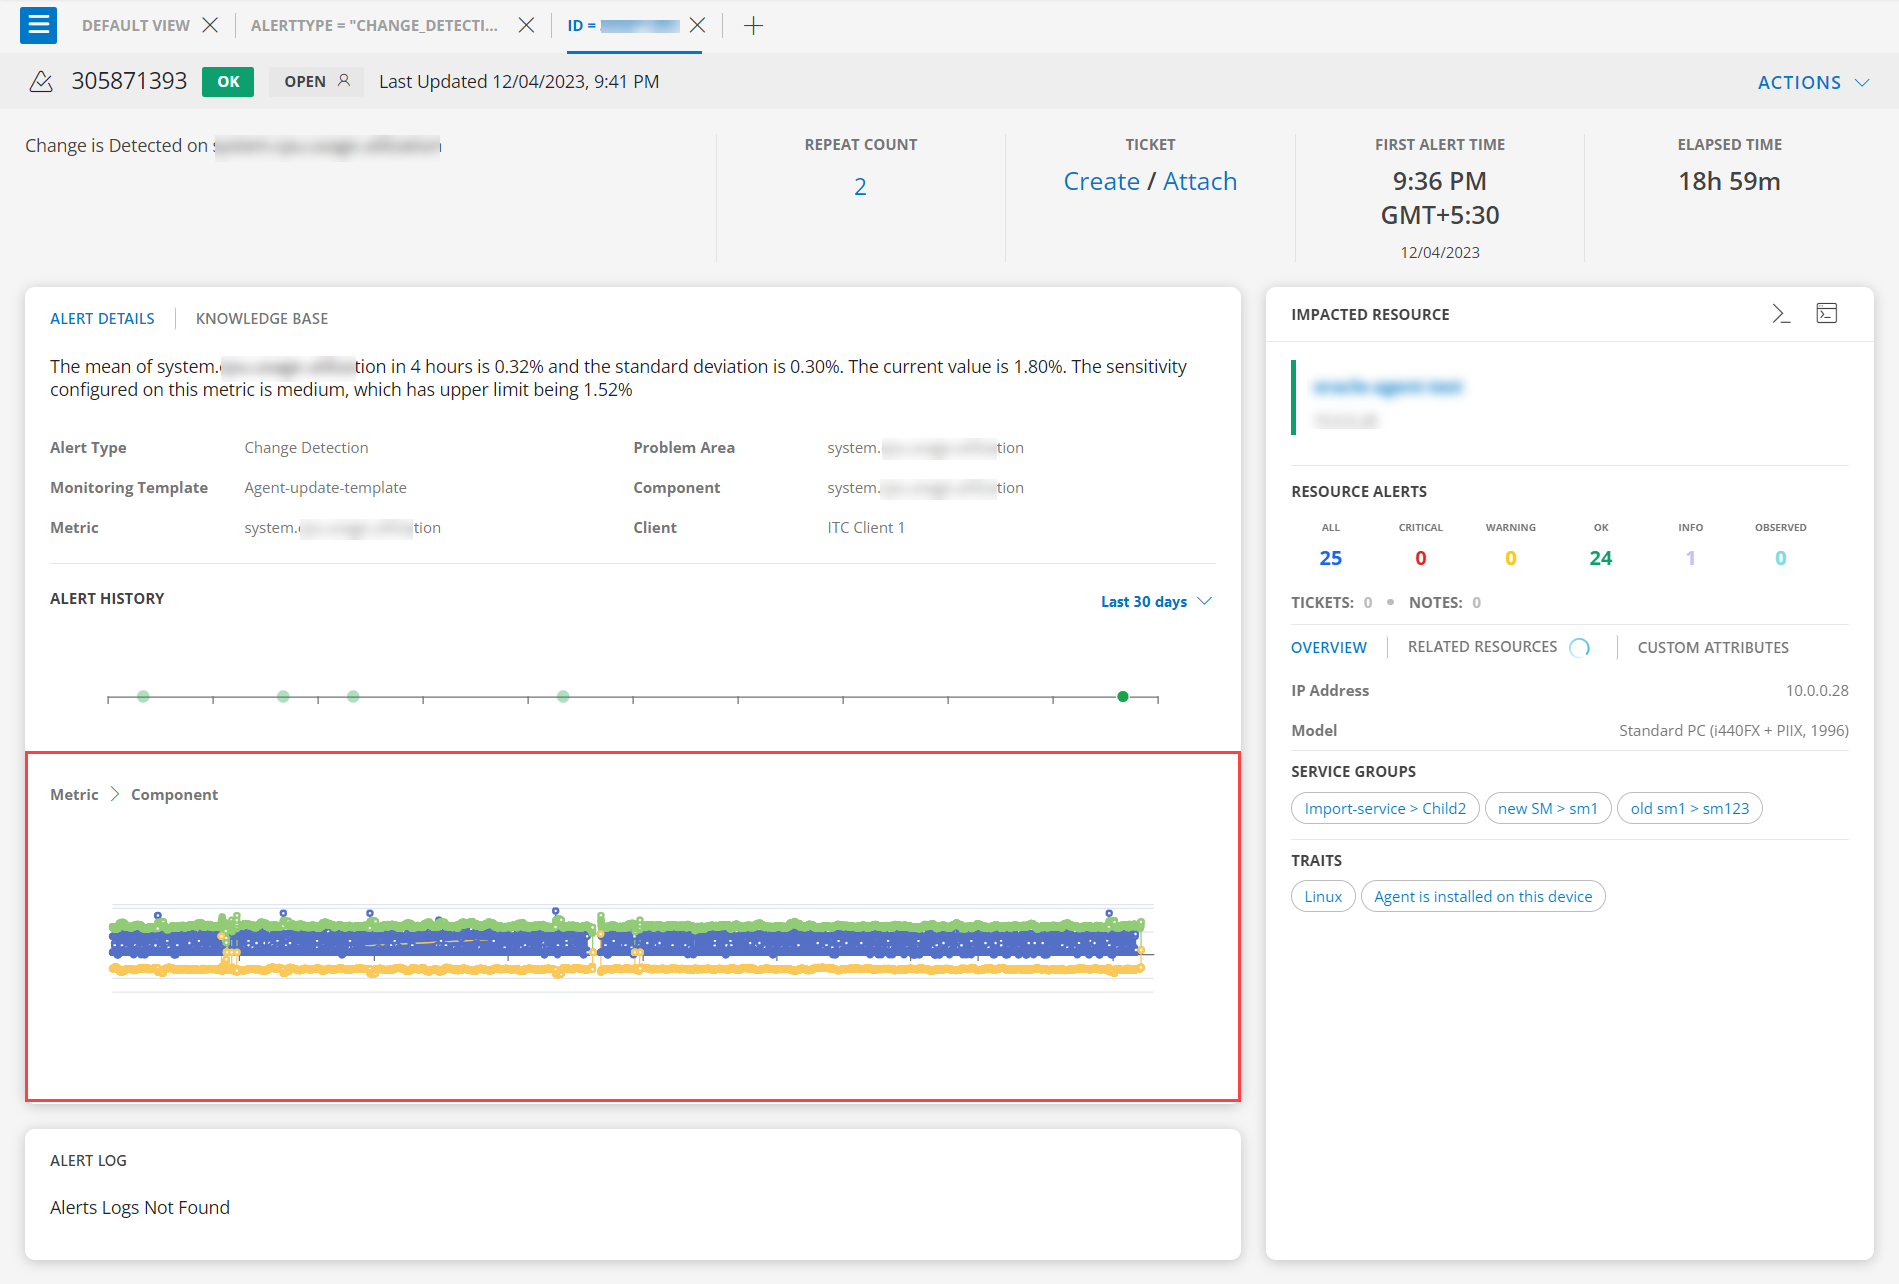
Change Detection Alert Visualization
Shows alert definition or template name for lower, upper, and average values. Clicking Definitions redirects to the Alerts page.
Filter: alertType = Change_Detection
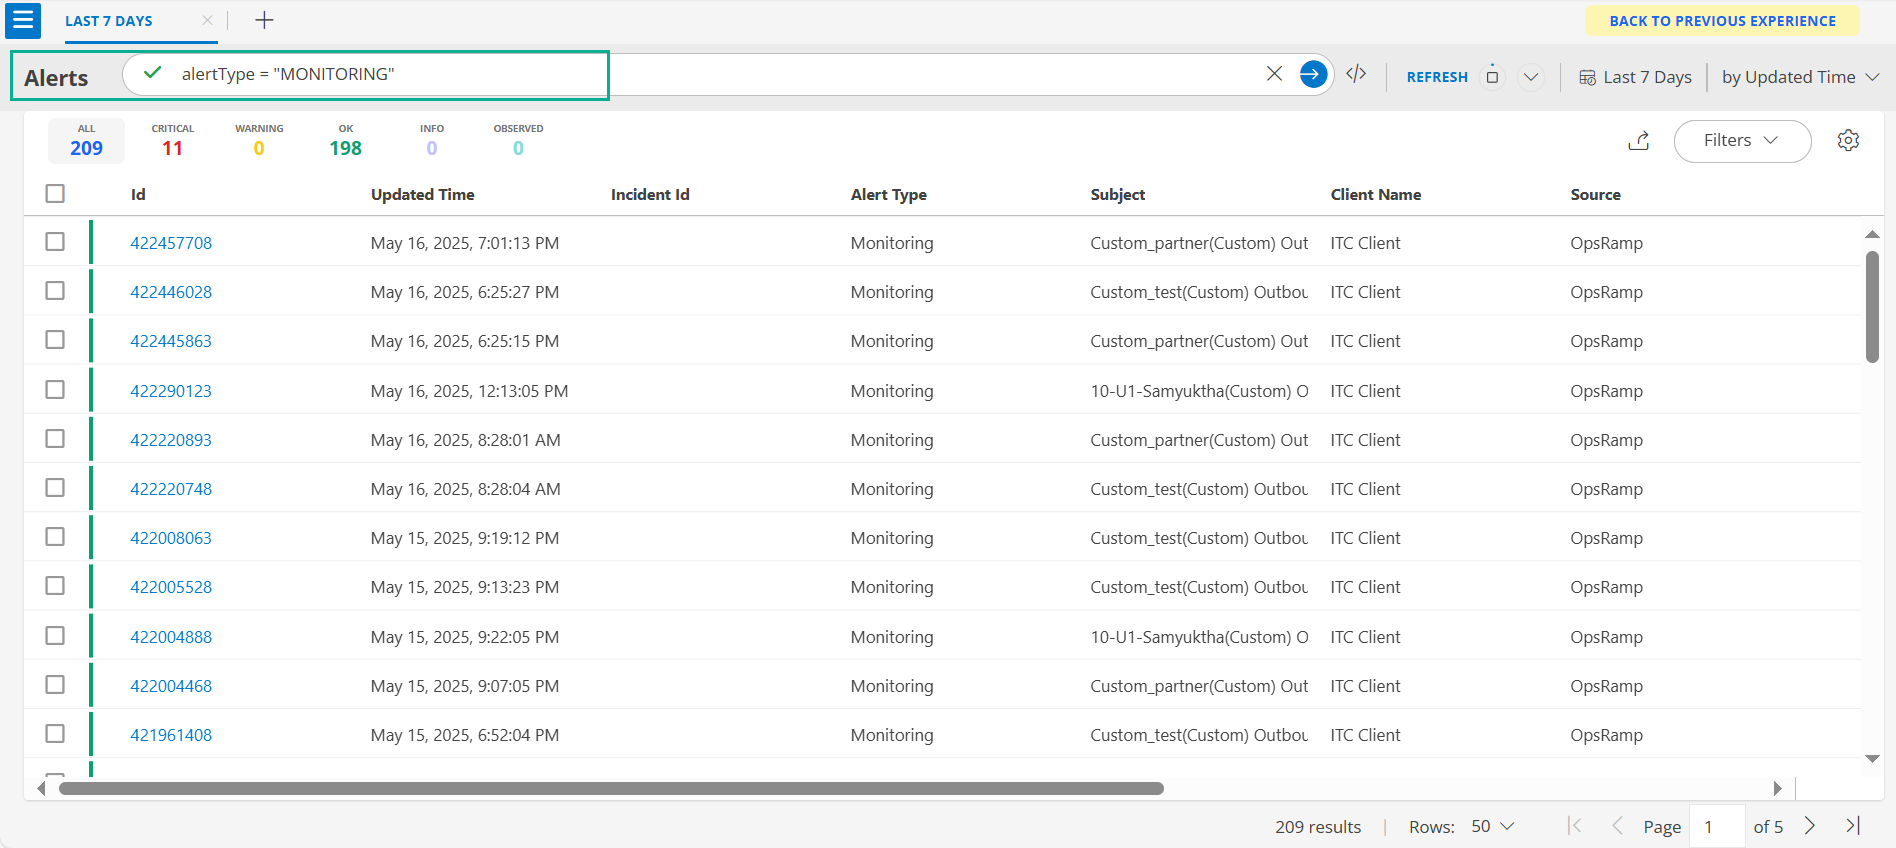
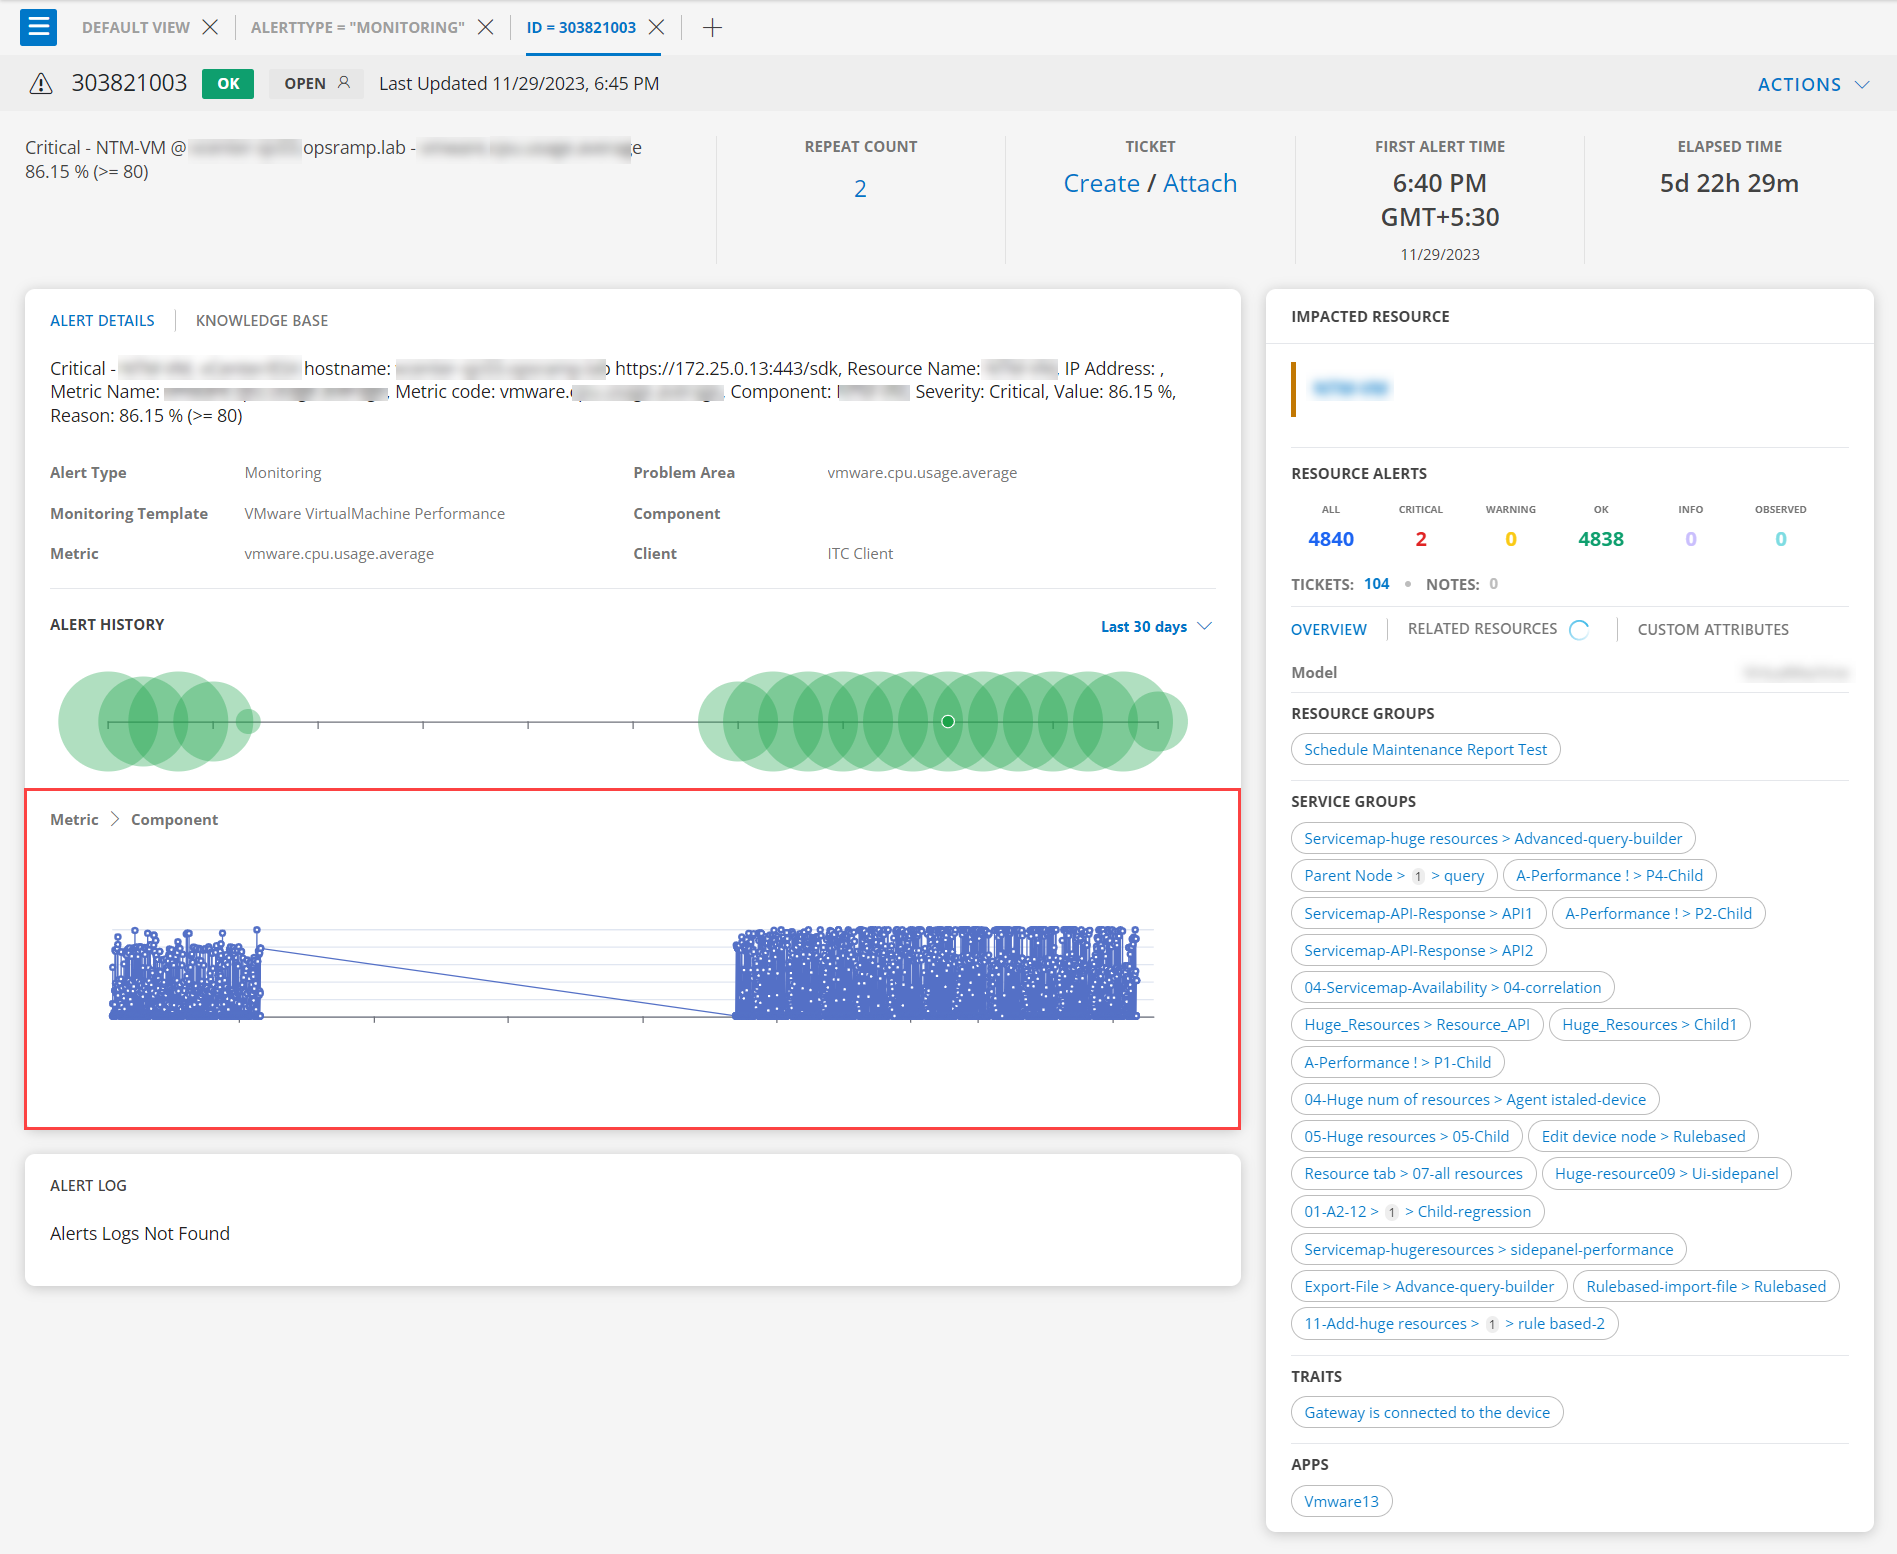
Monitoring Alerts Visualization
Displays alert definition or monitoring template name. Alerts from Alert Definition use PromQL.
Filter: alertType = Monitoring
Integration Alerts Visualization
For integration object types, only integration data is shown.
Filter: Object Type = Integration
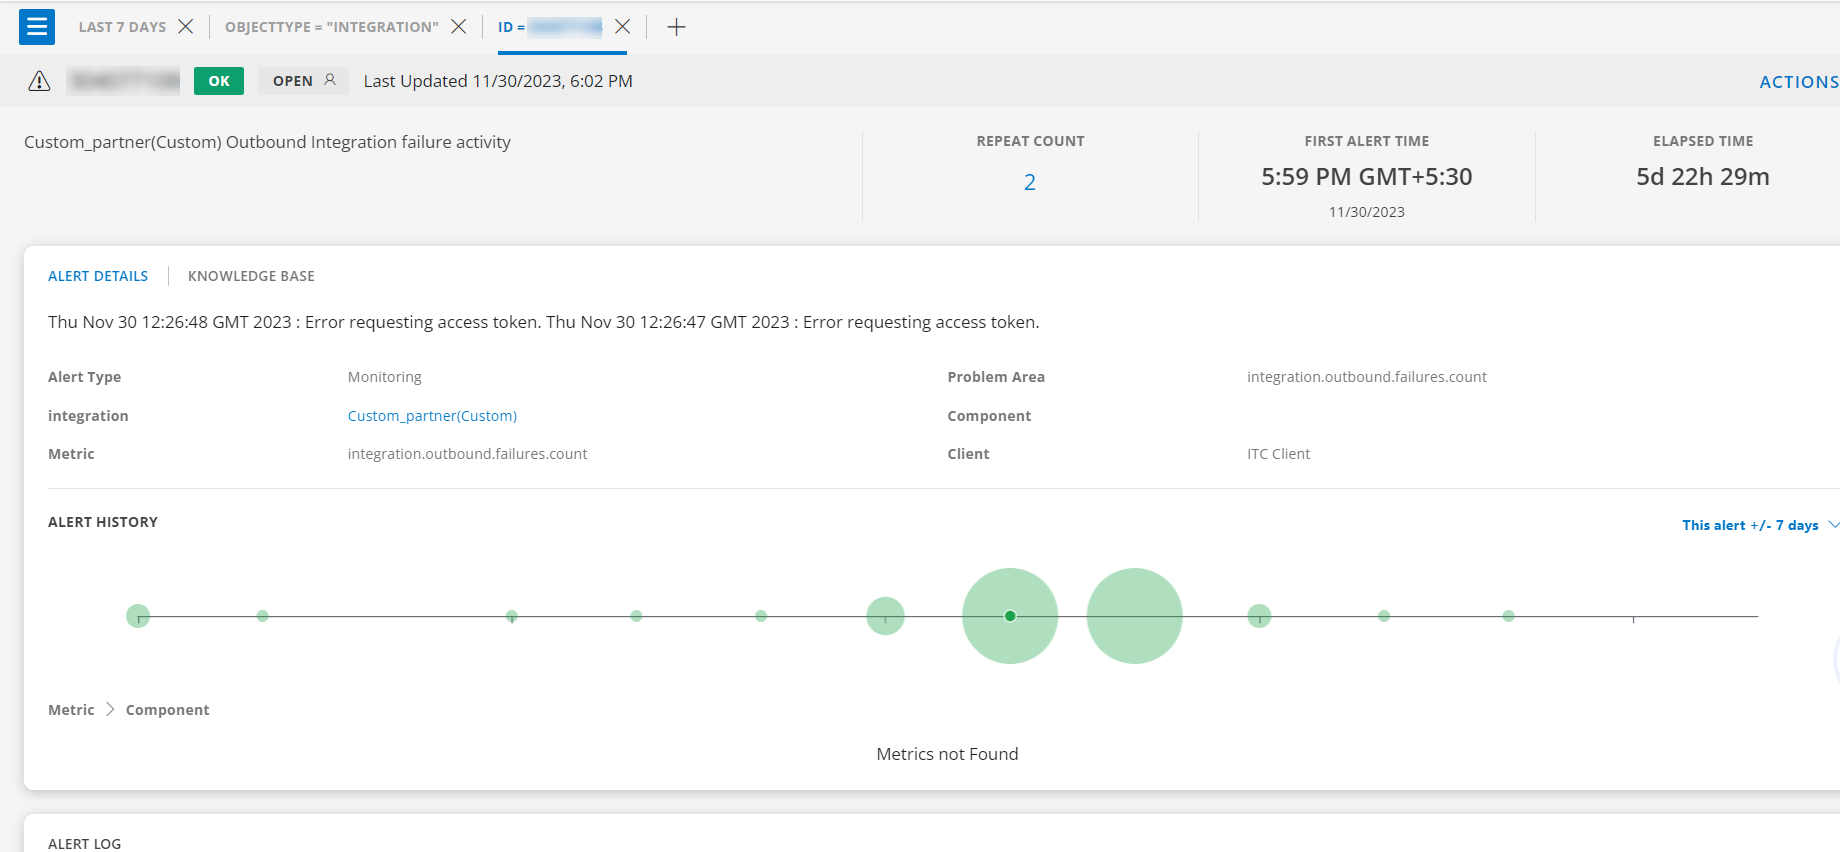
Note
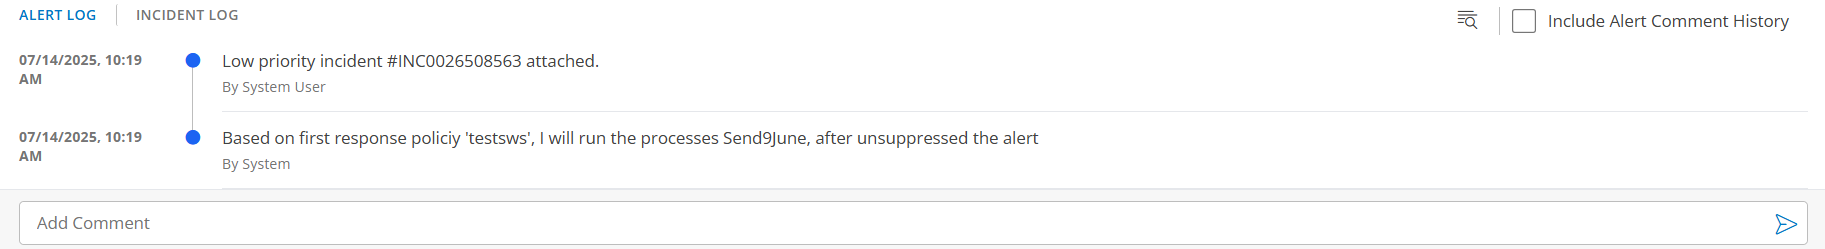
This is a feature-flag based functionality. Contact OpsRamp Support for more information.View Historical Alert Comments
Enable the Include Alert Comment History checkbox on the alert details page to view previous comments for alerts that have reappeared on the same Host, Metric, and Component. You can also use the Search icon in the to quickly find specific comments.
Use Case:
Quickly access historical comments for recurring alerts to understand past troubleshooting actions.
To enable:
- Select an alert to view details.
- Scroll to the Alert Log section.
- Select Include Alert Comment History.
Up to the last 200 comments from historical alerts are displayed.
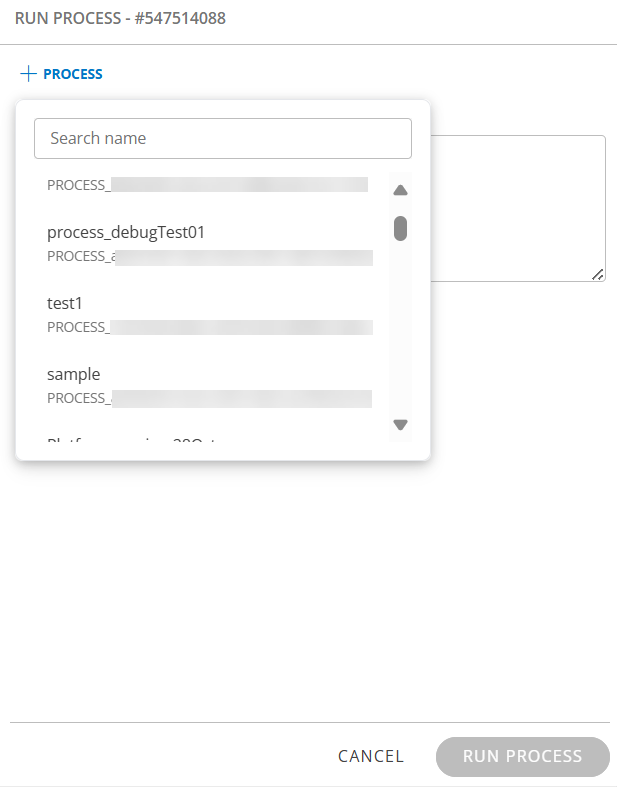
Run Process
he Run Process action in the Alert Browser now supports multiple executions for the same alert, giving users enhanced flexibility in automation and remediation workflows.
Users can now:
- Select a process definition with custom inputs from the available list and update those input values before execution.
- Choose up to 10 process definitions when using the Run Process option.
- Proceed without mandatory comments, as the Comments field is now optional.
- Trigger the same process multiple times, provided that:
- There is a minimum 5-minute gap between the last execution and the next, or
- The process definition has been updated after the last execution.