A monitoring template defines all parameters that you can set to monitor your target resource.
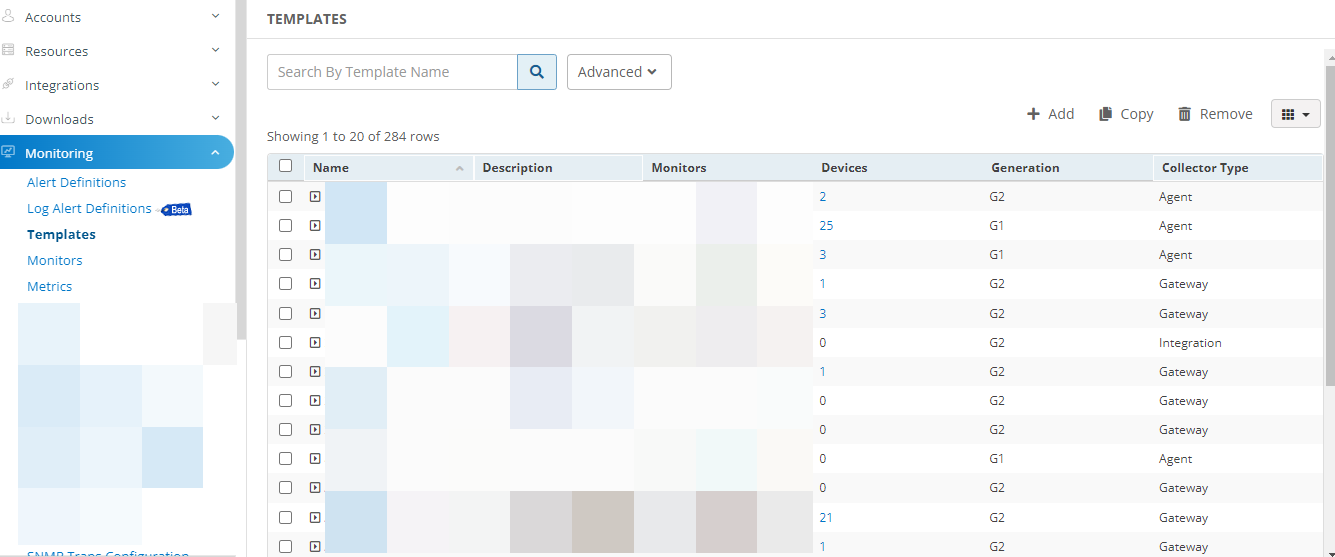
- You can create and manage a monitoring template from the TEMPLATES LIST screen.
- You can create, edit, and apply these templates across one or more resources or resource groups.
Prerequisites
- The metrics and monitors should be created before creating a template.
Create a template
To create a template:
Go to Setup > Monitoring.
Under Monitoring, click Templates. The TEMPLATES listing page is displayed.

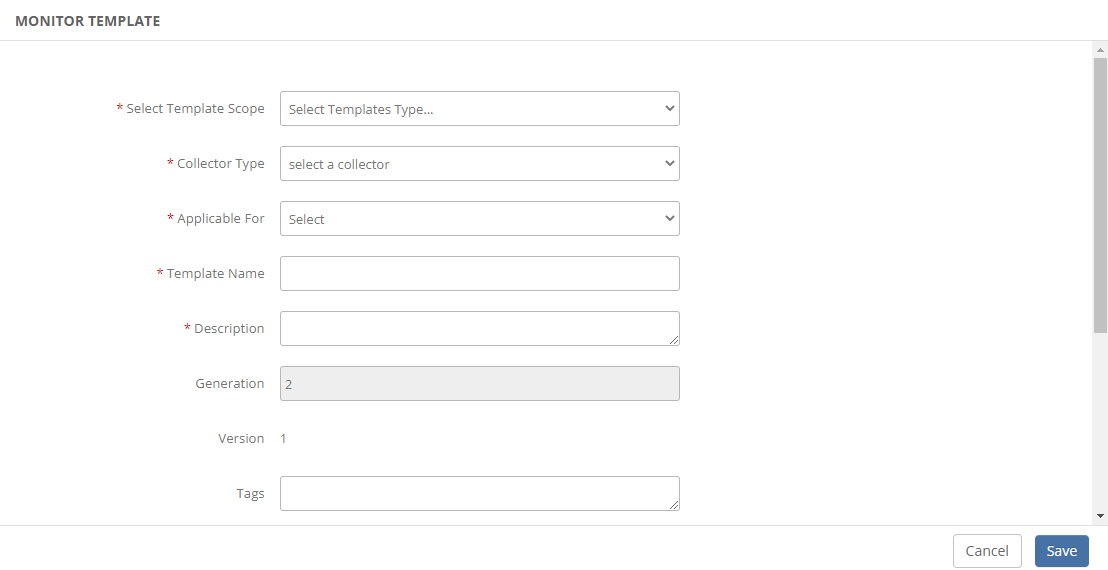
Click +Add. The MONITOR TEMPLATE page is displayed.

Configure the following parameters from the MONITOR TEMPLATE page:
| Parameter | Operation |
|---|---|
| Select Template Scope | Partner Template or Client Specific Template. For a Client-Specific Template, select the Client also. |
| Collector Type | The Collector through which you want to gather the information. For example: Agent, gateway. |
| Monitor Type | Monitor for G2 Templates. |
| Applicable for | The resource type of the template. |
| Template Name | Name of the template. For example, G2 MSSQL Database Transactions Time Template. |
| Description | The summary of the template. |
| Generation | Generation that the template belongs to. For example, Generation 2. |
| Version | Global templates may exist with different versions. SP/Partner/Client templates have only one version: Version 1. |
| Prerequisites | The required details are considered while monitoring using the template. For example, check the SQL services while monitoring the SQL Parameters using the Windows templates. |
| Status | The Active or End-of-life templates. |
| Notes | The information that you want to add to the template. |
| Template Family Name | The category that applies to the application. For example, Windows Server, Storage Server, and Network Server. |
| Deployment Type | The methods available to apply the template to the resources:
After providing the template details, MONITOR TEMPLATE displays the Monitors section. The MONITOR TEMPLATE screen varies with the option selected in the Collector Type field. |
| Monitor | Enter the monitor details. |
Add a monitor
Add monitor details on MONITOR TEMPLATE page:
From the Monitors section, click + Add.
Note: Duplicate metrics cannot be added in G2 templates.
From the Monitor window, enter the following details:
- Frequency: The frequency to execute the template.
- Monitor Definition: Monitor type.
- When to Alert: There are three options:
- Breach of a Threshold (default):
- Enter Warning and Critical threshold values.
- Select Alert and Availability to initiate monitoring.
- Significant Change is Seen: Add values, as required.
- Forecast of a Breach of a Threshold: Add values, as required.
- Breach of a Threshold (default):
Click Add. After adding the monitor, you can edit the metric values to add Component Filter, Component Threshold and Knowledge Articles. You can also edit each metric for the monitor.
Note
When adding monitors to a template, ensure that only monitors of the same type are included. It is not recommended to mix different types of monitors within a single template.
For example, You can add multiple SNMP monitors to an SNMP template. However, it is not recommended to add SNMP and VMware monitors to the same template.