Using Remote Script Executor (RSE), you can execute scripts on both Linux and Windows workstations with different script types.
User-defined external arguments support the script through custom attributes.
Monitor Level script execution – Ability to pull more metrics in a single script execution.
Ability to execute different types of scripts through custom script options apart from default options.
Able to use Credentials attached to the device in the script using the dynamic macro support.
Prerequisite
Gateway version 7.0.0.
End device’s SSH Credentials must be assigned on End device itself, not on the Gateway device.
Gateway-based Custom Monitors development
Gateway has following 2 different adapter frameworks to develop custom monitors:
Remote Shell - With this adapter framework, you need to build separate scripts for each metric - NOT RECOMMENDED as it is less efficient (if metrics count is high it will consume more system resources like number of processes, cpu, etc. on end device).
PowerShell - With this adapter framework, building separate scripts for each metric is NOT RECOMMENDED as it is less efficient. If the number of metrics is high, it can consume more system resources, such as processes and CPU, on the end device.
Remote Script Executor (RSE) - With this adapter framework, you can build a single script for 1 or more metrics - RECOMMENDED
How to develop a RSE script:
Follow the same step-by-step script development process explained in the above agent generation 2 section. The only per-requisite is SSH credentials should be assigned / attached against the target device in OpsRamp platform. So that gateway can establish SSH connection to the target device and it can execute RSE script on target device and get JSON output back to gateway.
See here for Gateway RSE Supported scripting languages:
NOTE: You will see Bash / PowerShell / Python at monitor creation page, but for other languages, you have to select Custom script type.
How to invoke a script in remote machine ?
You can also invoke a script that resides on the remote machine. You just have to mention the Absolute file path in the script block (in monitor creation page).
It was only tested for shell scripts.
Create a Metric
Follow step-by-step metric creation process explained in the above agent generation 2 section.
Create a Monitor
Follow step-by-step monitor creation process explained in the above agent generation 2 section.
Create Template
Follow step-by-step template creation process explained in the above agent generation 2 section, but the only change is select Gateway as collector type instead of Agent.
Assign Template
Follow step-by-step template assign process explained in the above agent generation 2 section, but the only change is select Gateway as collector type instead of Agent.
Create Metrics
Metrics enter the metadata to correlate the script output and must match the metrics names added to the Monitor.
Select a client from the All Clients list.
Go to Setup > Monitoring > Metrics.
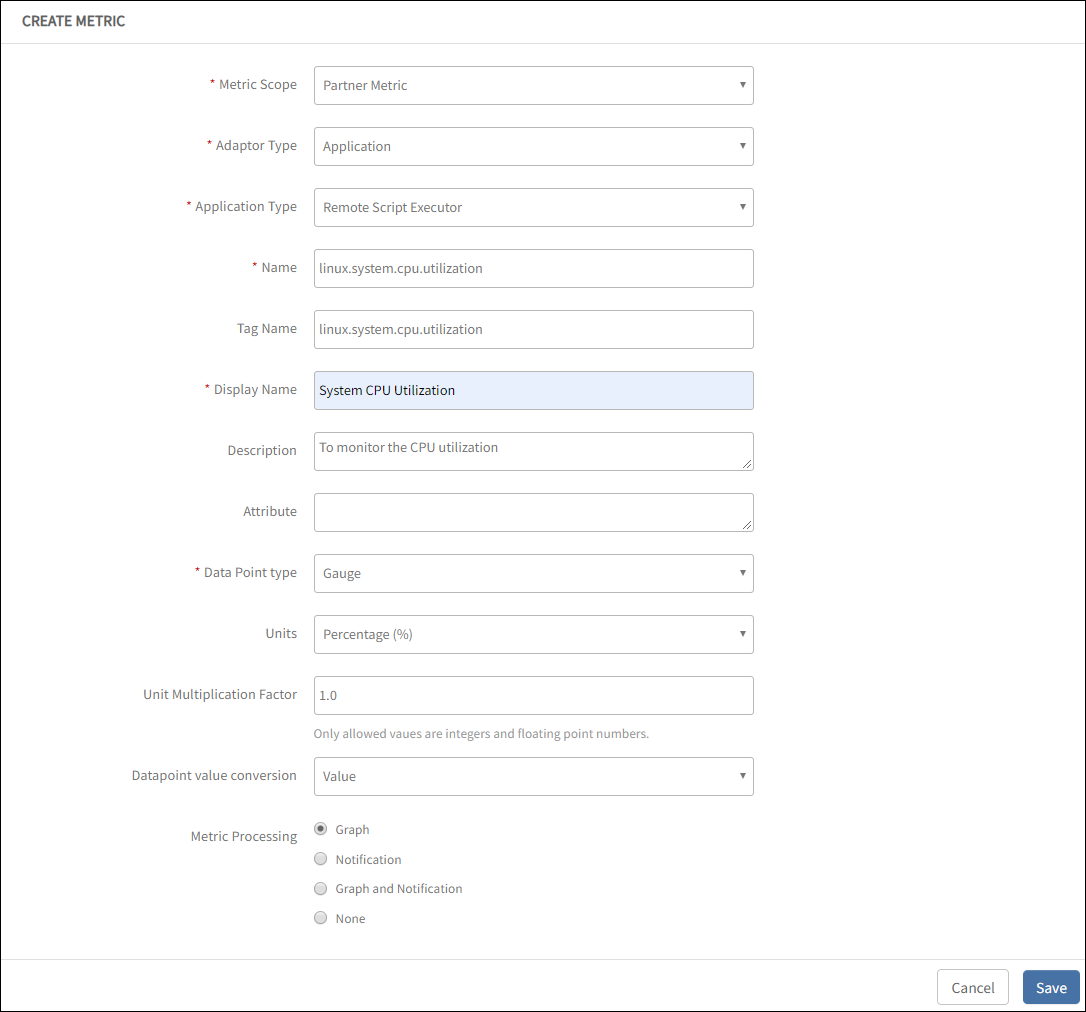
From METRICS, click + Add and enter:
Metric Scope: Select Partner Metric or Client Specific Metric.
Adaptor Type: Select Application.
Application Type: Select Remote Script Executor.
Name: Unique Name for the metric. The recommended metric naming convention is <vendorname>_<application name>_<component>_<metric> . For example, apache_tomcat_webapps_count_
Tag Name: User-defined tags for better filtering.
Display Name: Enter Display Name. For example, System Drive Free Space.
Description: Enter the reason for the metric.
Data Point type: Value chosen to plot data in the graph.
Units: Required values for Units. You can choose Units depending on the chosen Data Point Type.
Unit Multiplication Factor: Value chosen to multiply a value based on the chosen unit.
Data Point Conversion: One of the following options:
Value: To populate data using values.
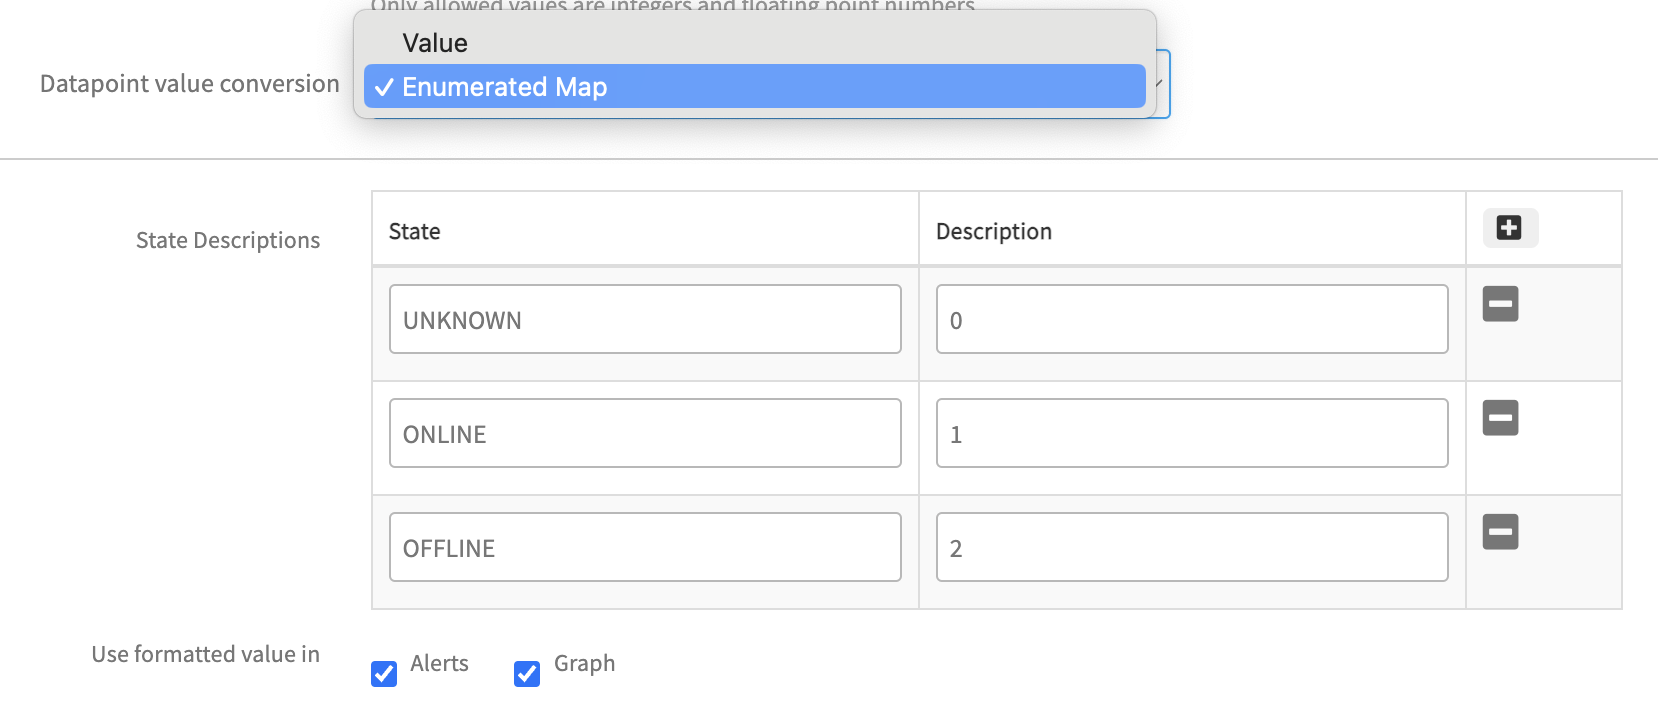
Enumerated Map: To populate alert and graph details after adding the states such as Up or Down. The screen displays an more section where you can add the state descriptions and select Alerts and Graphs to populate data.
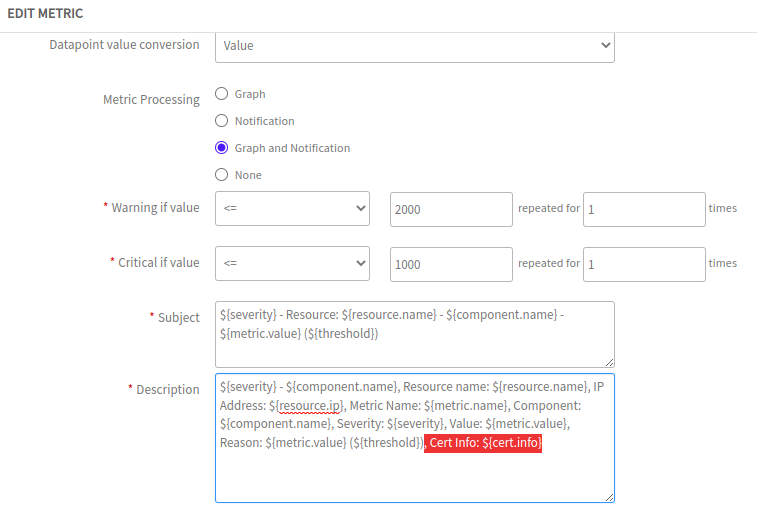
Metric Processing: One of the following values for processing the Metric:
Graph
Notification
Graph and Notification
None
Graph Choose this option when user only needs a Graph for the metric without an alert.
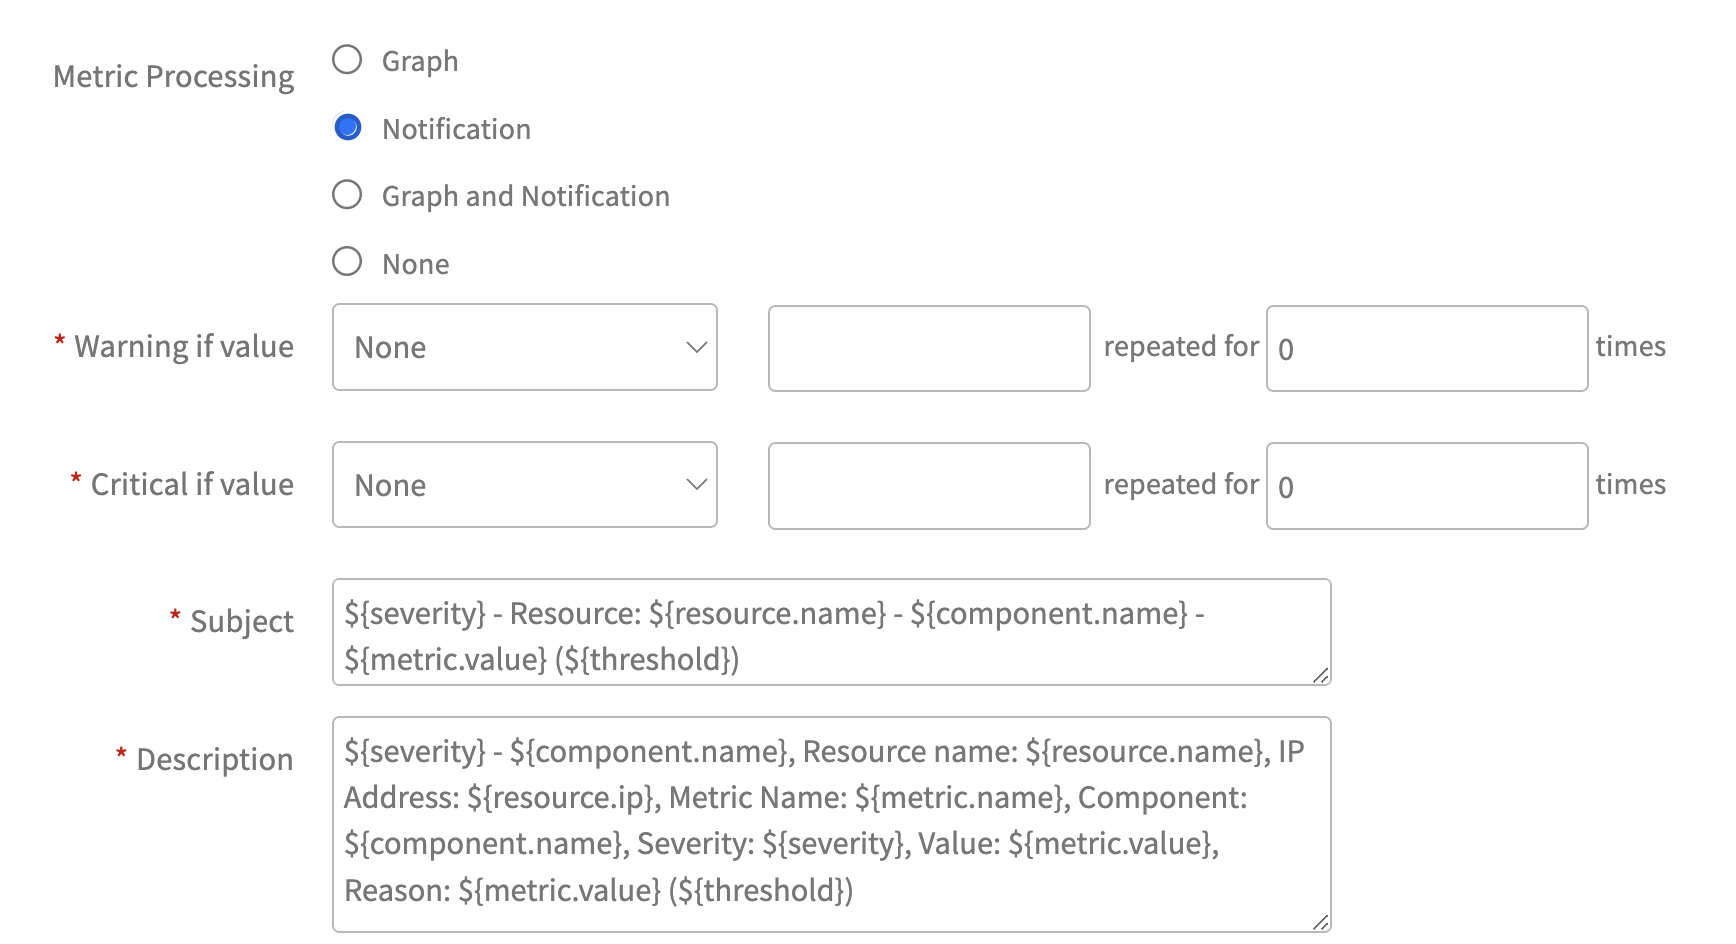
Notification Choose this option when user only needs an Alert for the metric without a graph. When selecting this option, a dynamic UI will appear to configure alert thresholds, as shown in the screenshot below:
Configuring Alert Thresholds:
When setting up notifications, the following options are available for configuring alert thresholds:
Case 1: Enumerated Map
If "Datapoint Value Conversion" is set to "Enumerated Map," users need to specify the oState column values for Warning and Critical thresholds.
Warning Threshold: State [Specify State column Value]
Critical Threshold: State [Specify State column Value]
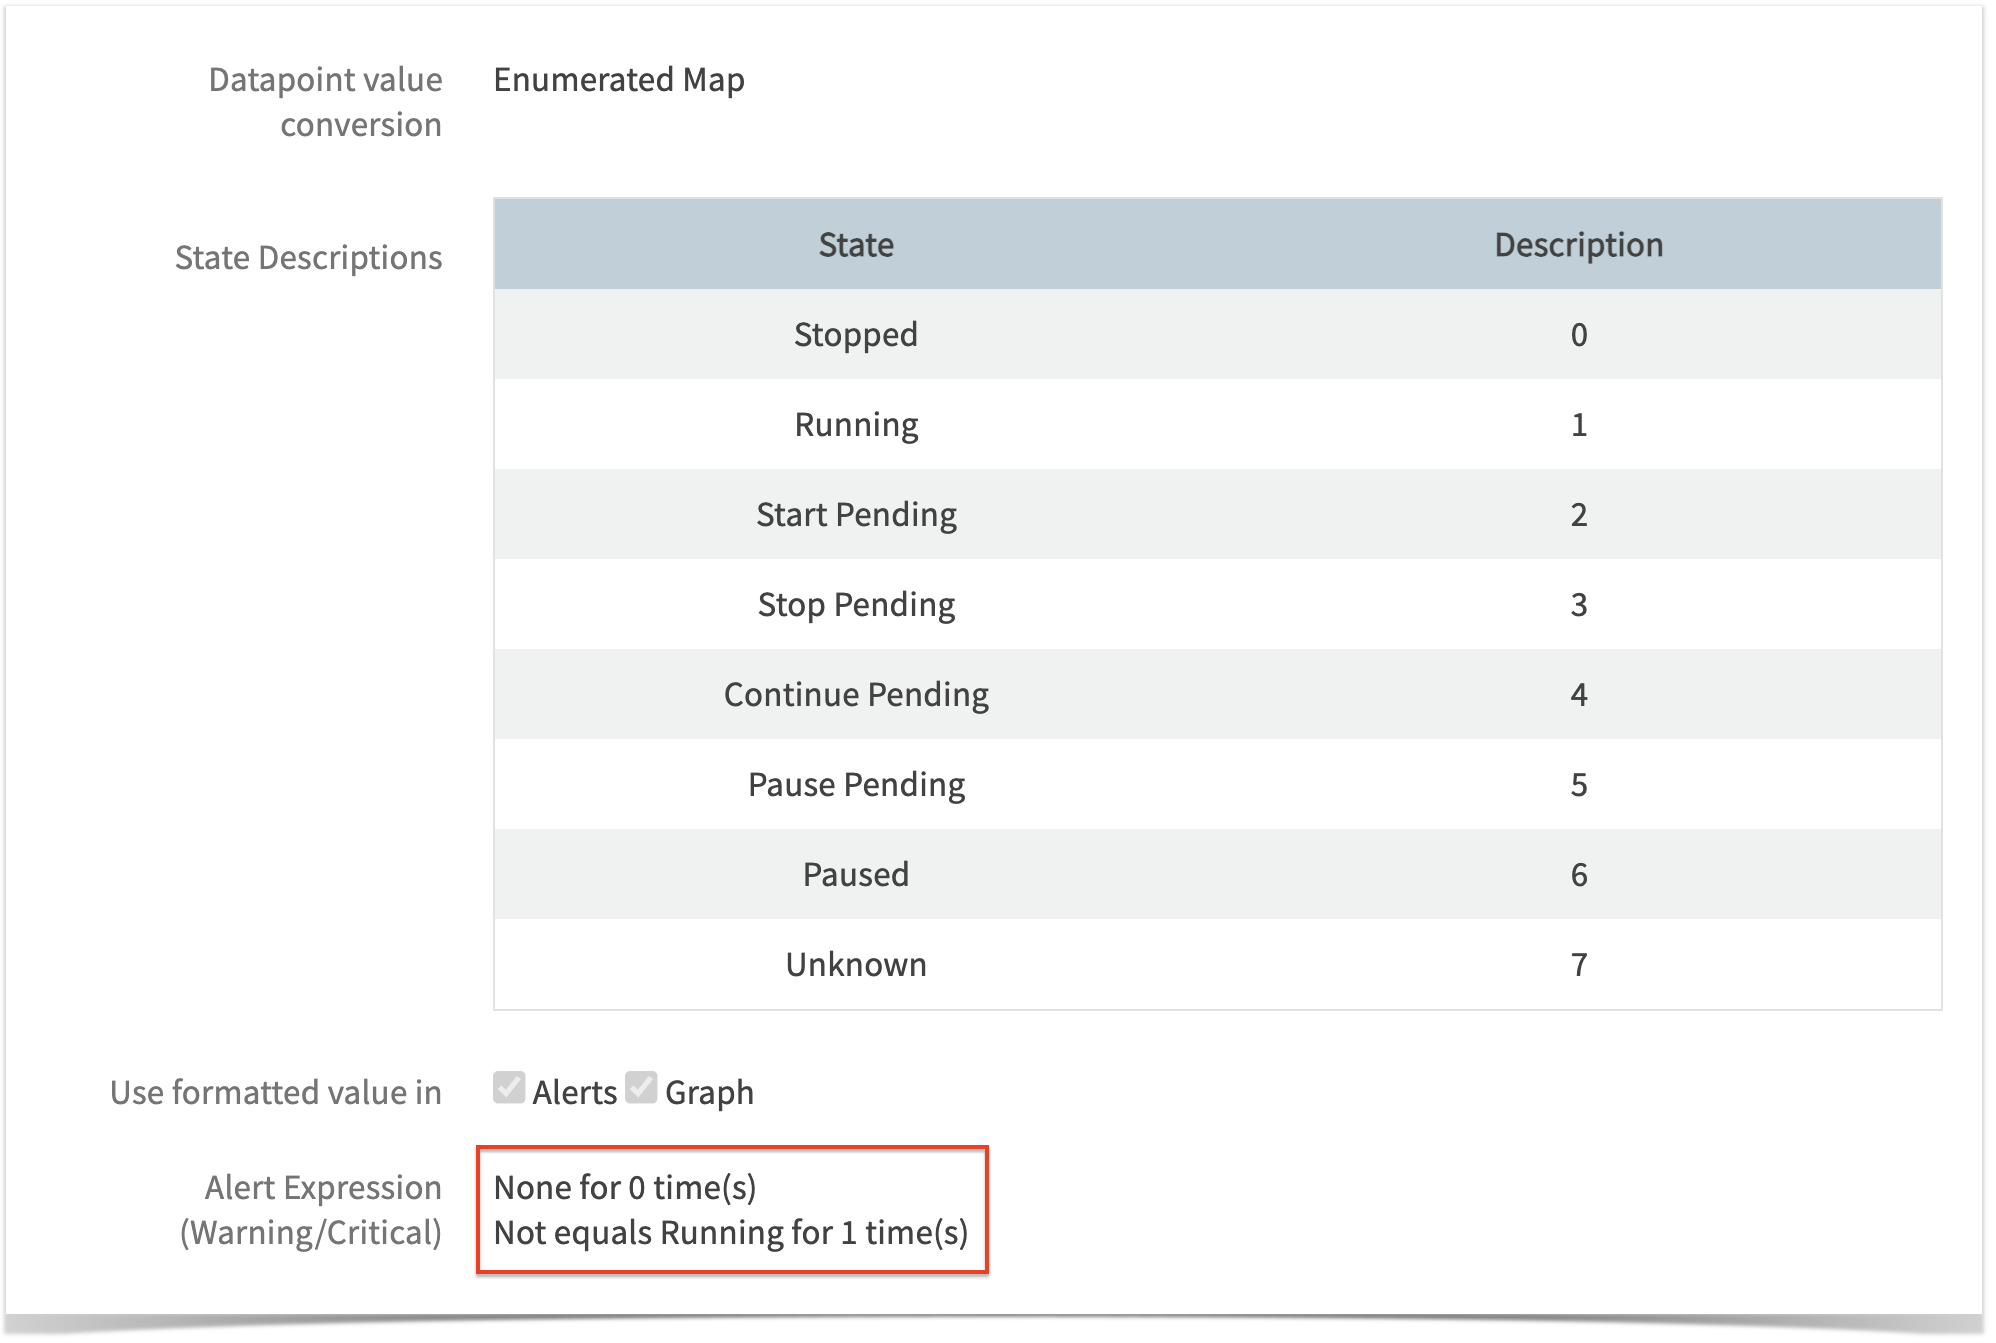
Setting Alert thresholds for Enumerated Map conversion from strings to integers:
Setting Alert thresholds for Enumerated Map conversion from integers to strings:
Case 2: Value
If "Datapoint Value Conversion" is set to "Value" (the default setting), users need to specify the metric values for Warning and Critical thresholds.
Warning Threshold: Value [Specify Warning-level Threshold Value for the metric]
Critical Threshold: Value [Specify Critical-level Threshold Value for the metric]
Additional Fields:
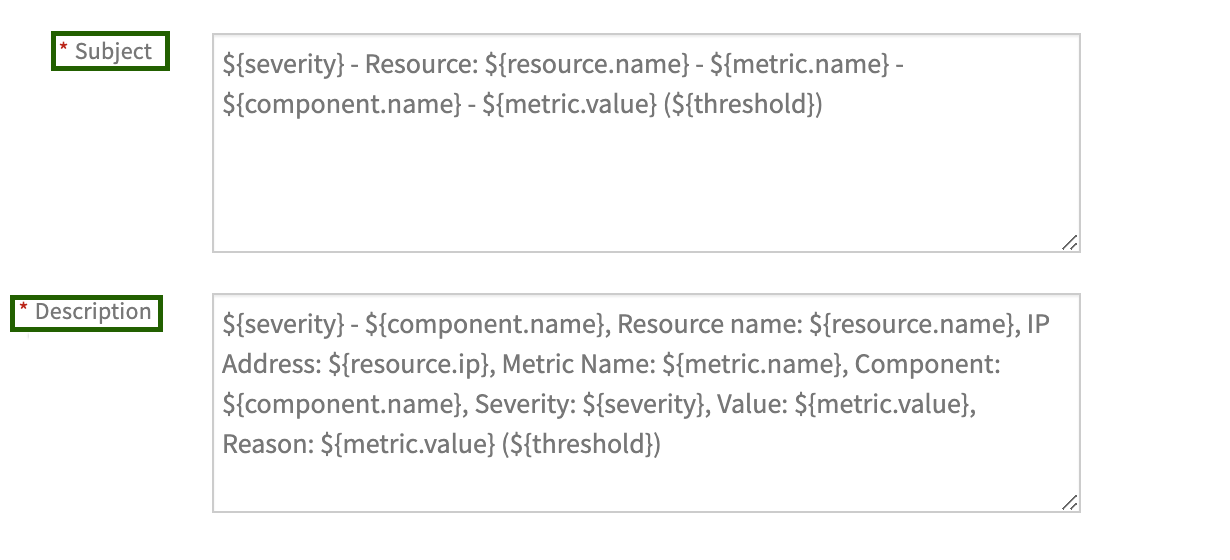
Subject: The metric subject is populated by default but can be customized.
Description: The metric description is populated by default but can be customized.
3. Graph and Notification:
Choose this option when user needs both Alert and Graph for the metric.
When selecting this option, a dynamic UI will appear to configure alert thresholds, as shown in the screenshot below:
Configuring Alert Thresholds: The alert threshold configuration options are the same as the Notification option.
4. None: Select this option when both alert and graph are not needed for the metric.
Click Save.
Create Monitor
Custom Remote Script Executor Monitor is a collection of Remote Script Executor metrics. You can create a template using the Remote Script Executor monitor.
When adding a metric to the monitor, ensure that the exact metric name used in the script is applied.
Prerequisite: Add the required custom parameters.
From All Clients, select a client.
Go to Setup > Monitoring > Monitors.
From Monitors, click + Add.
From CREATE A MONITOR, enter the details for the following parameters and click Save.
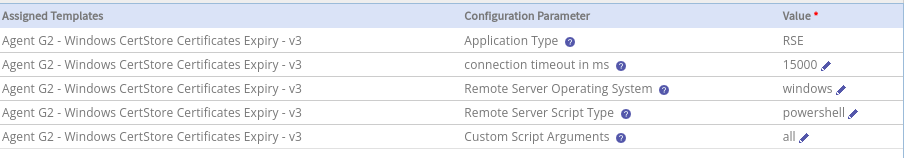
Monitor Scope: Select Partner Monitor or Client Specific Monitor.
Type: Select Application.
Application Type: Select Remote Script Executor.
Name: Enter a unique name for the monitor.
Description: Enter the reason for creating the monitor.
Search the metric and click Add Metrics.
The Metrics section displays the selected metric.
After adding the metrics, navigate to Configuration Parameters.
Configuration Parameters: To add configuration Parameters:
Enter Default Value for all the configuration parameters.
Select the Configurable checkbox.
Click +Add.
Enter Configuration Parameters depending on the selected script type. You can view the default value for the respective Name selected. If you select the Custom value in Configuration Parameters, add the configuration parameter: custom.script.execution.path. The custom.script.execution.path option allows users to execute various types of scripts beyond the default options (Bash/PowerShell/Python). For instance, if a user is using Perl for monitoring, they can select the Custom in the remote.server.scripttype configuration parameter.
Click Add in Configuration Parameters.
Select custom.script.execution.path, and provide the path to the Perl executable. Note: By default, VmWare appliance do not have bash prompt, in such cases you can provide custom path for script execution by using this custom option.
Example: If you are using Python3 for monitoring, you can follow the same process and provide the path to the Python3 executable, such as /usr/bin/python3. Using the executable path ensures that the correct interpreter is used to run the script.
MONITORS screen displays the new monitor.
Note
For Agentless (Gateway) Python RSE, set remote.server.scripttype to custom and specify the full path to the script executable in custom.script.execution.pathwhile creating the monitor. This path parameter should be set to the path where Python is installed. The user must be able to execute the Python script using the specified path.
Macros in Remote Script Executor
Macros are implemented to address the passing of dynamic arguments to scripts. Use the following macros to make available native attributes and custom attribute defined on the resource, in the script:
Note
The RSE framework uses the ${...} syntax for macros. Therefore, this syntax cannot be used elsewhere in your scripts.
As a result, scripting features that rely on ${...} notation—such as arrays in Bash, PowerShell, or other scripting languages—are not supported in RSE scripts.
Static macros
Use static macros to override the resource values. See the Static macro reference for a list of static macros.
Dynamic macros
Macro
Description
${powershell.script.profile.flag}
If the Remote Server Script Type is PowerShell then use this macro: powershell.script.profile.flag
For an example, when using PowerShell scripts on platforms with Custom PowerShell environments, choose No for the flag type to run scripts without loading user profiles. Choose Yes to execute scripts while loading user profiles.
${customattributes.serviceName}
Get custom attributes of the device - If you want to use an argument in any script, apply the custom attributes on the device.
For an example, you have a custom attribute on the device with `Key: serviceName` and `Value: oracledb`. During runtime, the Value: oracledb replaces the macro: ${customattributes.serviceName} in the script.
Get the credentials added to the device - You can use (macros) credentials in the script to avoid storing the original username and password in plain text. When you run the script, the macros replace the original credentials.
For an example, if you define a credential set with a name JMXCred and added it to a device. You can use the macro ${credentials.JMXCred.username} in your script and macro will replace the original credentials in your script at runtime.
${credential.type.all}
Use this macro to get all credential sets (assigned on the device) into the script.
Use this MACRO( ${credential.type.name}) to get specific credentials in the script.
For an example, If the device has SSH, WMI and Database credentials and if user want to get only database credentails inside the script then need to use ${credential.type.database} inside the script. Similarly user can get any type of credentails into the script by replacing .name with the credentails type. Example: ${credential.type.SSH}, ${credential.type.SNMP}, ${credential.type.VMWARE} etc.
${custom.script.arguments}
Use this macro to provide single or delimiter separated input arguments for RSE Template. You can pass up to 65,535 characters as input parameters(custom script arguments) for a template.
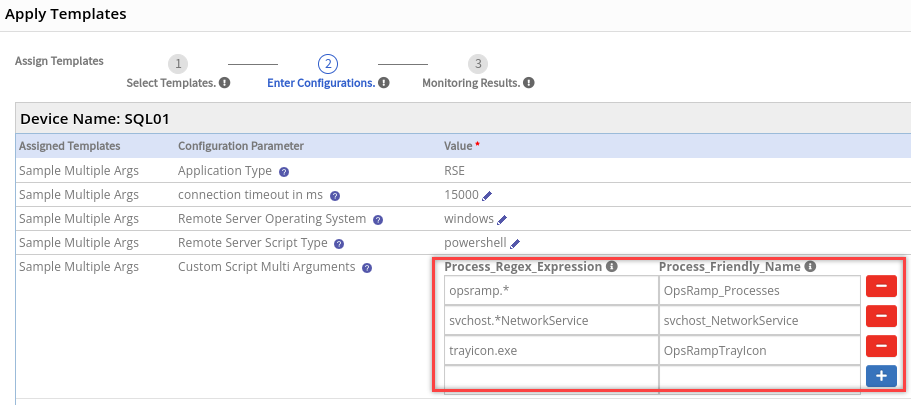
${custom.script.multi.arguments}
Use this macro to create multiple custom script arguments in RSE.
The following are the remaining credential types: SNMP, XEN, WINDOWS, JMX, HTTP, Database, CIM, NETAPP, NETAPPCLUSTER, HYPERFLEX, PURESTORAGE, FTP, CISCOUCS, EMCCLARIION, EMCVNX, EMCVNXE, EMCVMAX, IBM, HPEVA, REMOTE_CLI, TELNET, XTREMIO, VIPTELA, EMCVPLEX, EMCRPA, NUTANIX, HITACHIVSP, AZURESTACK, APPLICATION, and CITRIX_CVDA.
Script execution path for configuration parameters in Linux and Windows
Gateway
Target Platform
Script Type
Linux/SSH
Windows
Linux Gateway
Bash
bash -s
Not Applicable
Powershell
Not Applicable
Not Applicable
Python
python -
Not Applicable
Perl
Perl - -
Not Applicable
Windows Gateway
Bash
bash -s
Powershell
Not Applicable
powershell.exe
Python
python -
python.exe
Perl
Perl - -
perl.exe
If your runtime is not set as an environment variable, mention the absolute path of your runtime. For example, if Python is not set as an environment variable, enter the absolute path of Python such as /usr/lib/python.
Create Template
A template is an instance of a monitor and is applied to devices.
From All Clients, select a client.
Go to Setup > Monitoring >Templates.
Click + Add.
From MONITOR TEMPLATE, enter the details for the following parameters and click Save:
Select Template Scope: Template type.
Collector Type: Select Gateway.
Monitor Type: Select Monitors for G2 Templates.
Applicable for: Select Device.
Template Name: Name of the template.
Description: Summary of the template.
Generation: Generation that the template belongs to.
Tags: User-defined tags for better filtering.
Prerequisites: Essential things that you must consider while monitoring using the template. For example, check the SQL services while monitoring the SQL Parameters using the Windows templates.
Status: Active or End-of-life templates.
Notes: Information that you want to add to the template.
Template Family Name: Category that applies to the application. For example, Windows Server, Storage Server, and Network Server.
Deployment Type: One of the following methods to apply the template to the resources:
Custom
Optional
Standard
After providing the template details, MONITOR TEMPLATE displays the Monitors section. The user interface for the Monitors section varies with the option selected in the Collector Type.
Monitor: To add details in Monitors:
From the Monitors section, click Add.
Enter details for the following parameters:
Frequency: Refer to the frequency to execute the template.
Monitor Definition: Monitor type.
When to Alert: Select Breach of a Threshold.
Select Availability and Alert checkbox to initiate monitoring.
The TEMPLATES section displays the configured details.
Assign Template to a Device
You need to create credentials to assign a template to a device.
Create credentials
If the configuration parameter remote.server.operating system is:
Windows, you must consider Windows type credentials.
LINUX or UNIX, you must consider SSH type credentials.
Select a client from the All Clients list.
Go to Infrastructure > Resources.
From the list of devices, select a device.
Navigates to the device information page.
From the center pane, click Credentials.
Click +Add.
From Create new credential, provide details for the following parameters and click Save:
Name: Name of the credential.
Description: Description of the new credential.
Type: Application type. Select Windows.
Username: Username for the credential set.
Password: Password that you set for the credential set.
Confirm Password: Enter the same password.
Port: Port used to connect to the application.
Connection Time-out (ms): Time taken for the resource to connect to the application.
The Credentials screen displays the new credentials.
Assign template
From the left pane, click Infrastructure.
The Infrastructure screen of the selected client is displayed.
From the Resources tab, select a required resource from the list of resources. Or, use the search option to find the resource.
Click the resource name to view details.
From the left pane, click Monitors.
Templates tab is displayed.
From Templates tab, click +Assign Templates.
From Apply Templates, select the templates.
The selected Templates section displays the chosen templates.
Click Assign.
The template gets assigned to the selected device.
After assigning the template to a resource for monitoring, click Get Latest Metric Values to view the latest metric information.
Use the following global templates to monitor your Linux resources:
Gateway - Linux OS Performance Remote Monitoring
Gateway - Linux OS Performance Remote Monitoring - V2
Gateway - Linux Network Remote Monitoring
View graphs
The gateway monitors the remote system using the assigned templates and displays the results in a graphical format.
From the left pane, click Infrastructure.
The Infrastructure screen of the selected client is displayed.
From the Resources tab, select a required resource from the list of resources. Or, use the search option to find the resource.
Click the resource name to view details.
From the left pane, click Metrics.
The Metrics page displays graphs generated by all monitoring templates assigned to a device.
Search with the template name to filter the graphs.
Standard JSON Output formats: Remote script executor script
Format 1:
Description:
This format is used when the metric does not have any dynamic components or instances. In such cases, construct the JSON by using the metric name as the key and mapping that key to the appropriate value.
Format for the JSON output when there are no exceptions:
{
  "Metric1": 98,
  "Metric2": 70,
  "Metric3": 80
}
Or
Format for the JSON output when exceptions occur:
{

  "Metric1": 98,
  "Metric2": 70,
  "Metric3": 80,
  "scriptExceptions": {
    "subject": "No monitoring data / Unable to fetch monitoring data / Incomplete script execution",
    "description": "Failed to collect data for following metrics. \n metricName: <Metric Name 1>, FailureReason: Failure Reason 1 \n metricName: <Metric Name 2>, FailureReason: Failure Reason 2",
    "raiseAlert": true,
    "logRequired": true,
    "alertState": "warning"
  }
}
Description: This format is used, when one metric returns a string and another metric returns a number. In such cases, a JSON output is prepared by mapping those strings or metrics to their appropriate values.
Note: We recommend using numerical representation for String outputs by utilising Enumerated Map option of RSE.
Format 3:
Description: This format may be used, when the metric contains multiple components. In the below example, the data is fetched for multiple components of disks.
Format for the JSON output when there are no exceptions:
In this example, System_Windows_PhysicalDisk_WriteBytes_PerSec is a metric name that has two components, physicaldisk_1 and physicaldisk_2, with their values mapped inside the components key.
Similarly, System_Windows_PhysicalDisk_AvgDisk_SecPerWrite is another metric name organized in the same way.
Format 4:
Description: This format is used when user needs metric-level alertTokens for all metrics of the script. Alert tokens are used to specify more information about the metrics in alert subject or in alert description or in both.
Format for the JSON output when there are no exceptions:
In this example, the system_linux_memory_utilization metric includes a component real_memory_utilization with a value of 50. The alert tokens offer a summary at the metric level, indicating “Total memory: 16 GB, Used memory: 8 GB”. This information is included in the alert description, the alert subject, or both for the system_linux_memory_utilization metric.
Format 5:
Description: This format is used, when user needs alert tokens at metric-level, for only few of the metrics of the script.
The system_linux_services_status metric includes two alert tokens at the metric-level.
Token 1, denoted as services.active.counts, provides the count of active services.
Token 2, identified as services.inactive.counts, offers the count of inactive services.
These tokens provide valuable insights into the status of the services monitored under this metric.
On the other hand, the metric system_linux_services_count does not have any associated alert tokens. So, alerts for this metric will not include any additional descriptive information.
Format 6:
Description: This format is used, when user needs Component Level Alert Tokens. Alert token value for each metric component are specified separately, as mentioned below:
Format for the JSON output when there are no exceptions:
{
  "MetricName1": 254,
  "MetricName2": {
    "components": {
      "comp1": 90,
      "comp2": 60
    }
  },
  "MetricName3": {
    "components": {
      "component1": "STATE",
      "component2": 98
    },
    "alertTokens": {
      "token1": "value",
      "token2": "value2"
    }
  },
  "MetricName4": {
    "components": {
      "component1": 10,
      "component2": 20
    },
    "alertTokens": {
      "token1": {
        "component1": "token 1 value of component 1",
        "component2": "token 1 value of component 2"
      },
      "token2": {
        "component1": "token 2 value of component 1",
        "component2": "token 2 value of component 2"
      }
    }
  }
}
Or
Format for the JSON output when exceptions occur:
{
  "MetricName1": 254,
  "MetricName2": {
    "components": {
      "comp1": 90,
      "comp2": 60
    }
  },
  "MetricName3": {
    "components": {
      "component1": "STATE",
      "component2": 98
    },
    "alertTokens": {
      "token1": "value",
      "token2": "value2"
    }
  },
  "MetricName4": {
    "components": {
      "component1": 10,
      "component2": 20
    },
    "alertTokens": {
      "token1": {
        "component1": "token 1 value of component 1",
        "component2": "token 1 value of component 2"
      },
      "token2": {
        "component1": "token 2 value of component 1",
        "component2": "token 2 value of component 2"
      }
    }
  },
  "scriptExceptions": {
    "subject": "No monitoring data / Unable to fetch monitoring data / Incomplete script execution",
    "description": "Failed to collect data for following metrics. \n metricName: <Metric Name 1>, FailureReason: Failure Reason 1 \n metricName: <Metric Name 2>, FailureReason: Failure Reason 2",
    "raiseAlert": true,
    "logRequired": true,
    "alertState": "warning"
  }
}
Example:
{
  "system_linux_interfaces_count": {
    "components": {
      "system_linux_interfaces_count": 8
    },
    "alertTokens": {
      "interfaces_names": "interfaces names are cni0, ens160, flannel.1, veth05f2cc15,  veth10f0079d,  veth42a5dd4f,  vetha7efbaa5,  vethdc3c2d78"
    }
  },
  "system_linux_network_interface_trafficIn": {
    "components": {
      "cni0": 14329842632,
      "ens160": 13491465976
    },
    "alertTokens": {
      "mac.address": "cni0:42-a5-a4-fd-86-eb,ens160:00-0c-29-b7-be-c3"
    }
  },
  "system_linux_network_interface_trafficOut": {
    "components": {
      "cni0": "9148429744",
      "ens160": "12488937472"
    }
  },

"scriptExceptions": {
    "subject": "An exception has occurred. Unable to fetch the monitoring data",
    "alertState": "critical",
    "description": "Failed to collect data for following metrics. \n metricName: system_linux_network_interface_errorsIn, FailureReason: rx_errors attribute not available for interface cni0, metricName: system_linux_network_interface_errorsOut, FailureReason: tx_errors attribute not available for interface cni0",
    "raiseAlert": true,
    "logRequired": true
  }
}
Explanation:
In this example, the JSON structure demonstrates the use of scriptExceptions along with component-level and normal metric-level alert token.
The system_linux_interfaces_count metric includes a component that counts the number of interfaces and a metric-level alert token listing the names of these interfaces.
For system_linux_network_interface_trafficIn, the components show the inbound traffic for specific interfaces, while the component-level alert token provides the MAC addresses of these interfaces, offering more details on the interface.
system_linux_network_interface_trafficOut presents outbound traffic data for the interfaces but does not include additional alert tokens.
Custom Script Arguments Macro
When to Use
If a user needs to pass input parameters to a script, they can do so within RSE using the macro ${custom.script.arguments}.
For scenarios where multiple input parameters are required — including different types of parameters — users can utilize multiple delimiters to separate them. Example: exactProcessName:::opsramp-agent@@@scriptagent.bin
Note
If users prefer not to use multiple delimiters in input parameters, they can leverage the custom multi-script arguments feature of RSE, which is explained in detail in the next section.
Macro Syntax and Explanation: ${custom.script.arguments}
This macro consists of the following 3 fields:
Display Name: A brief description of the input parameter that helps users understand what should be passed.
Default Value: An optional field where a default value can be specified for the argument. This value is used if no value is provided by the user.
Configurable: This checkbox determines whether the user is allowed to edit the input parameter. If unchecked, the parameter becomes non-editable.
This macro can be used with both Agent and Gateway collector types.
How to Use
Step 1: First, develop a script that returns the output in a valid JSON format supported by RSE. Please refer to the sample scripts (Python, PowerShell, and Bash) provided in the Real-Time Use Case Example.
Step 2: Create a Metric Refer the Document on how to create metric.
Under the Metric section, click +Add and use the metrics created in Step 1.
Step 3: Create a Monitor Refer the Document on how to create a monitor.
While setting up the monitor, make sure to include script in the Script section.
Under the Configuration Parameters section, click + Add and select custom.script.arguments as shown below.
Add the appropriate display name, default value if any and save the monitor.
Step 4: Create a Template Refer the Document to know how to create a template. Create the template with above created metrics and monitor.
Step 5: Assign a template Refer the Document to know how to assign template.
Real Time Use Case Example
Windows Services Monitoring: Here we can see how custom script arguments can be used effectively in Windows Service Monitoring.
The script above only works with Agent/Gateway, as the macro is replaced with the actual input parameter values when the template is assigned to the device. However, to execute the same script manually on the device, replace $customArgs = ${custom.script.arguments} with the following:
#!/bin/bash

customArgs=${custom.script.arguments}
customArgs=$(echo "$customArgs" | sed 's/ //g')

normalize() {
    echo "$1" | sed -e 's/\\/\\\\/g' -e 's/"/\\"/g' -e 's/[[:blank:]]//g'
}

# Initialize JSON structure
json="{ \"system_linux_services_status\": { \"components\": {"

# Common function to get service status
get_service_status() {
    systemctl --type=service --all --no-pager --plain --no-legend | sed 's/.service//'
}

# Process service output and update JSON structure
process_service_output() {
    while IFS= read -r line; do
        unit=$(echo "$line" | awk '{print $1}')
        normalized_unit=$(normalize "$unit")
        active=$(echo "$line" | awk '{print $2}')
        json="$json \"$normalized_unit\": \"$active\","
    done <<EOF
$services_output
EOF
    json="${json%,}"
}

services_output=$(get_service_status | awk -v services="$customArgs" 'BEGIN {split(services, svcArray, ",")} {for (i in svcArray) {if ($1 ~ svcArray[i]) {print $1, $3; break}}}' )
process_service_output "$services_output"
json="$json}}}"

# Print the final JSON output
echo "$json"
The script above only works with Agent/Gateway, as the macro is replaced with the actual input parameter values when the template is assigned to the device. However, to execute the same script manually on the device, replace customArgs=${custom.script.arguments} with the following:
import json
import subprocess
import re

custom_args = ${custom.script.arguments}

# Function to normalize service names (escaping characters)
def normalize(service_name):
    return re.sub(r'([\\"])', r'\\\1', service_name.strip())

# Function to get service status using systemctl
def get_service_status():
    command = "systemctl --type=service --all --no-pager --plain --no-legend"
    result = subprocess.run(command, shell=True, capture_output=True, text=True)
    return result.stdout

# Function to process the service output and create a JSON structure
def process_service_output(services_output):
    json_data = {}
    for line in services_output.splitlines():
        parts = line.split()
        if len(parts) < 2:
            continue
        unit = parts[0]
        active = parts[1]
        normalized_unit = normalize(unit)
        json_data[normalized_unit] = active
    return json_data

# Main processing logic
def main():
    global custom_args  # Use the global custom_args variable

    # Initialize the JSON structure
    json_output = {
        "system_linux_services_status": {
            "components": {}
        }
    }

    custom_args = custom_args.replace(" ", "")  # Removing spaces
    custom_args_lower = custom_args.lower()

    # Process the custom service arguments (e.g., tuned, opsramp.*, systemd.*)
    services_output = get_service_status()
    filtered_services = []

    # Filter services based on the provided custom arguments (comma-separated)
    for service in custom_args.split(","):
        filtered_services.extend([f"{line.split()[0]} {line.split()[2]}" for line in services_output.splitlines() if re.match(service, line.split()[0])])

    # Process filtered services and update JSON structure
    json_output["system_linux_services_status"]["components"] = {
    k.replace(".service", ""): v for k, v in process_service_output("\n".join(filtered_services)).items()
}

    # Convert the Python dictionary to a JSON string
    print(json.dumps(json_output, separators=(',', ':')))

if __name__ == "__main__":
    main()
The script above only works with Agent/Gateway, as the macro is replaced with the actual input parameter values when the template is assigned to the device. However, to execute the same script manually on the device, replace custom_args = ${custom.script.arguments} with the following:
For any RSE script, we can pass upto 5 different types of custom arguments and for each argument we can pass a maximum of 20 values.
Each Custom argument contains 3 fields:
Name
Description
Default Value
Here, Name and Description are the mandatory fields for a custom script argument. The Default value is an optional field, which we can specify only if we want to give any default value to the custom script argument.
Marco Name: ${custom.script.multi.arguments}
Prerequisites
Multiple custom script arguments are supported with Agent and Gateway version 14.0 and above.
Macro custom.script.multi.arguments will support Agent and Gateway collector types.
Windows Process Monitoring - Use Case
This is a real time use case for multiple custom scrpit aurgument usages.
Step 1- Create Metric: Refer to the Document to know how to create metric.Here, user need to create two metrics such as: system.windows.process.handlecount and system.windows.process.threadcount
Step 2- Create a Monitor: Refer to the Document to know how to create a monitor. While creating a monitor, make the following changes:
Under the Script section, use the below sample script. Powershell
import json
import subprocess
import re

# Use the Macro to suport multiple custom script arguments
customArgs = ${custom.script.multi.arguments}

# Function to normalize service names (escaping characters)
def normalize(service_name):
    return re.sub(r'([\\"])', r'\\\1', service_name.strip())

# Function to get service status using systemctl
def get_service_status():
    command = "systemctl --type=service --all --no-pager --plain --no-legend"
    result = subprocess.run(command, shell=True, capture_output=True, text=True)
    return result.stdout

# Main processing logic
def main():
    # Parse the JSON input
    args = json.loads(customArgs)

    # Create a dictionary mapping service names to their friendly names
    service_mapping = {service["service_name"]: service["service_friendly_name"] for service in args}

    # Initialize the JSON structure
    json_output = {
        "system_linux_services_status": {
            "components": {}
        }
    }

    # Get all service statuses
    output = get_service_status()

    # Process only the services specified in JSON
    for line in output.splitlines():
        parts = line.split()
        if len(parts) < 3:
            continue

        service_name = parts[0].strip()
        status = parts[2].strip()

        # Remove potential ".service" suffix for matching
        service_name_clean = service_name.replace('.service', '')

        # Check if the service name exists in the provided JSON
        if service_name_clean in service_mapping:
            friendly_name = service_mapping[service_name_clean]
            json_output["system_linux_services_status"]["components"][friendly_name] = status

    # Convert the Python dictionary to a JSON string
    print(json.dumps(json_output, separators=(',', ':')))

if __name__ == "__main__":
    main()
The script above only works with Agent/Gateway, as the macro is replaced with the actual input parameter values when the template is assigned to the device. However, to execute the same script manually on the device, replace customArgs = ${custom.script.multi.arguments} with the following:
Using multiple custom script arguments in Bash is not recommended due to complex parsing. We recommend using custom script arguments with multiple delimiters. If this does not fully address their use case, they can install utilities like bc, jq, etc., on the target device for better input parsing.
#!/bin/bash

#Install jq for this sample code to work
# Load the JSON argument
customArgs=${custom.script.multi.arguments}

# Function to get service status using systemctl
get_service_status() {
    systemctl --type=service --all --no-pager --plain --no-legend
}

# Store service mappings in a temporary file
temp_file="/tmp/service_mapping.txt"
rm -f "$temp_file"

while IFS= read -r line; do
    service_name=$(echo "$line" | jq -r '.service_name')
    friendly_name=$(echo "$line" | jq -r '.service_friendly_name')
    echo "$service_name|$friendly_name" >> "$temp_file"
done < <(echo "$customArgs" | jq -c '.[]')

# Initialize JSON output
json_output='{"system_linux_services_status":{"components":{'

# Get all service statuses
while IFS= read -r line; do
    read -r service_name _ status _ <<< "$line"

    # Remove ".service" suffix for matching
    service_name_clean=$(echo "$service_name" | sed 's/\.service$//')

    # Lookup friendly name from temp file
    friendly_name=$(grep "^$service_name_clean|" "$temp_file" | cut -d'|' -f2)

    # Check if the friendly name was found
    if [ -n "$friendly_name" ]; then
        json_output+="\"$friendly_name\":\"$status\","
    fi
done < <(get_service_status)

# Remove the last comma and close JSON
json_output=$(echo "$json_output" | sed 's/,$//')'}}}'

# Print the final JSON
echo "$json_output"

# Cleanup temporary file
rm -f "$temp_file"
The script above only works with Agent/Gateway, as the macro is replaced with the actual input parameter values when the template is assigned to the device. However, to execute the same script manually on the device, replace customArgs=${custom.script.multi.arguments} with the following:
This macro is used to retrieve specific fields (such as username, password, or port) from credentials associated with a particular name assigned to the device.
Using the credentials macro in a script helps prevent storing sensitive information, like usernames and passwords, in plain text. When the script runs, the macros will dynamically replace the credentials with their actual values.
In the macro syntax, CredentialName and credentialField should be replaced with the actual names used in the script, as explained below.
For example, if you define a credential set with the name JMXCred and assign it to a device, you can use the macro ${credentials.JMXCred.username} in your script to retrieve the username associated with the JMXCred credentials. The macro will automatically replace it with the actual username during script execution.
Sample Code to Extract specific fields from Credentials of Particular Name: If a user assigns credentials named WMI_Windows_JM to the end device in the UI, the required fields(such as username, password, or port) can be extracted as follows:
Python
# Retrieves the username from the credential named WMI_Windows_JM
user = ${credentials.WMI_Windows_JM.username}

# Retrieves the password from the credential named WMI_Windows_JM
pwd = ${credentials.WMI_Windows_JM.password}

# Retrieves the port from the credential named WMI_Windows_JM
port = ${credentials.WMI_Windows_JM.port}
Powershell
# Retrieves the username from the credential named WMI_Windows_JM
user = ${credentials.WMI_Windows_JM.username}

# Retrieves the password from the credential named WMI_Windows_JM
pwd = ${credentials.WMI_Windows_JM.password}

# Retrieves the port from the credential named WMI_Windows_JM
port = ${credentials.WMI_Windows_JM.port}
Bash
# Retrieves the username from the credential named WMI_Windows_JM
user=${credentials.WMI_Windows_JM.username}

# Retrieves the password from the credential named WMI_Windows_JM
pwd=${credentials.WMI_Windows_JM.password}

# Retrieves the port from the credential named WMI_Windows_JM
port=${credentials.WMI_Windows_JM.port}
Tip
The macro keywords username, password, and port are case-insensitive.
Macro Syntax for Credentials of specific type
Macro Syntax: ${credential.type.name}
When to Use:
This macro is used to retrieve specific fields (such as username, password, or port) from a particular type of credentials (e.g., database, SSH, WMI, etc.) assigned to a device and incorporate them into the script.
For example, if a device has SSH, WMI, and Database credentials, and the user wants to extract only the database credentials within the script, they would use ${credentials.type.Database}. Similarly, the user can retrieve any type of credentials into the script by replacing .name with the appropriate credential type.
Example: ${credential.type.SSH}, ${credential.type.SNMP}, ${credential.type.VMWARE} etc.
Sample Code to Extract specific fields from Database Credentials:
Python
import json

# Retrieve credentials for the database type
credentials = ${credential.type.Database}

# Convert from JSON
credentials = json.loads(credentials)

# Iterate through credentials
for cred in credentials:
    SQLUserName = cred["Username"]
    SQLPassword = cred["Password"]
    SQLPort = cred["Port"]
Powershell
# Retrieve credentials for the database type
$credentials = ${credential.type.Database}
$credentials = ConvertFrom-Json $credentials

foreach ($cred in $credentials) {
        $SQLUserName = $cred.Username
        $SQLPassword = $cred.Password
        $SQLPort = $cred.Port
}
Bash
#!/bin/bash

# Install jq for this sample code to work
# Retrieve credentials for the database type
credentials=${credential.type.Database}

# Convert JSON to an array of credential objects
parsed_credentials=$(echo "$credentials" | jq -c '.[]')

# Iterate through credentials
while IFS= read -r cred; do
    SQLUserName=$(echo "$cred" | jq -r '.Username')
    SQLPassword=$(echo "$cred" | jq -r '.Password')
    SQLPort=$(echo "$cred" | jq -r '.Port')
done <<< "$parsed_credentials"
Tip
The macro keyword Database is case-sensitive.
Generate Alert Tokens in RSE
The Alert Tokens feature is applicable for RSE G2 based templates that utilize the Agent or Gateway collector types. This feature will be useful when you wish to include additional details about an alert in the alert Subject or Description.
To utilize the alertTokens feature for any RSE metric, the components key is essential. Below are examples that illustrate how to set up alert tokens for both a single metric and multiple metrics:
Example: Alert Tokens for a Single Metric
{
  "windows_certStore_certificatesExpiryInDays": {
    "components": {
      "Entrust Root Certification Authority - G2_4A538C28": 2327,
      "Microsoft Root Certificate Authority 2011_3F8BC8B5FC9FB29643B569D66C42E144": 4259
    },
    "alertTokens": {
      "cert.info": "Entrust Root Certification Authority - G2_4A538C28: Issued By - Entrust Root Certification Authority - G2; Issued To - Entrust Root Certification Authority - G2; Serial Number - 4A538C28, Microsoft Root Certificate Authority 2011_3F8BC8B5FC9FB29643B569D66C42E144: Issued By - Microsoft Root Certificate Authority 2011; Issued To - Microsoft Root Certificate Authority 2011; Serial Number - 3F8BC8B5FC9FB29643B569D66C42E144"
    }
  }
}
Example: Alert Tokens for Multiple Metrics If you have multiple metrics that require alert tokens, the same structure applies for each metric. Here’s how you need to structure it:
(Here Mac Address will be shown in alert description of respective Network Interface.)
Step 3- Create a Template: Refer the Document to know how to create a template.
Create the template using above created metric and monitor.
Step 5- Assign a template: Refer the Document to know how to assign a template.
Assign the template to a device and provide any custom script arguments, if applicable. You can refer to the screenshot below for reference.
Note
When assigning the template to a device, the user can pass up to 20 values to the above custom script arguments.
When the user wants to change the previously assigned values to the template, they can do so while re-assigning the template to the device.
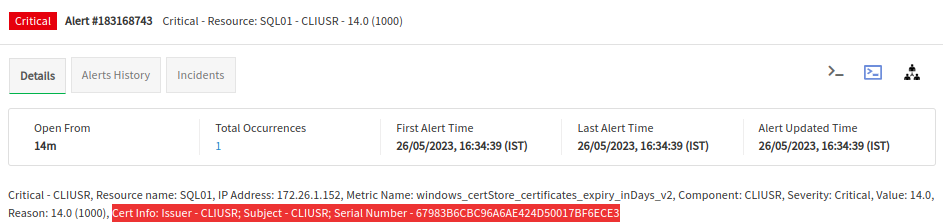
Below is the final script output
{
  "windows_certStore_certificates_expiry_inDays_v2": {
    "components": {
      "Baltimore CyberTrust Root": 716,
      "ISRG Root X1": 4391,
      "Microsoft Root Certificate Authority 2010": 4410,
      "VeriSign Class 3 Public Primary Certification Authority - G5": 4799,
      "GlobalSign Root CA": 1707,

      "CLIUSR":30
    },
    "alertTokens": {
      "cert.info": "Baltimore CyberTrust Root:Issuer - Baltimore CyberTrust Root; Subject - Baltimore CyberTrust Root; Serial Number - 020000B9,ISRG Root X1:Issuer - ISRG Root X1; Subject - ISRG Root X1; Serial Number - 008210CFB0D240E3594463E0BB63828B00,Microsoft Root Certificate Authority 2010:Issuer - Microsoft Root Certificate Authority 2010; Subject - Microsoft Root Certificate Authority 2010; Serial Number - 28CC3A25BFBA44AC449A9B586B4339AA,VeriSign Class 3 Public Primary Certification Authority - G5:Issuer - VeriSign Class 3 Public Primary Certification Authority - G5; Subject - VeriSign Class 3 Public Primary Certification Authority - G5; Serial Number - 18DAD19E267DE8BB4A2158CDCC6B3B4A,GlobalSign Root CA:Issuer - GlobalSign Root CA; Subject - GlobalSign Root CA; Serial Number - 040000000001154B5AC394,CLIUSR: Issuer - CLIUSR; Subject - CLIUSR; Serial Number - 67983B6CBC96A6AE424D50017BF6ECE3"
    }
  }
}
View the Alert Tokens
To view the Alert Tokens, follow these steps:
Navigate to the Infrastructure > Resources section in the user interface.
Select the desired resource for which you want to view the details.
Navigate to the Details tab.
You should be able to see the alert token information as shown in the figure.
Exception Handling In RSE
To capture additional logs and generate alerts for script failure reasons in custom scripts, users can utilise the scriptExceptions option of RSE. This option allows for detailed logging and alert generation, helping to identify and address issues efficiently at monitor level.
The scriptExceptions option provides flexibility for users to specify whether the alert state should be critical or warning. Users can customise the alert subject and description messages, and also decide if logging or alerting (or both) are necessary.
Script Exceptions are supported only from Agent & Gateway version 14.0.0 and above. If this option is used with versions below Agent & Gateway version 14.0.0, the template will not retrieve any data from the device.
Script exceptions should adhere to the following format. Note that all keys are case-sensitive.
Format for scriptExceptions when there are exceptions in script:
{
  "scriptExceptions": {
    "subject": "No monitoring data / Unable to fetch monitoring data / Incomplete script execution",
    "description": "Failed to collect data for following metrics. \n metricName: cpu.util, FailureReason: Invalid WMI class \n metricName: memory.util, FailureReason: unable to read /proc/mem",
    "raiseAlert": true,
    "logRequired": true,
    "alertState": "warning"
  }
}
Possible values of each field:
subject: The user can provide any meaningful alert subject here.
description: This field should contain detailed information about the exception. It is recommended to include the metric name and the reason for the data collection failure.
raiseAlert: Set this to true if an alert for the exception is needed; otherwise, set it to false. Alert will be generated on metric rse_metric_collection_failures, if it is set true.
logRequired: Set this to true if a log entry for the exception is needed; otherwise, set it to false.
alertState: Set this to critical for a critical alert, or warning if a warning alert is sufficient.
Including the metric name in the description is recommended to identify which metric the exception belongs to.
If there are multiple exceptions in the script, consolidate all of them into a single alert description, as shown above. The scriptExceptions payload should be returned only once per script execution and only if exceptions are encountered. If there are no exceptions, return only the metric data without including the scriptExceptions payload.
Few scenarios for Using Exception Handling:
When the user doesn’t provide inputs as recommended.
When the commands or queries used in script are not available or supported on the target device.
When the user wants to add extra information to the logs.
To handle any dynamic exceptions that may occur in the script.
Linux Network Interfaces Monitoring Use-Case:
This real-time use case demonstrates the use of scriptExceptions and alertTokens options in RSE.
Step 1:
First, create metrics needed for the RSE script, here we created four metrics named as below:
system_linux_network_interface_errorsIn
system_linux_network_interface_errorsOut
system_linux_network_interface_discardsIn
Step 2:
In the MONITOR page.
Under Metrics section, add the above created metrics.
Under script section, paste the below RSE Script.
Sample Script:
#!/bin/bash

scriptExceptions=""
json_output="{"

count=1
str_append_errors_in=""
str_append_errors_out=""
str_append_discards_in=""

address_json=""
exceptionMessages=""

# Function to handle exceptions and append messages to the variable
handle_exception() {
    local metricName="$1"
    local interface="$2"
    local attribute="$3"

    local exceptionMsg="$attribute attribute not available for interface $interface"

    # Check if the metric name is the same as the previous one
    if [ "$metricName" != "$previousMetricName" ]; then
        if [ -n "$exceptionMessages" ]; then
            exceptionMessages+=", "
        fi
        exceptionMessages+="metricName: $metricName, FailureReason: $exceptionMsg"
    else
        # Append the failure reason to the existing metric entry
        exceptionMessages+="\n $exceptionMsg"
    fi

    # Store the current metric name for comparison in the next iteration
    previousMetricName="$metricName"
}


# Main function
main() {
    local components_received="{\"components\":{"
    local components_transmitted="{\"components\":{"
    local components_total="{\"components\":{"

    interface_dirs=$(ls -I "lo" /sys/class/net/)
    # Iterate over interfaces
    for interface in $interface_dirs; do
        attributes=("address" "rx_errors" "tx_errors" "rx_dropped" "tx_dropped")
        address=$(cat "/sys/class/net/$interface/address" 2>/dev/null | tr ':' '-')
        rx_errors=$(cat "/sys/class/net/$interface/statistics/rx_errors" 2>/dev/null)
        tx_errors=$(cat "/sys/class/net/$interface/statistics/tx_errors" 2>/dev/null)
        rx_dropped=$(cat "/sys/class/net/$interface/statistics/rx_dropped" 2>/dev/null)

        # Iterate through the attributes and check if any are blank
        for attribute in "${attributes[@]}"; do
            if [ -z "${!attribute}" ]; then
                case "$attribute" in
                    rx_errors) handle_exception "system_linux_network_interface_errorsIn" "$interface" "$attribute" ;;
                    tx_errors) handle_exception "system_linux_network_interface_errorsOut" "$interface" "$attribute" ;;
                    rx_dropped) handle_exception "system_linux_network_interface_discardsIn" "$interface" "$attribute" ;;
                esac
            fi
        done

        # Append to JSON strings
        for metric in "${attributes[@]}"; do
            value="${!metric}"  # Get the value of the current metric using indirect variable expansion

            # Check if the value is not blank
            if [ -n "$value" ]; then
                # Determine the appropriate JSON string based on the metric
                case "$metric" in
                    rx_errors) json_string="$str_append_errors_in" ;;
                    tx_errors) json_string="$str_append_errors_out" ;;
                    rx_dropped) json_string="$str_append_discards_in" ;;
                    address) json_string="$address_json" ;;
                esac

                # Append the metric to the appropriate JSON string
                if [ "$metric" == "address" ]; then
                    json_string+="$interface:$value,"
                else
                    json_string+="\"$interface\":\"$value\","
                fi
                 case "$metric" in
                    rx_errors) str_append_errors_in="$json_string" ;;
                    tx_errors) str_append_errors_out="$json_string" ;;
                    rx_dropped) str_append_discards_in="$json_string" ;;
                    address) address_json="$json_string" ;;
                esac
            fi
        done
    done

    str_append_errors_in="${str_append_errors_in%,}"
    str_append_errors_out="${str_append_errors_out%,}"
    str_append_discards_in="${str_append_discards_in%,}"
    components_received="${components_received%,}}"
    components_transmitted="${components_transmitted%,}}"
    components_total="${components_total%,}}"

    # Construct the JSON output
    if [ -n "$exceptionMessages" ]; then
        json_output+="\"scriptExceptions\": {"
        json_output+="\"subject\": \"An exception has occurred. Unable to fetch the monitoring data.\","
        json_output+="\"alertState\": \"critical\","
        json_output+="\"description\": \"Failed to collect data for following metrics. \n $exceptionMessages\","
        json_output+="\"logRequired\": true,"
        json_output+="\"raiseAlert\": true"
        json_output+="},"
    fi

    address_json=$(echo $address_json | sed 's/.$//')
    if [ -n "$str_append_errors_in" ]; then
        json_output+="\"system_linux_network_interface_errorsIn\":{\"components\":{$str_append_errors_in},\"alertTokens\":{\"mac.address\":\"$address_json\"}},"
    fi

    if [ -n "$str_append_errors_out" ]; then
        json_output+="\"system_linux_network_interface_errorsOut\":{\"components\":{$str_append_errors_out},\"alertTokens\":{\"mac.address\":\"$address_json\"}},"
    fi

    if [ -n "$str_append_discards_in" ]; then
        json_output+="\"system_linux_network_interface_discardsIn\":{\"components\":{$str_append_discards_in},\"alertTokens\":{\"mac.address\":\"$address_json\"}}}"
    fi

    echo "$json_output"
}

# Run main function
main
Step 3:
Create the template with above created metrics and monitor.
Step 4:
Assign the template to any device.
Below is the JSON Output for above Script when there are no exceptions:
Below is the JSON Output for above Script when exceptions occur:
{
  "scriptExceptions": {
    "subject": "An exception has occurred. Unable to fetch the monitoring data.",
    "alertState": "critical",
    "description": "Failed to collect data for following metrics. \n metricName: system_linux_network_interface_errorsIn, FailureReason: rx_errors attribute not available for interface cni0\n
     rx_errors attribute not available for interface ens160\n rx_errors attribute not available for interface flannel.1",
    "logRequired": true,
    "raiseAlert": true
  },
  "system_linux_network_interface_errorsOut": {
    "components": {
      "cni0": "0",
      "ens160": "0",
      "flannel.1": "0"
    },
    "alertTokens": {
      "mac.address": "cni0:42-a5-a4-fd-86-eb,ens160:00-0c-29-b7-be-c3,flannel.1:1a-3a-7b-0b-fd-e4"
    }
  },
  "system_linux_network_interface_discardsIn": {
    "components": {
      "cni0": "0",
      "ens160": "120",
      "flannel.1": "0"
    },
    "alertTokens": {
      "mac.address": "cni0:42-a5-a4-fd-86-eb,ens160:00-0c-29-b7-be-c3,flannel.1:1a-3a-7b-0b-fd-e4"
    }
  }
}
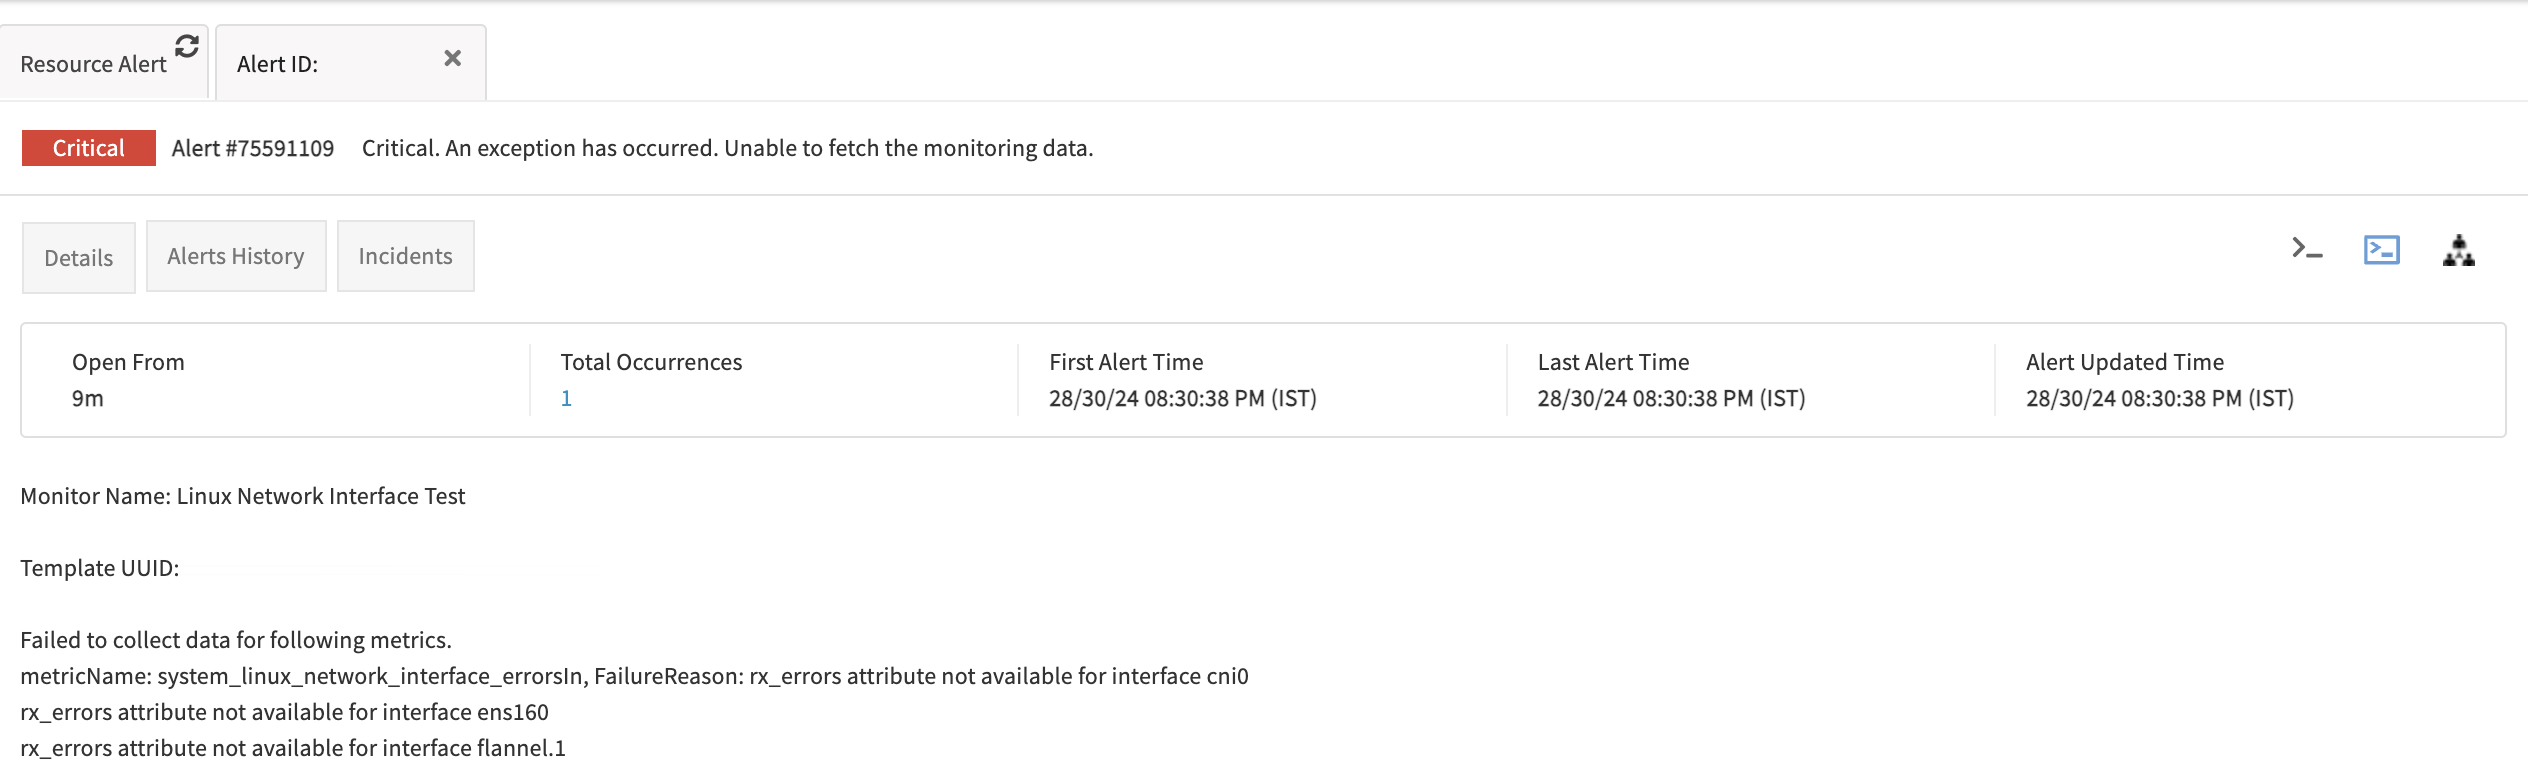
In the provided JSON, the scriptExceptions block indicates that an exception occurred while collecting monitoring data, for the metric system_linux_network_interface_errorsIn, the failure reason was that the rx_errors attribute was not available for the interfaces ens160 and flannel.1. This block provides details on the exception, including the subject, alert state, and a description of the failure reasons.
For the system_linux_network_interface_errorsIn metric, data for the cni0 interface was successfully collected since there was no exception for this specific interface. Since the other two metrics, system_linux_network_interface_errorsOut, system_linux_network_interface_discardsIn, did not encounter any exceptions, their data was successfully collected and printed without issues.
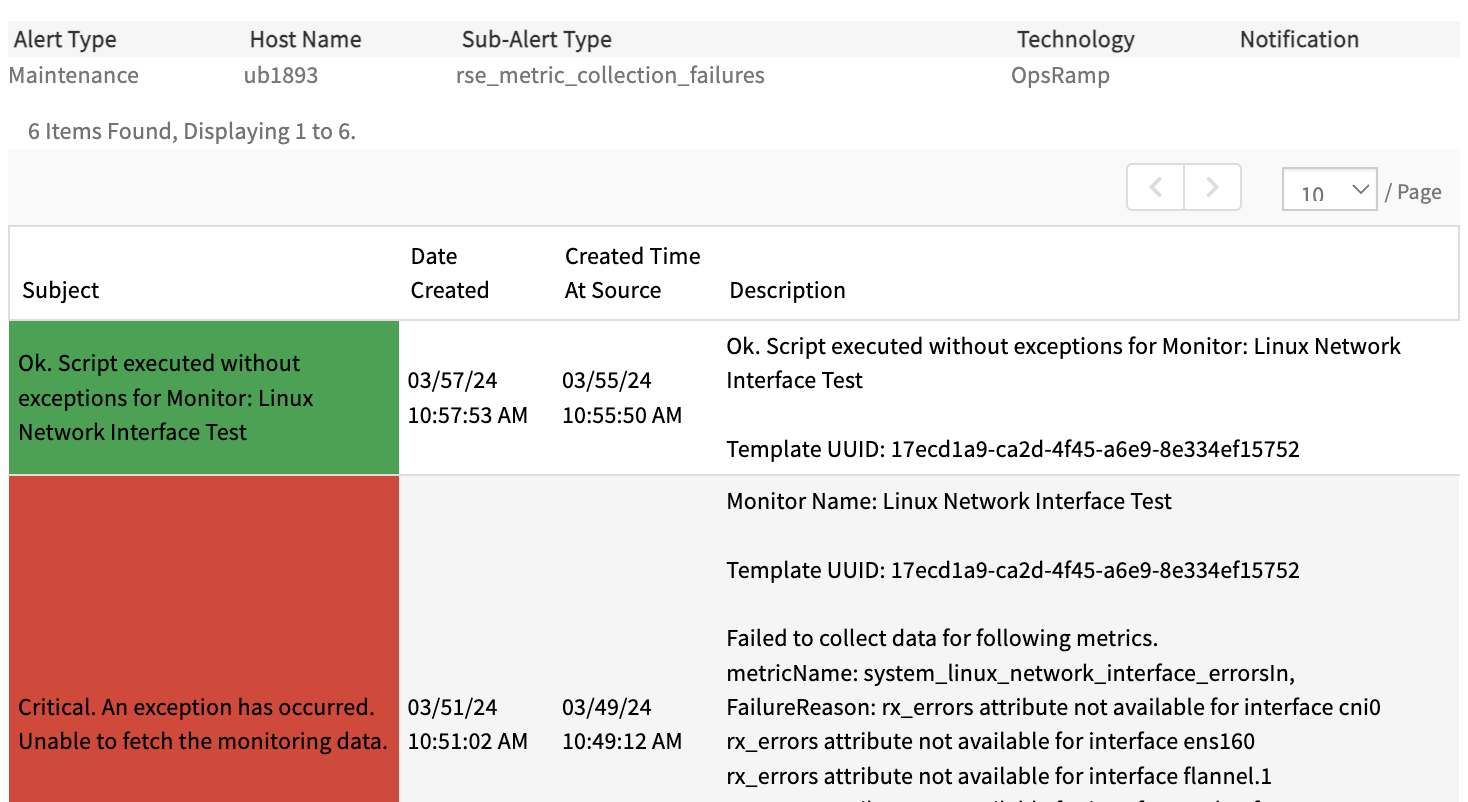
Below is the alert shown for device:
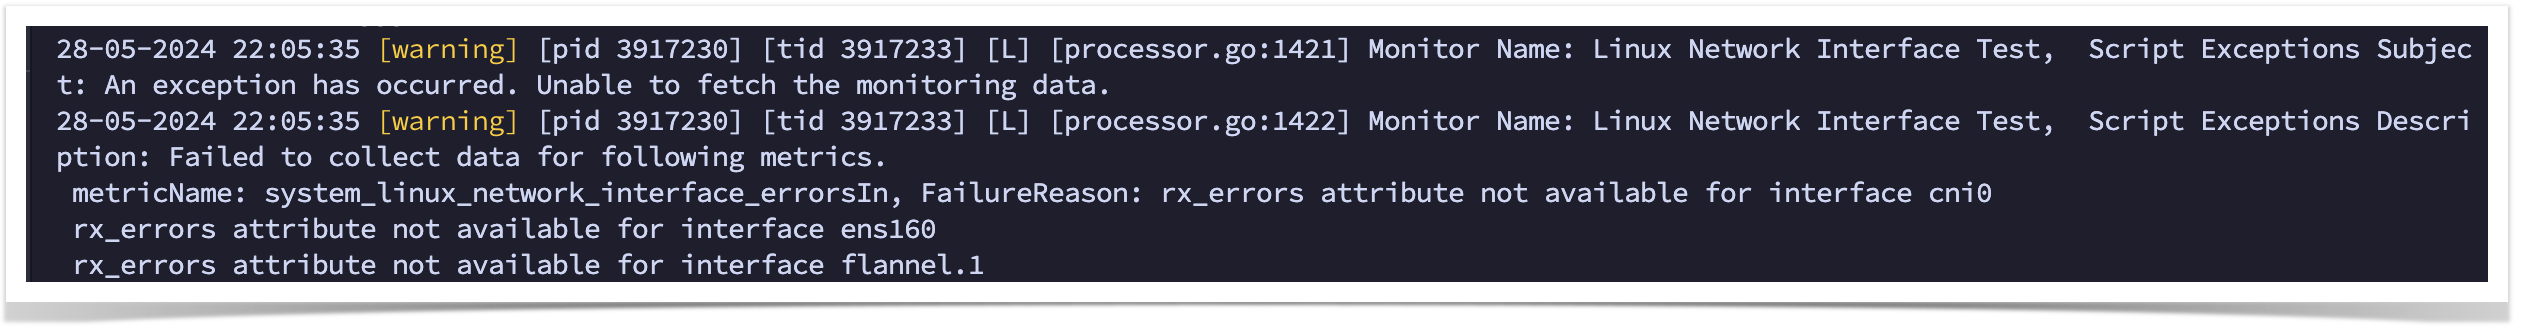
In Debug level logs we can see scriptExceptions as below:
Below is the screenshot of the heal alert after resolving the script exceptions:
Enumerated Mapping In RSE
This feature is particularly beneficial for the following scenarios:
Graph Plotting for String Metrics:
When a metric returns a string value, it is not possible to plot a graph using it. In such cases, Enumerated Mapping allows for the conversion of these string values into integers, enabling graph plotting and visualization.
State Representation Metrics:
For metrics that return integer values representing different states (such as online/offline), Enumerated Mapping helps map these integers to their corresponding states, making the data more readable and meaningful.
Using Enumerated Mapping, users can ensure that the metric data is more informative and easier to interpret. This feature provides clear insights into the metric states through both numerical and textual representations while fetching the latest metrics data, and in alerts and graphs.
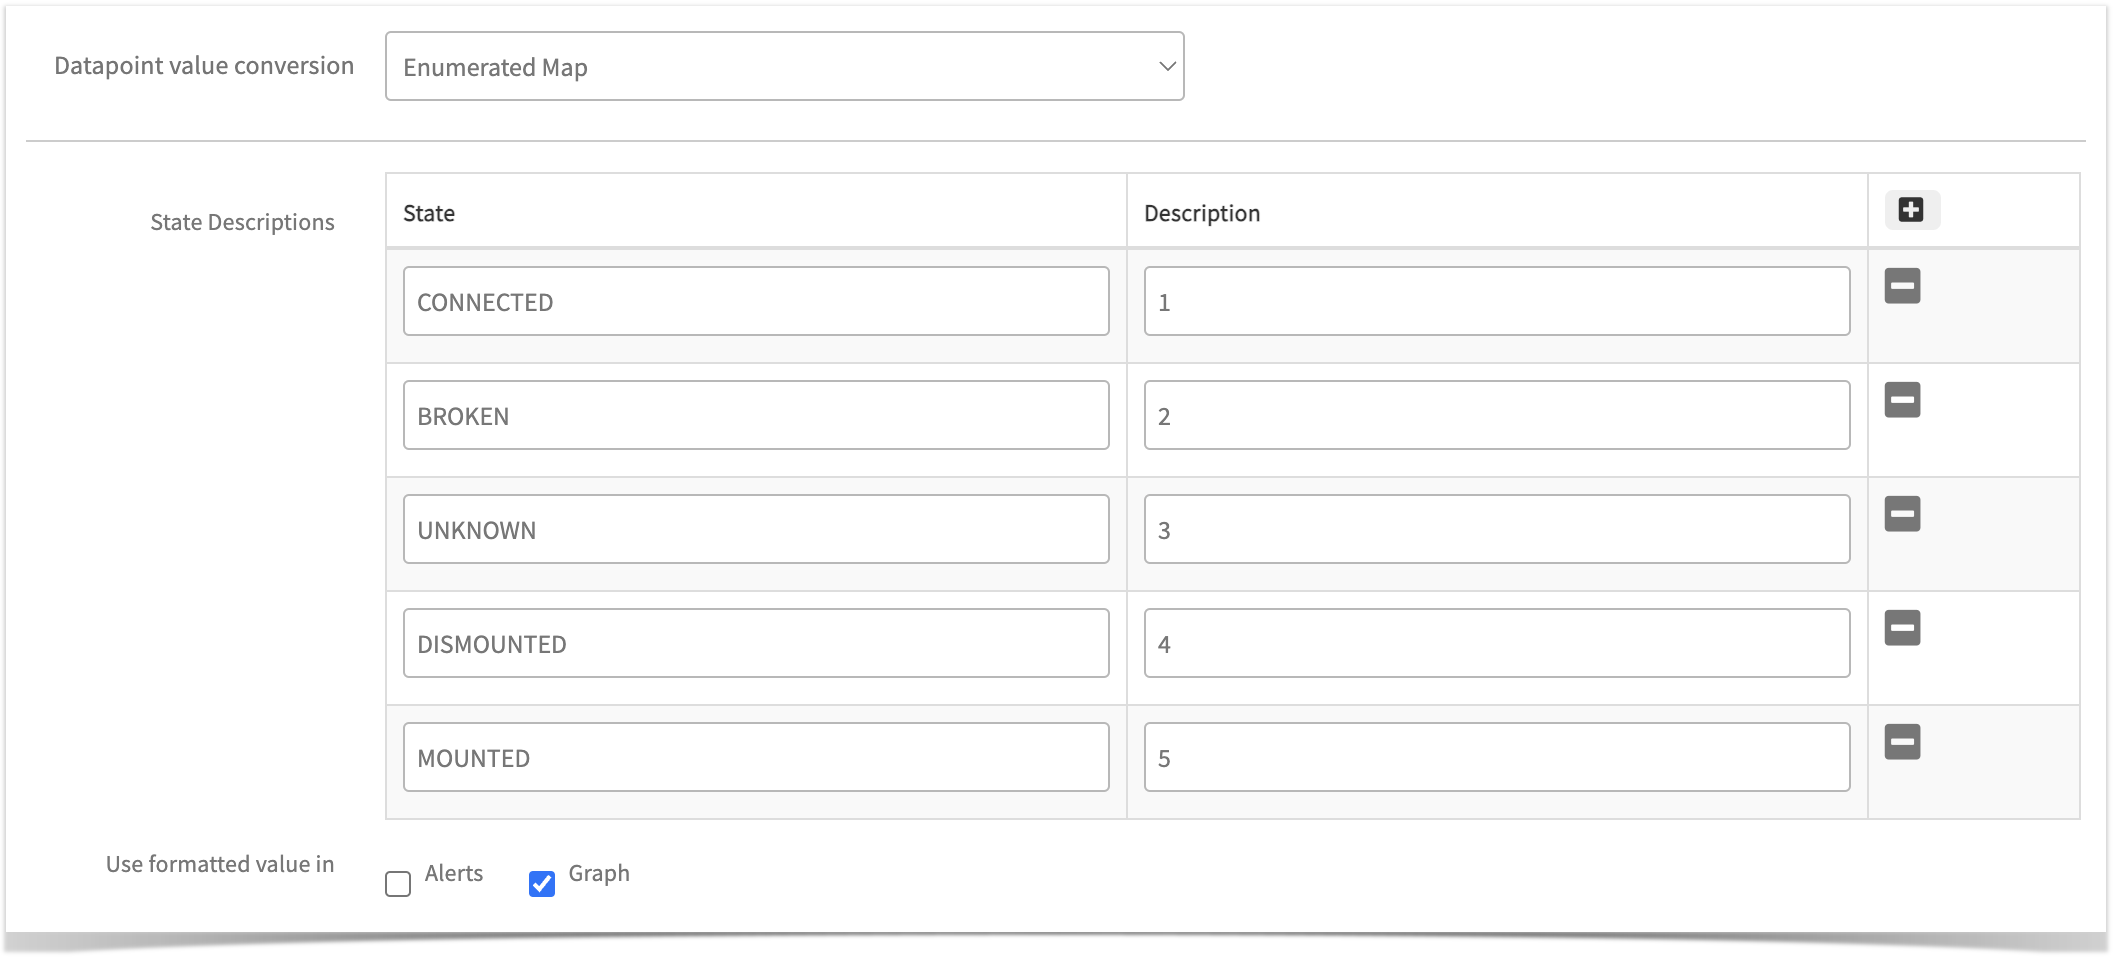
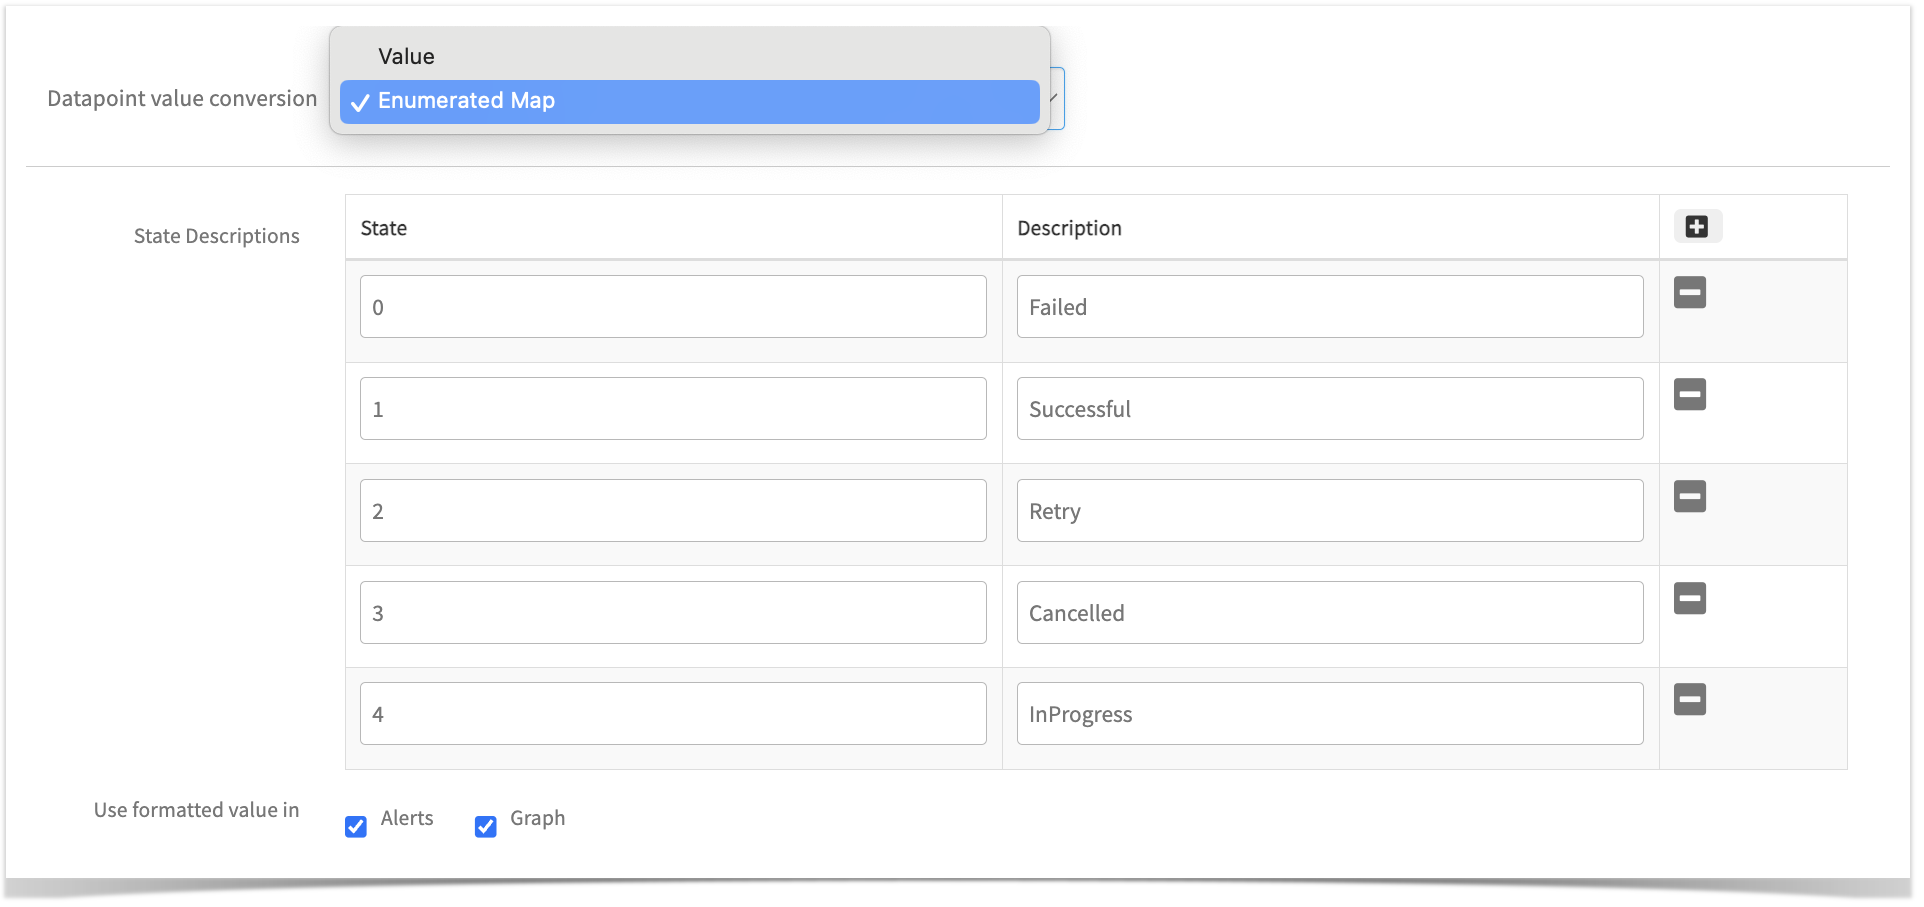
To use the Enumerated Mapping option, users must select “Datapoint Value Conversion” as “Enumerated Map” from the dropdown menu when creating a metric.
There are two types of Enumerated Mapping supported.
Type 1: String to Integer Mapping.
Type 2: Integer to String Mapping.
Type 1: String to Integer Mapping
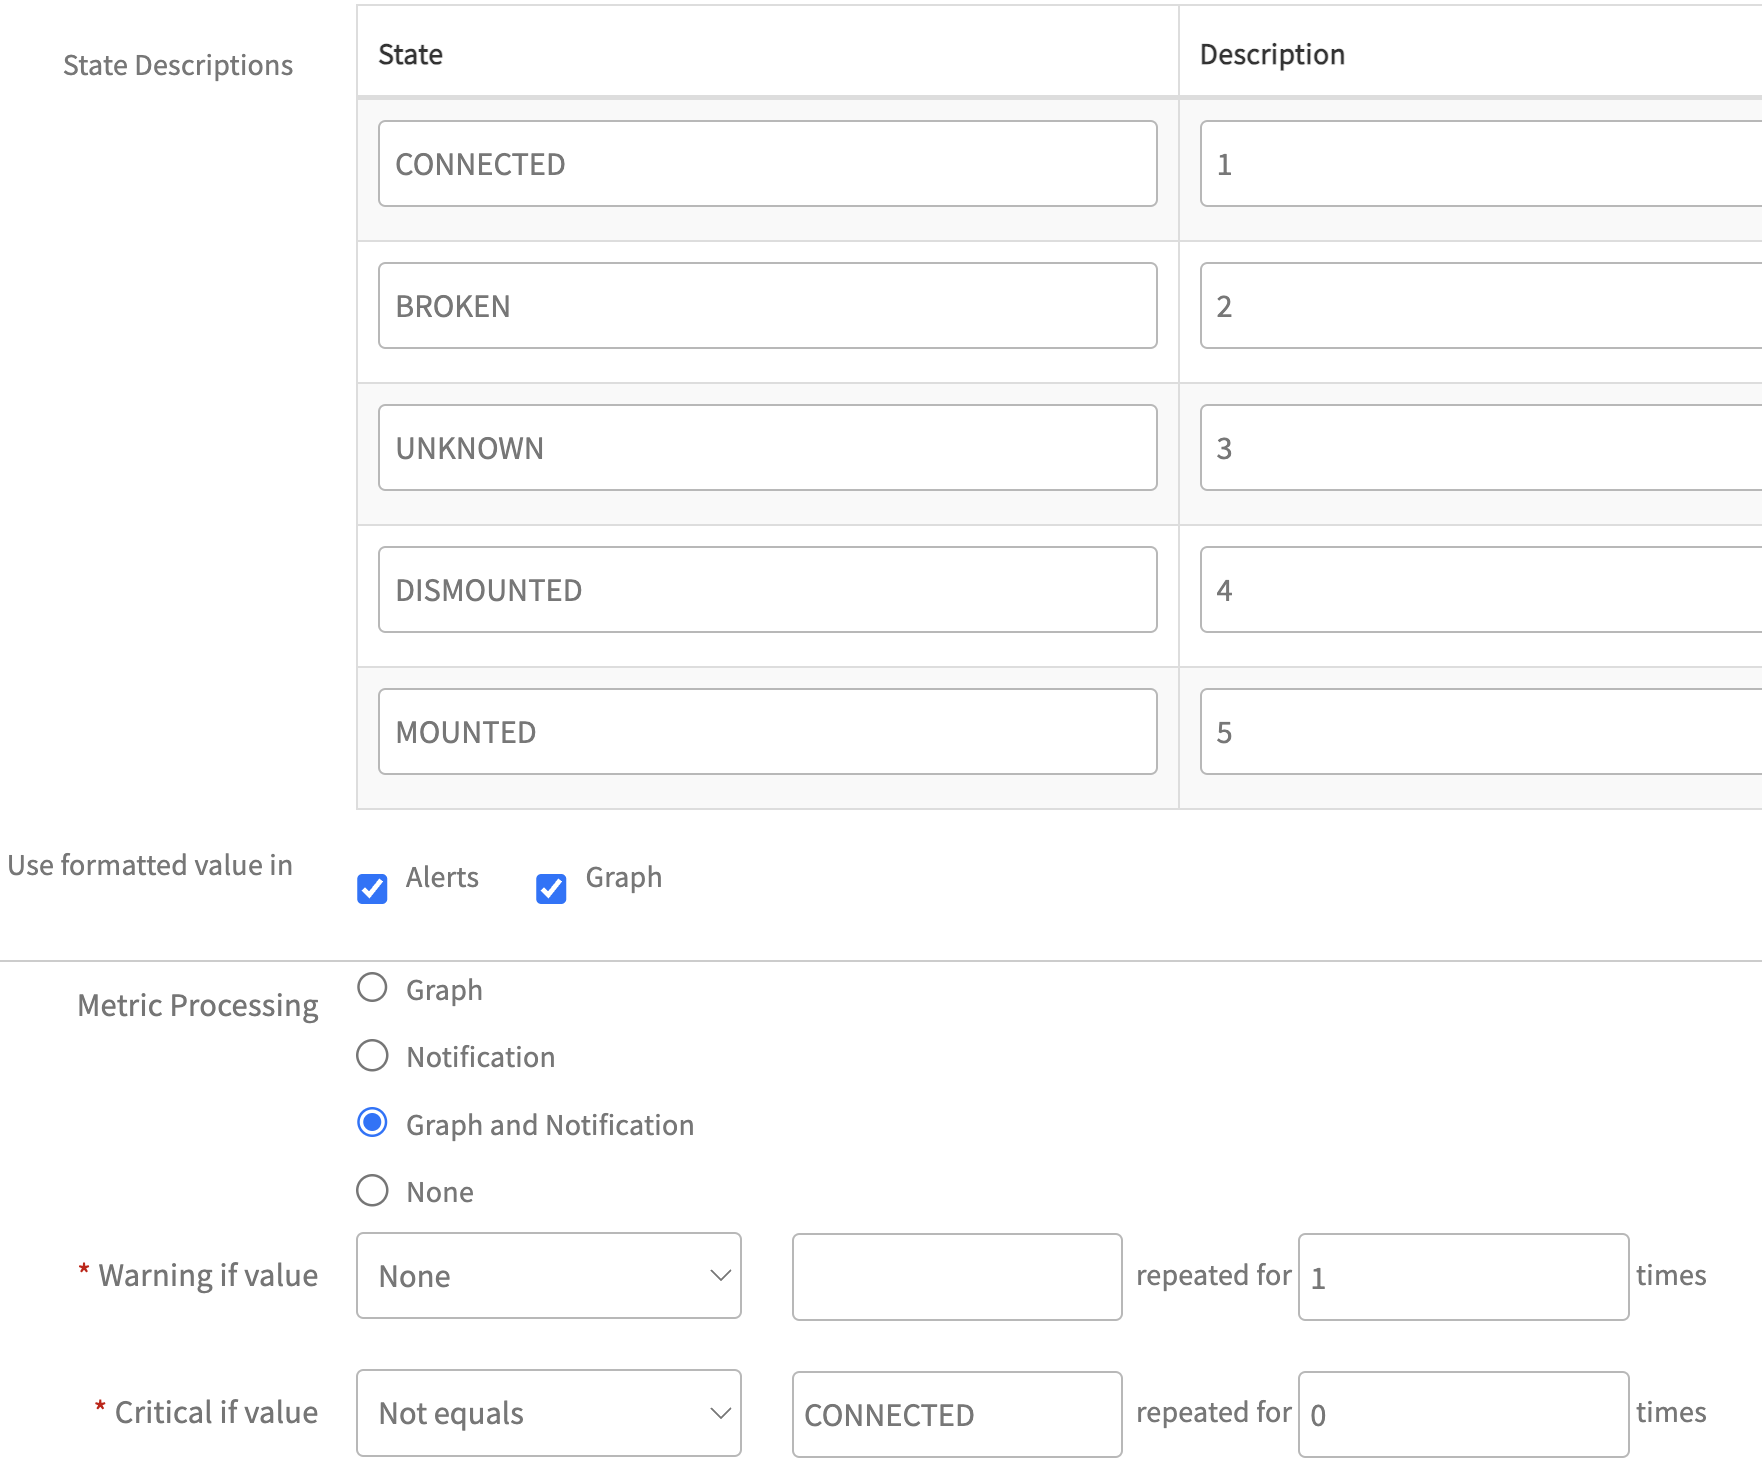
When to Use: Use this type, when the script returns strings. For state or status-related metrics, it is common to return string values, like Connected, Mounted, Broken, etc.
For state/status-related metrics, it is common to return string values. However, monitoring through graphs only supports integer values. In such cases, String to Integer Mapping is necessary.
When creating a metric, users are required to provide mappings for all possible string values of that metric.
These mappings should include the string values in the “State” column along with any corresponding unique integer representations in the “Description” column, as shown below:
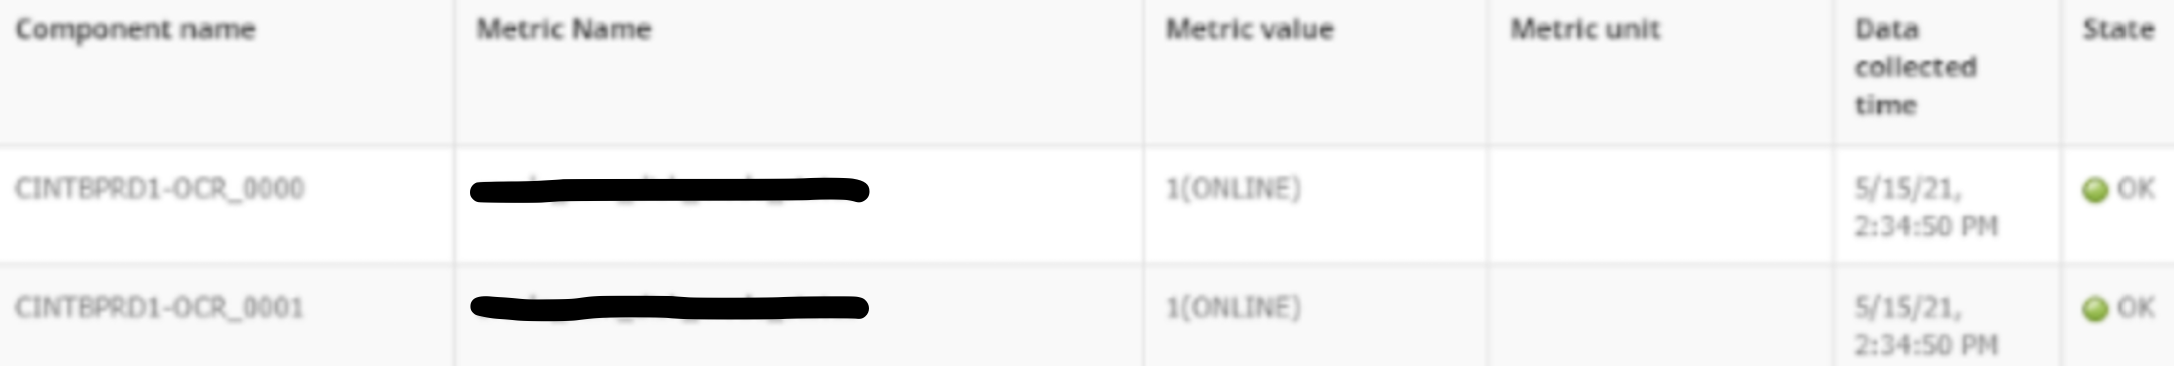
These mapped values, i.e., the string value and its respective integer, can be shown in both Alerts and Graphs, or only in alerts or graphs, by selecting the appropriate “Alerts” and “Graph” checkboxes, as shown in above screenshot.
Additionally, these mappings will appear in the “Get Latest Metric Value” page against the metric value.
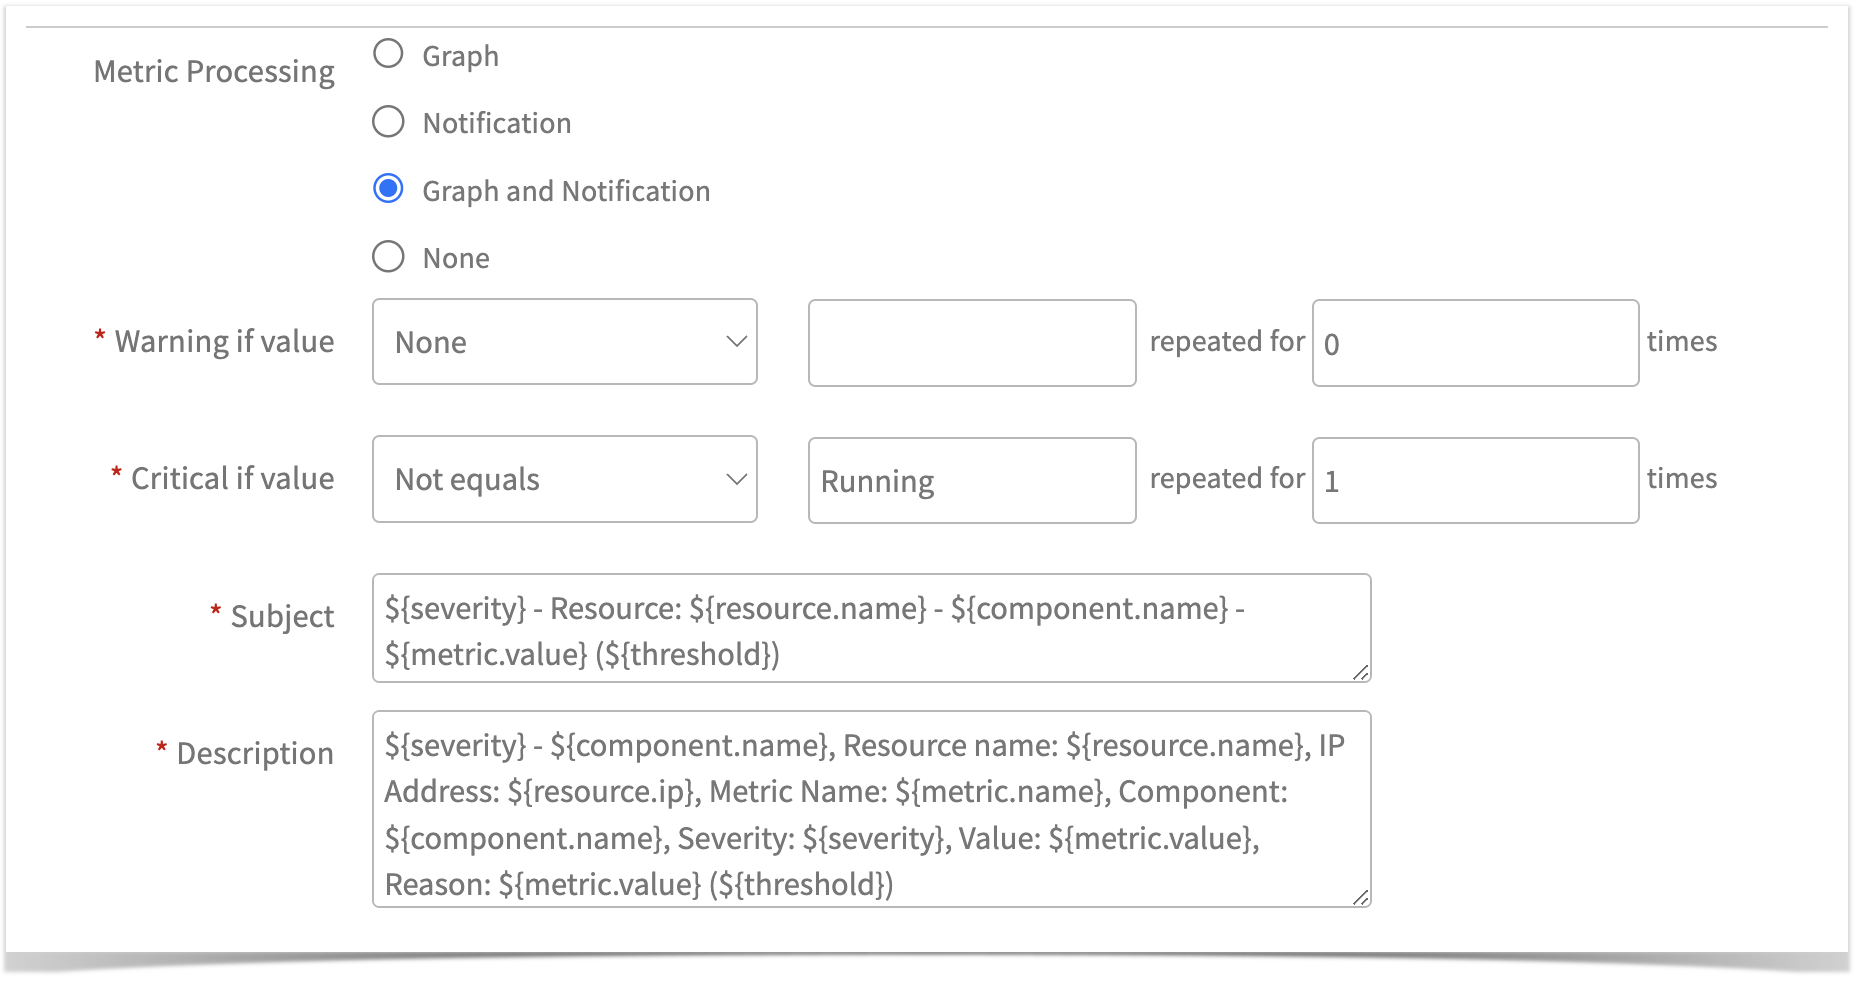
Defining alert thresholds:
Tip
Ensure to configure alert thresholds based on the State column values only, if alert is required. For this case, a critical alert will be generated if the metric value is not equal to CONNECTED (i.e. represented as , Not equals CONNECTED).
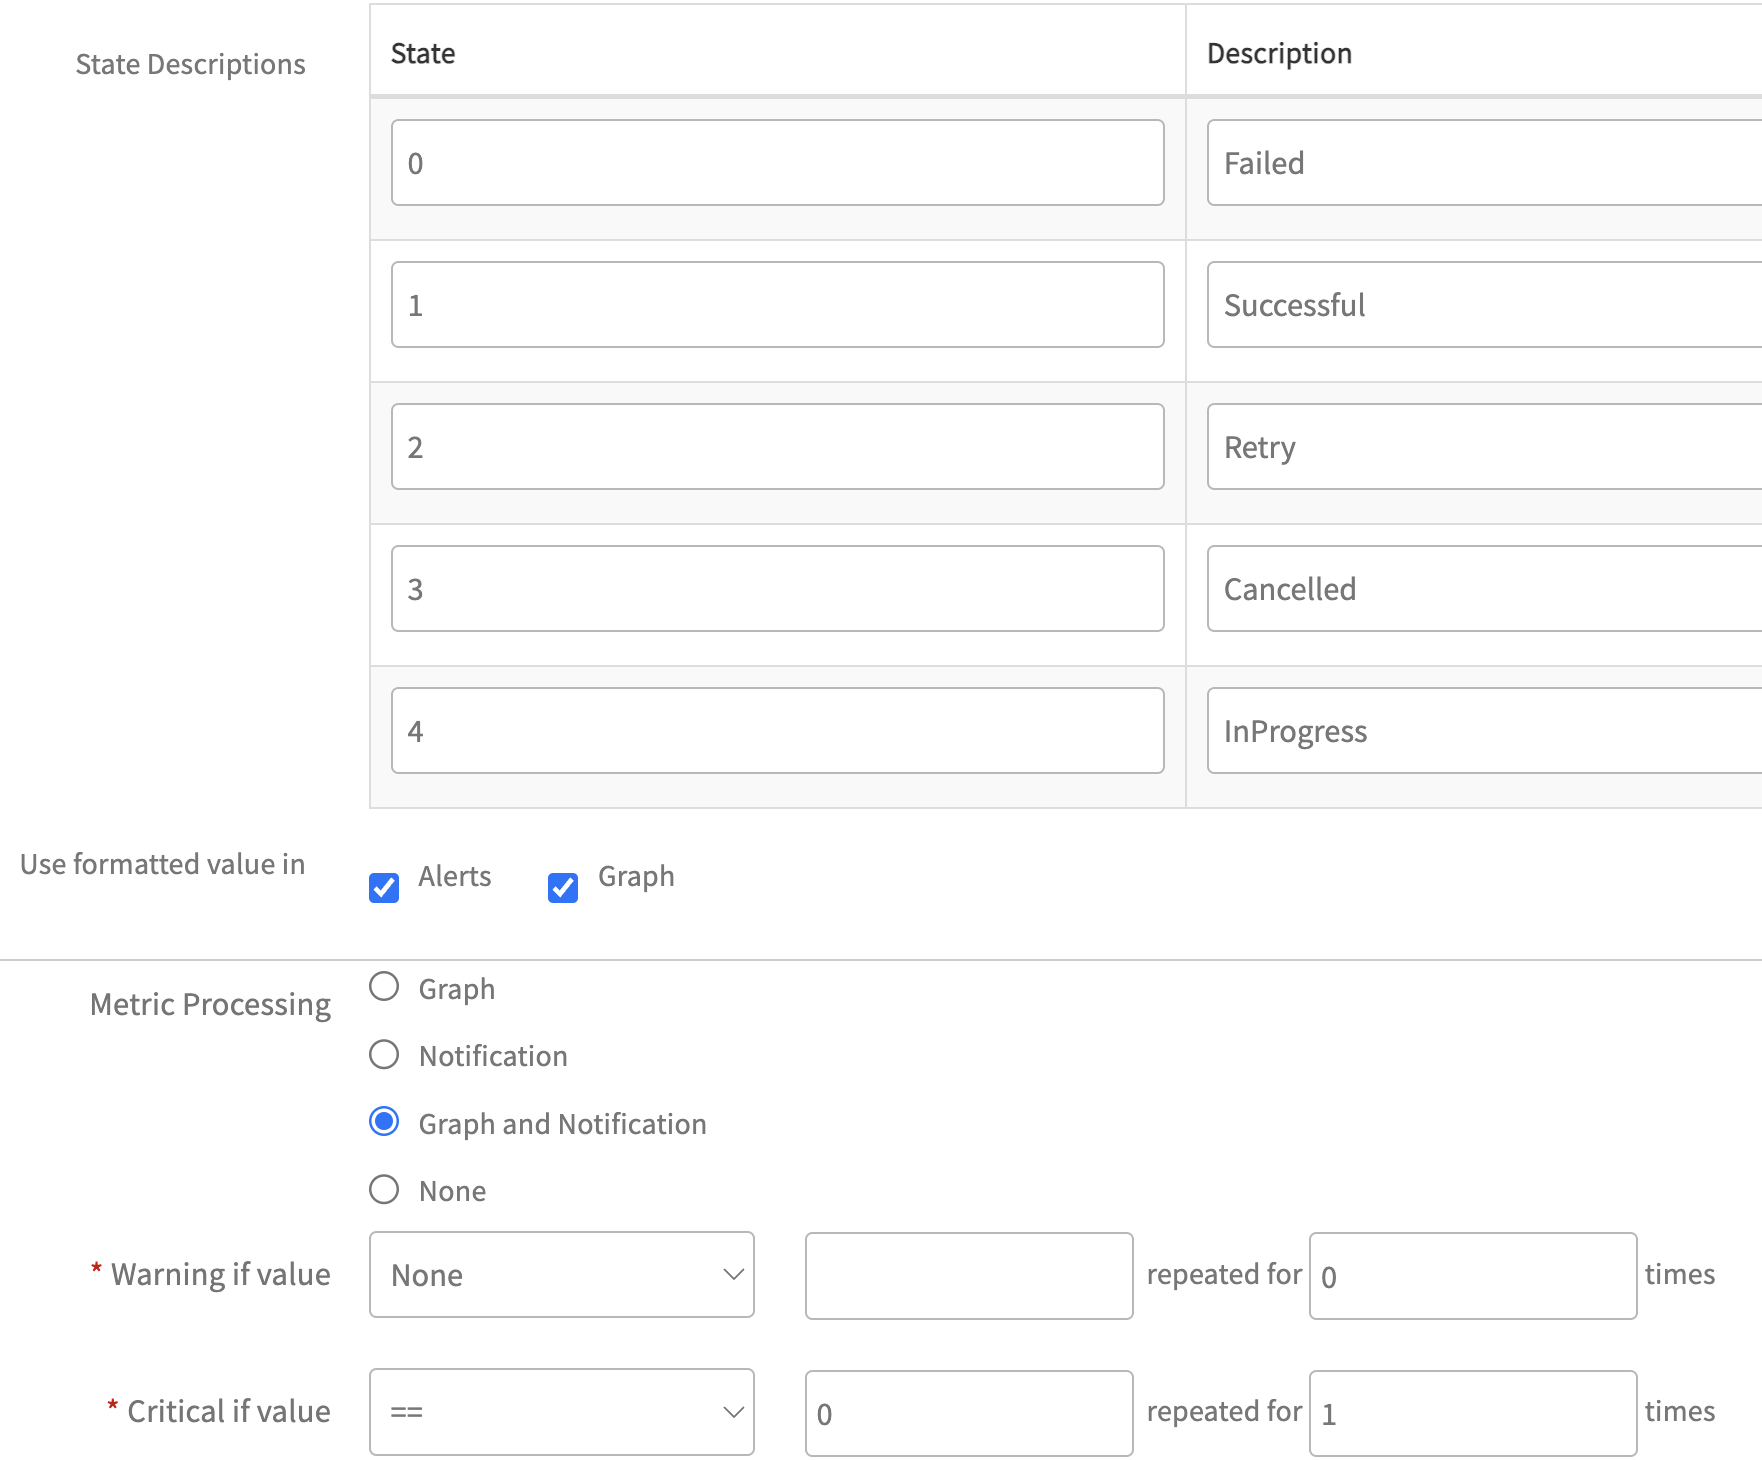
Type 2: Integer to String Mapping
When to Use: Use this type, when the metric returns integers (such as 0/1) that represent different states (e.g., online/offline). This will help associate the corresponding state name with each integer value.
When a metric returns direct integer values representing specific states or status, Integer to String Mapping can be used to display the exact metric state referred to by the integer.
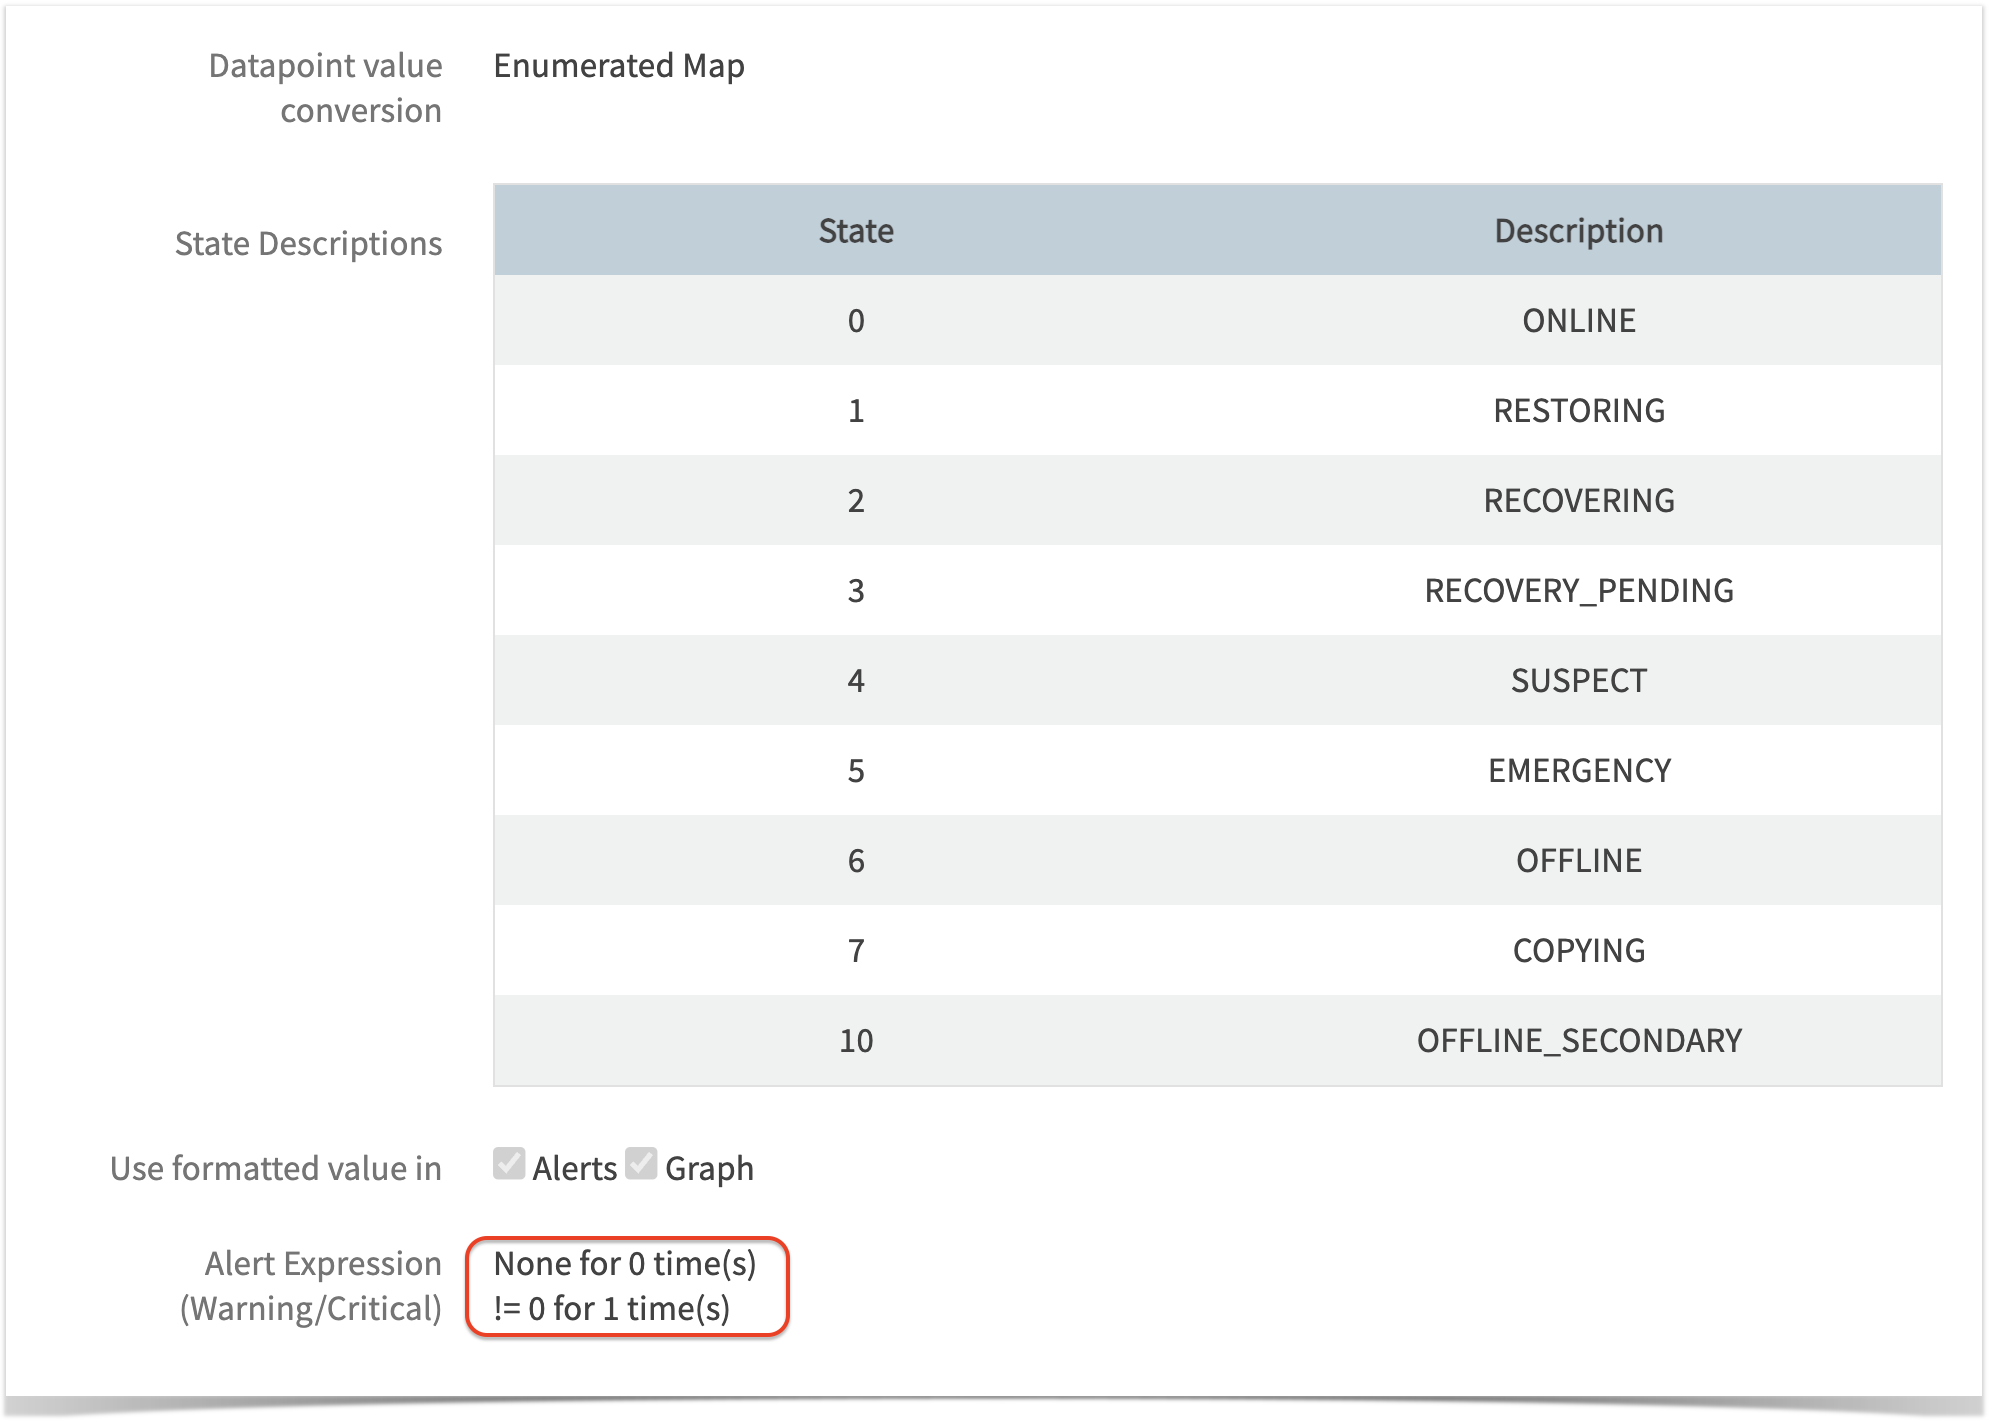
Users need to provide mappings for all possible integer values of that metric in State column and their corresponding string representations in Description column, while creating the metric, as shown below:
These mapped values, i.e., the integer value and its respective string, can be shown in both Alerts and Graphs, or only in alerts or graphs, by selecting the appropriate “Alerts” and “Graph” checkboxes, as shown in above screenshot.
Additionally, these mappings will appear in the “Get Latest Metric Value” page against the metric value.
Defining alert thresholds:
Tip
Ensure to configure alert thresholds based on the State column values only, if alert is required. For this case, a critical alert will be generated if the metric value is 0 (i.e. represented as , == 0).
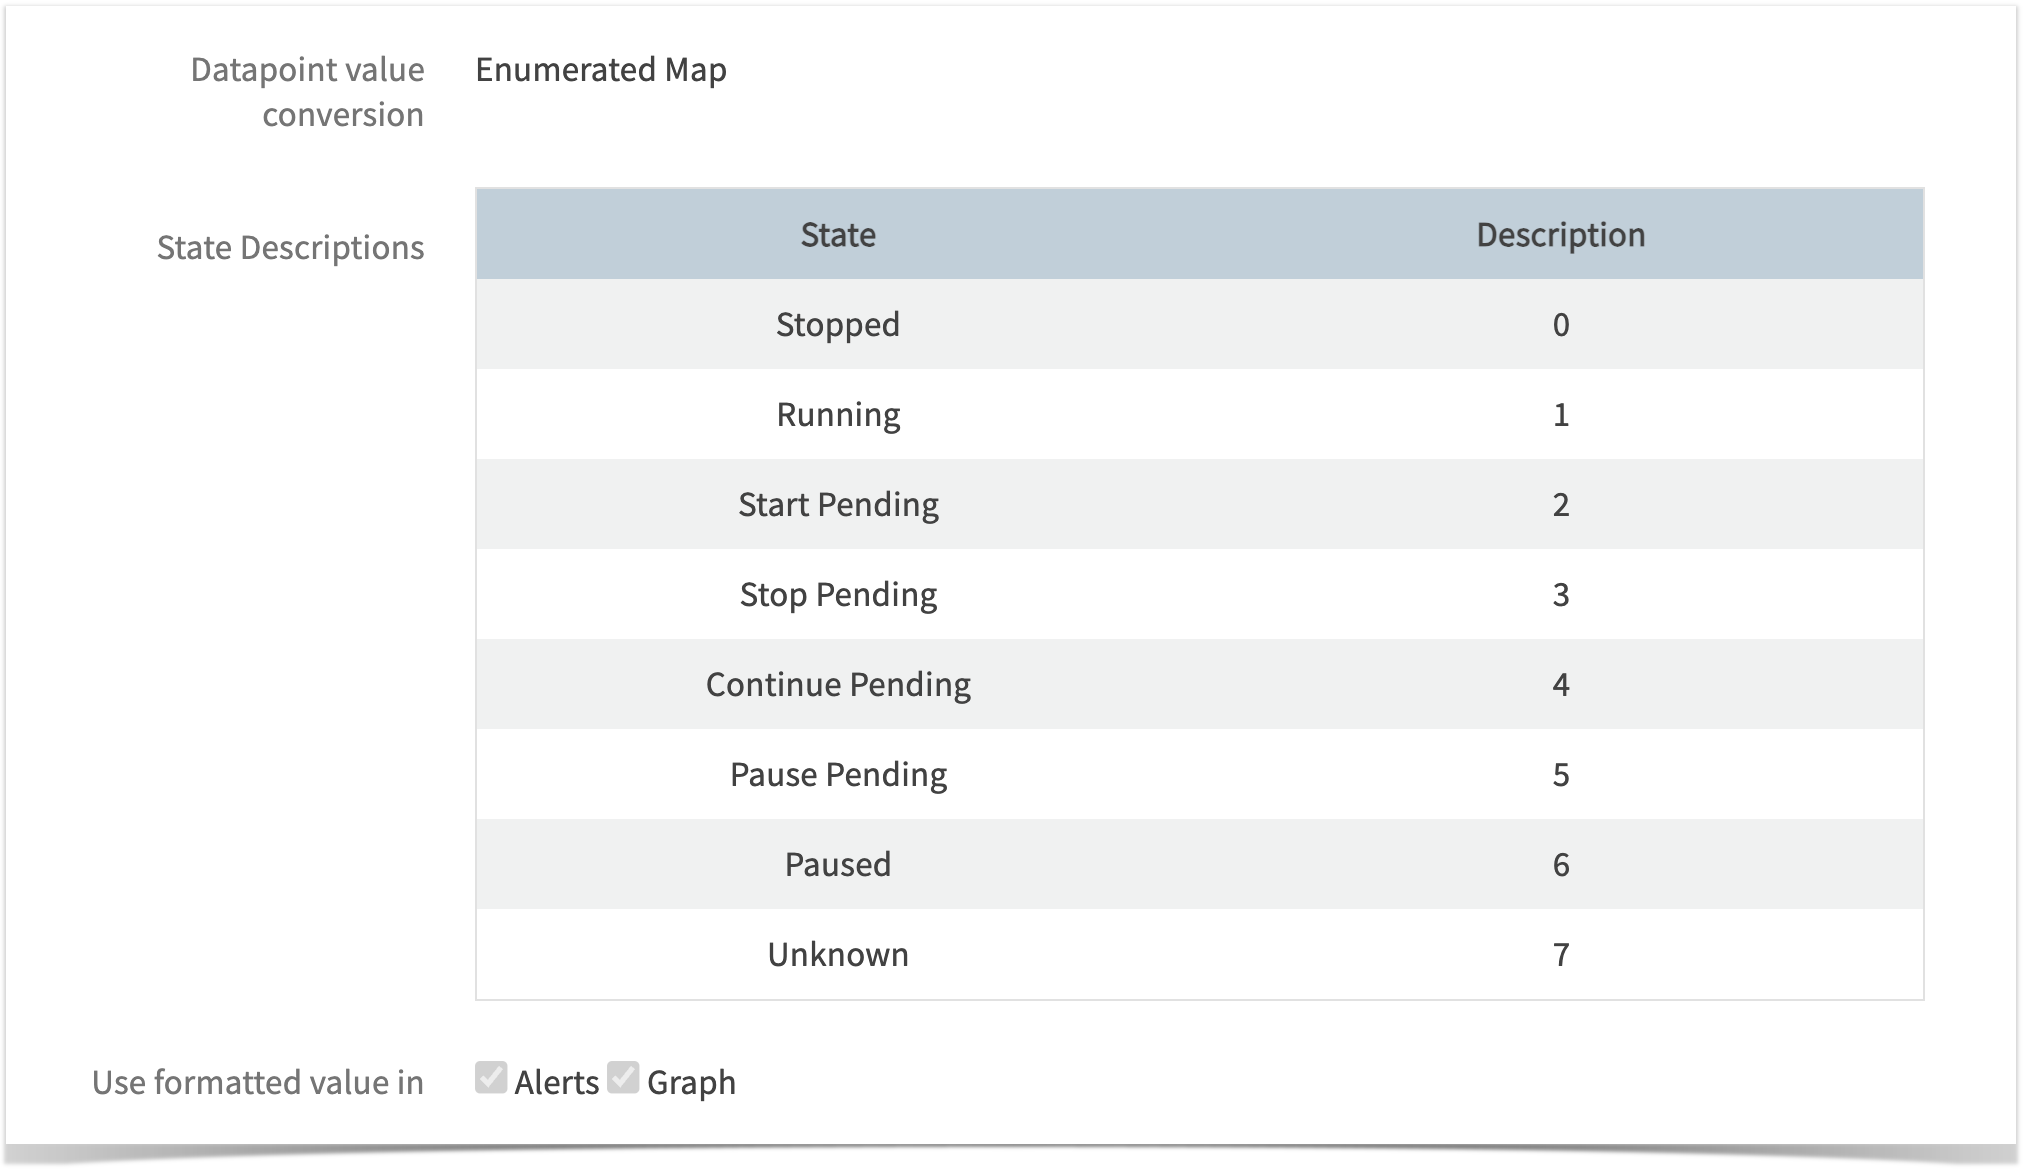
Windows Services Monitoring Use-Case:
This real-time use-case demonstrates the use of Enumerated Map option in RSE.
Step 1:
First, create the necessary metrics for the RSE script. In this use-case, we will create a metric named System_Windows_Service_Status_Ext.
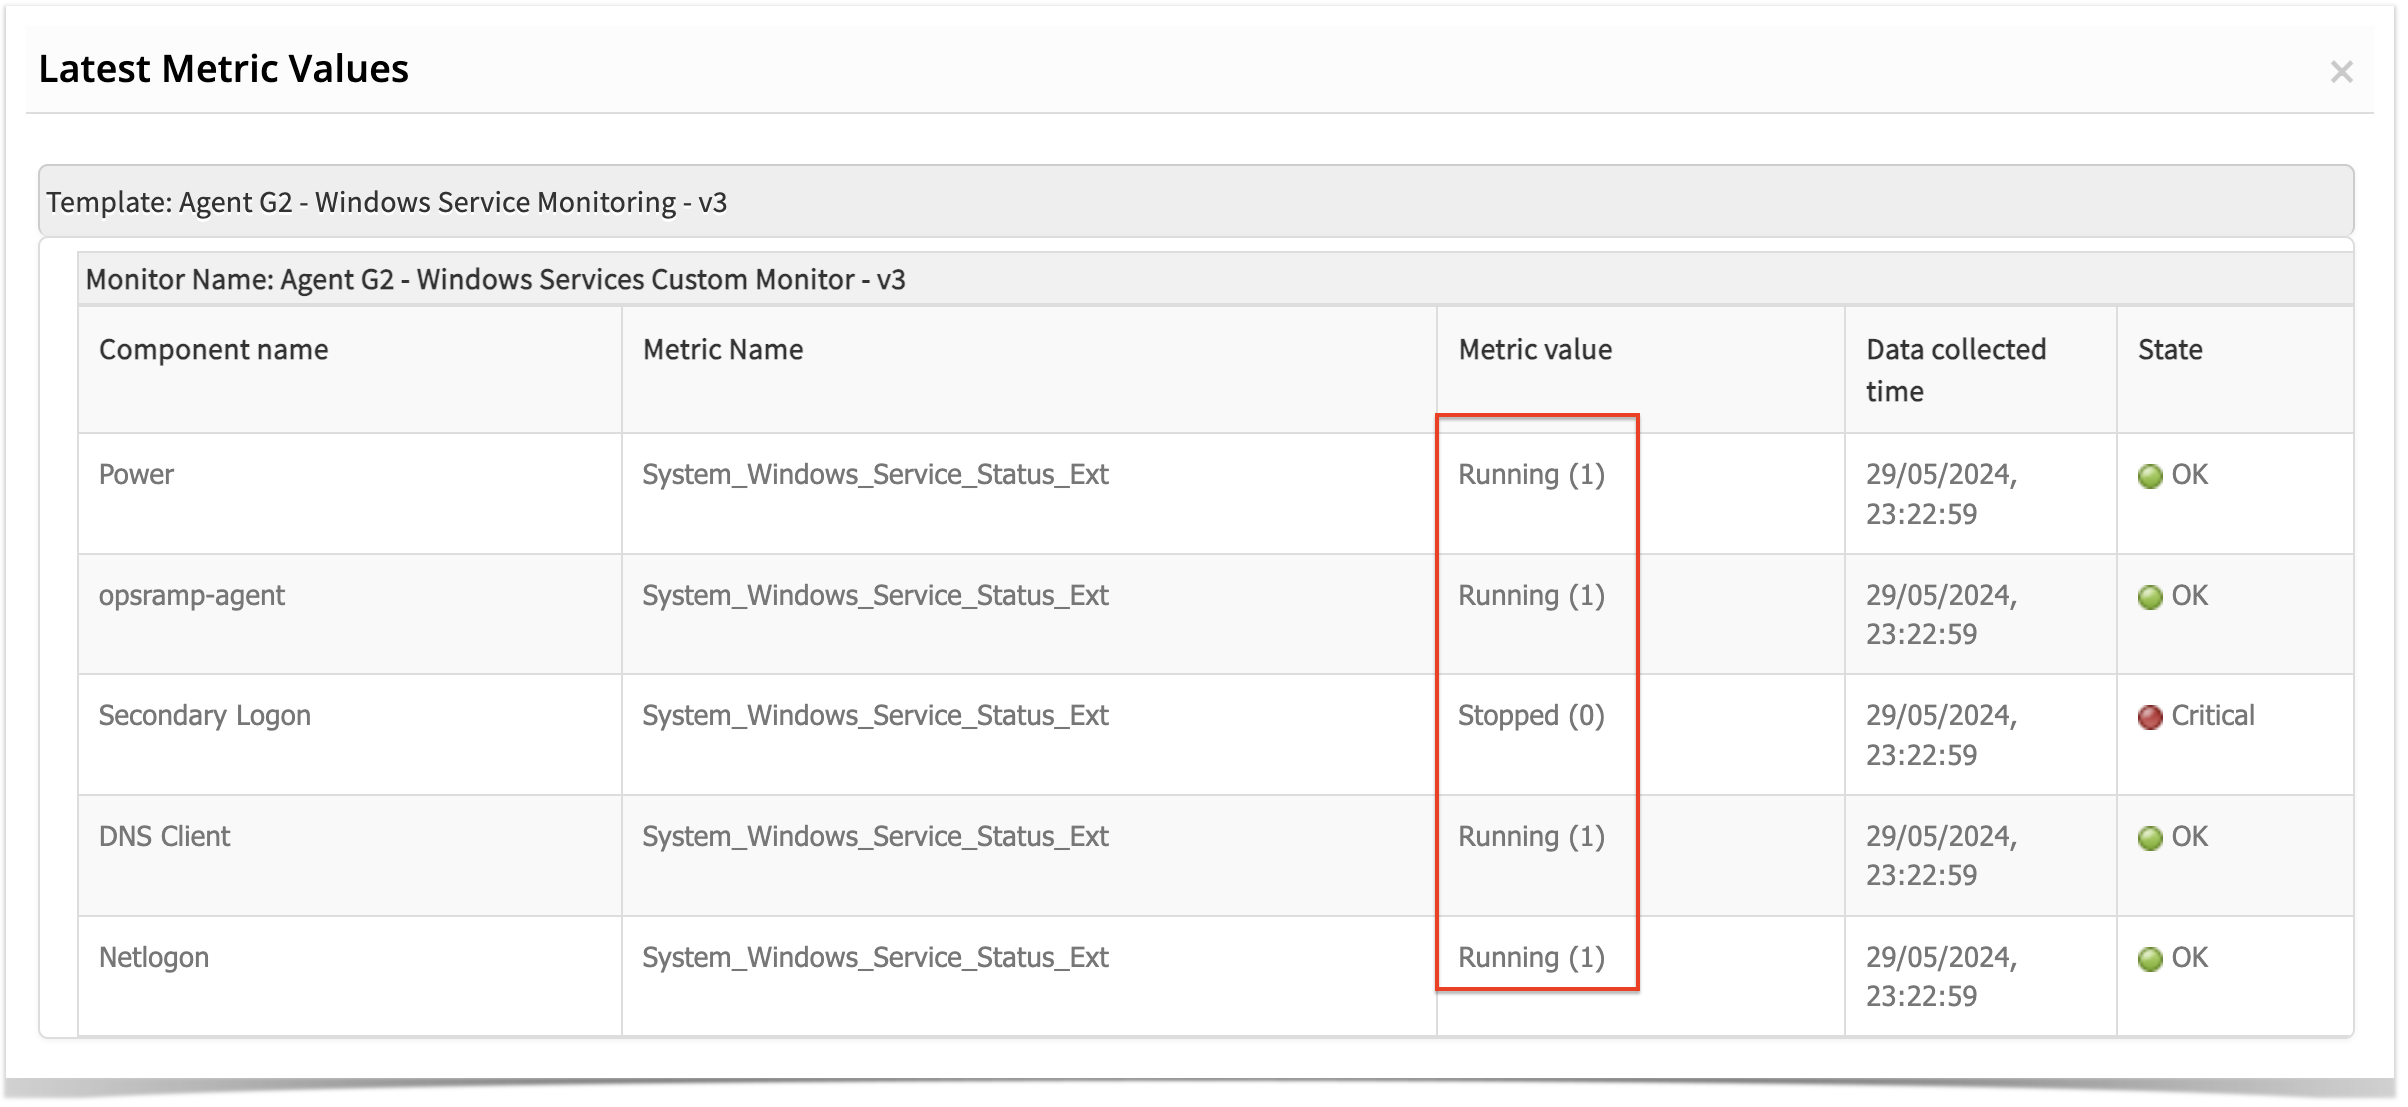
Here, since the metric returns only string values representing the service’s state, we have defined an Enumerated Map. For each possible string value, we provided the corresponding unique integer representation while creating the metric as follows:
We configured a Critical alert for the metric, using State column value, as shown below:
Step 2:
On the MONITOR page,
Under Metrics section, add the above created metrics.
Under script section, paste the below RSE Script.
Sample Script:
$customArgs = ${custom.script.arguments}
$servicesHash = @{}
$metricName = "System_Windows_Service_Status_Ext"
$finalJsonOutput = @{$metricName = @{}}
$global:scriptExceptions = @{}

Function Normalize()
{
  param([String]$str)
  $str = $str.Trim()
  $str = $str.Replace('"', '\"')
  $str = $str.Replace("\", "\\")
  Return $str
}

If (($([Int]$customArgs.Length) -eq 0) -or ($([String]$customArgs) -eq "Custom Script Arguments") -or ($($([String]$customArgs).Trim()) -eq ""))
{
  $exceptionMsg = @{
    "subject" = "Unable to fetch the monitoring data."
    "alertState" = "critical"
    "description" = "Failed to collect data for following metrics. `n metricName: $metricName, FailureReason: empty or invalid arguments"
    "logRequired" = $TRUE
    "raiseAlert" = $TRUE
  }
  $finalJsonOutput["scriptExceptions"] = $exceptionMsg
  $exceptionJson = @{ "scriptExceptions" = $finalJsonOutput["scriptExceptions"] } | ConvertTo-Json -Compress
  Write-Host $exceptionJson
  exit
}


Try
{
  If ($finalJsonOutput["scriptExceptions"]) {
    # If script exceptions are already set, skip the main logic
    throw "Script exceptions encountered, skipping main logic."
  }

  If($([String]$customArgs).contains(","))
  {
    $servicenamePattern= $([String]$customArgs) -split ',' | ForEach-Object { $_.Trim() }
  }
  Else
  {
    $servicenamePattern = @($([String]$customArgs))
  }

  ForEach($pattern in $servicenamePattern)
  {
    If($([String]$pattern).Trim() -eq "")
    {
      continue
    }
    $serviceColItems = Get-WmiObject win32_service -namespace root\cimv2 -ErrorAction Stop | where-object{$_.Name -Match $pattern} | select Name, DisplayName, State

    ForEach($serviceColItem in $serviceColItems)
    {
      $componentName = Normalize "$([String]$serviceColItem.DisplayName)"
      $metricValue = $([String]$serviceColItem.State)

      $servicesHash[$componentName] = $metricValue
    }
  }
   $finalJsonOutput[$metricName]["components"] = $servicesHash
}
catch
{
  $exceptionMsg = @{
    "subject" = "Unable to fetch the monitoring data."
    "alertState" = "critical"
    "description" = "Failed to collect data for following metrics. `n metricName: $metricName, FailureReason: $($_.Exception.Message)"
    "logRequired" = $TRUE
    "raiseAlert" = $TRUE
  }
  $global:scriptExceptions += $exceptionMsg
}

# Check for script exceptions after the last try-catch block
if ($global:scriptExceptions.Count -gt 0) {
    $finalJsonOutput["scriptExceptions"] = $global:scriptExceptions
    $exceptionJson = $finalJsonOutput["scriptExceptions"] | ConvertTo-Json -Compress
}

$services_details = $finalJsonOutput | ConvertTo-Json -Compress
write-host $services_details
Step 3:
Create the template with above created metrics and monitor.
Step 4:
Assign the template to any device.
Below is the JSON output for the script without any exceptions:
Below is the JSON output for the script with exceptions:
{
  "scriptExceptions": {
    "subject": "Unable to fetch the monitoring data.",
    "alertState": "critical",
    "description": "Failed to collect data for following metrics. \n metricName: System_Windows_Service_Status_Ext, FailureReason: empty or invalid arguments",
    "logRequired": true,
    "raiseAlert": true
  }
}
Below is the screenshot demonstrating how both the string value and its corresponding integer are displayed in Metric value column, when fetching the latest metric values.
Below are screenshots of how the Enumerated Mappings are displayed in graphs and alerts:
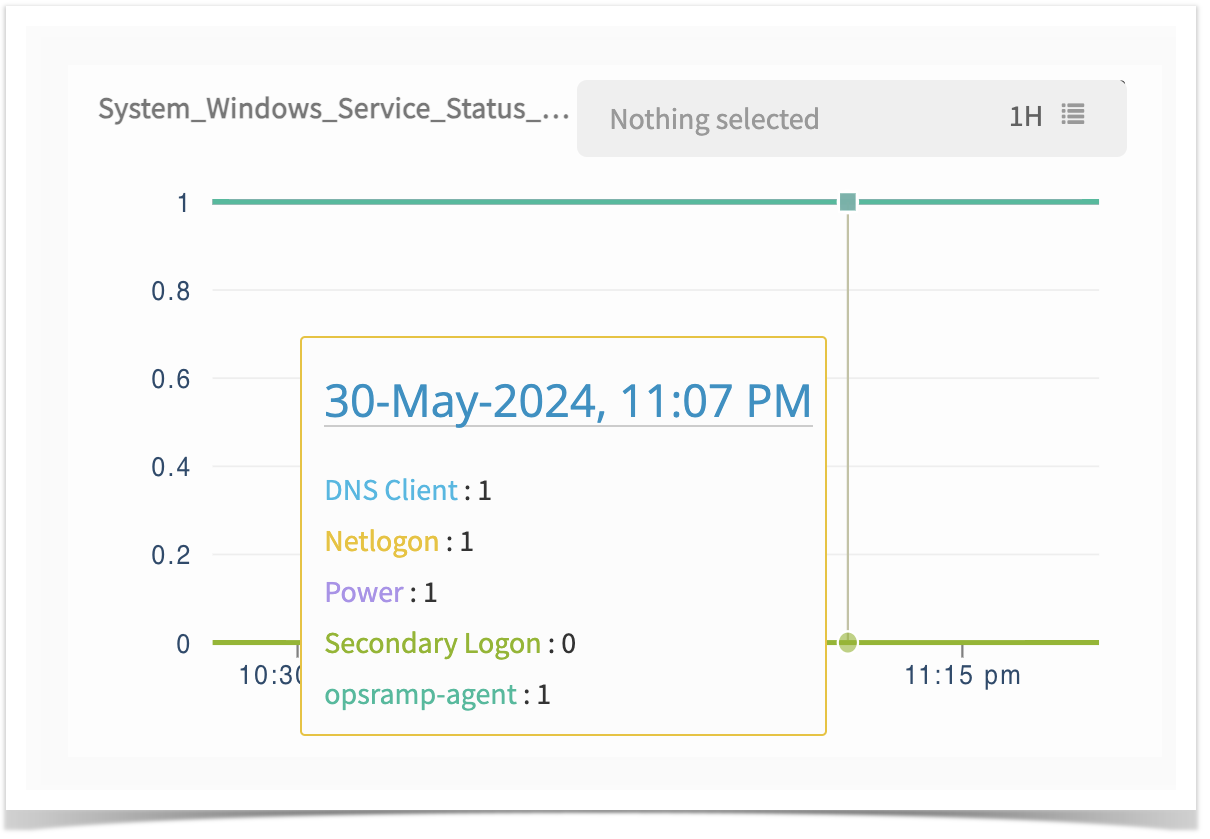
In Graph:
In the screenshot above, we can observe that as defined in the Enumerated Map, the value 0 corresponds to the “Stopped” state of a service, and the value 1 corresponds to the “Running” state.
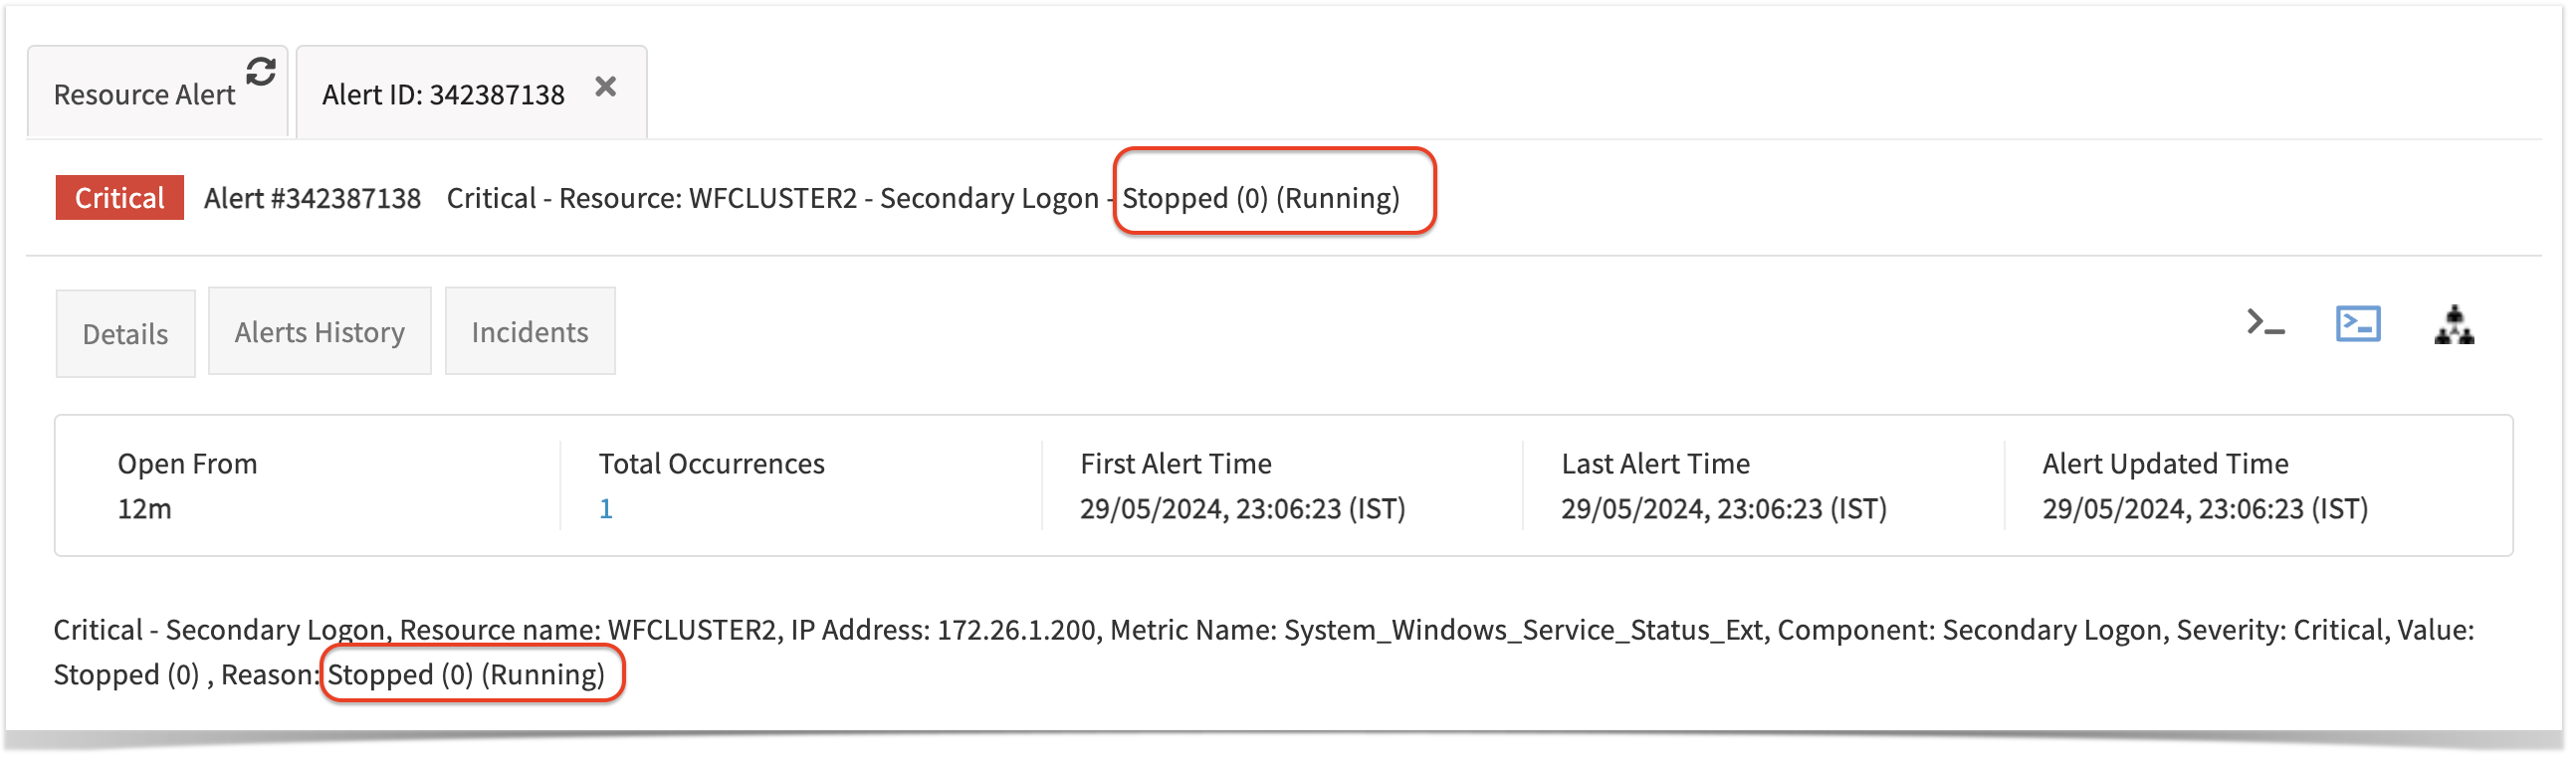
In Alert:
In the screenshot above, we can observe that the metric value displayed as Stopped (0), and the threshold configured as Running for Critical alert. According to the configured thresholds, if the metric value does not equal Running, a critical alert will be triggered, as shown in the screenshot above.
Because we defined 0 for the Stopped state and selected both the alerts and graph checkboxes while defining the Enumerated Map, we can see both the string value and its corresponding integer in the alert as well as in the graph.
SSH Credentials should be assigned on the End device itself, not on the Gateway.
Checking Monitoring Config:
To check the updated monitoring configuration pushed to gateway, use the following command. This needs to be executed on gcli prompt only.
syntax: syntax : flag add mon.conf.json on <Log enabled for number of minutes>
Example command: flag add mon.conf.json on 30
After enabling the above flag, Monitoring configuration file has been created in the gateway at this path /var/log/app/tmp/.
File format: monconf-<timeStamp>.json
Example filename:monconf-1711003657507.json
Windows & Linux RSE
Use Case 1
Unable to fetch latest metrics data
When you apply Gateway-based RSE template on a Windows device and encounter the message “Failed to get latest metrics/Gateway is offline”, while fetching latest metrics data, follow the below steps:
Step 1:
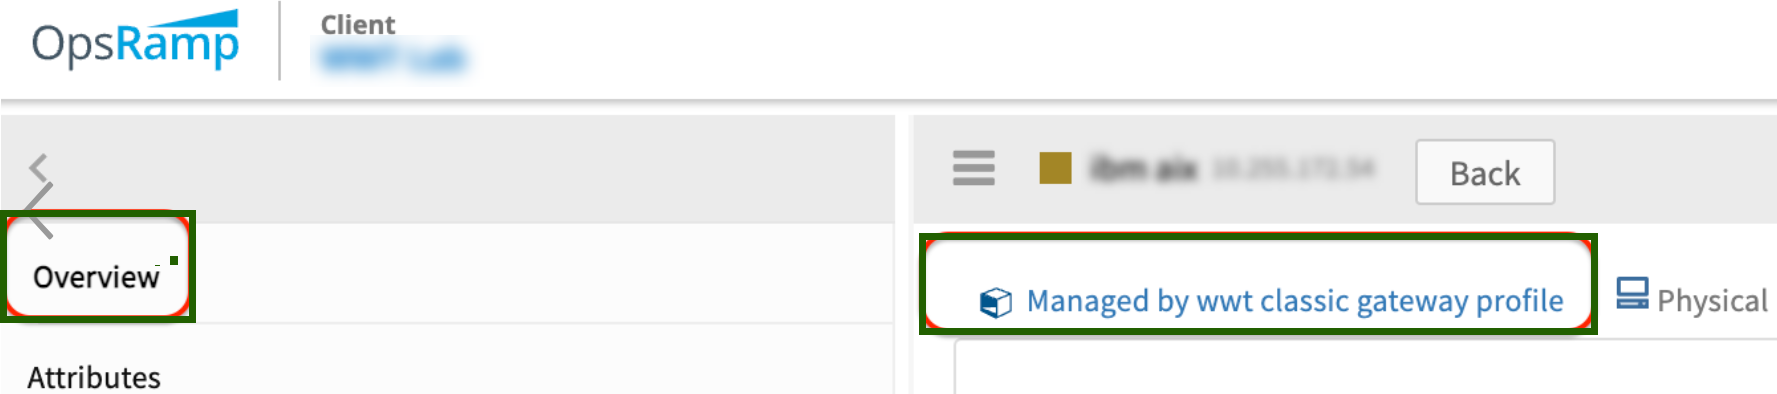
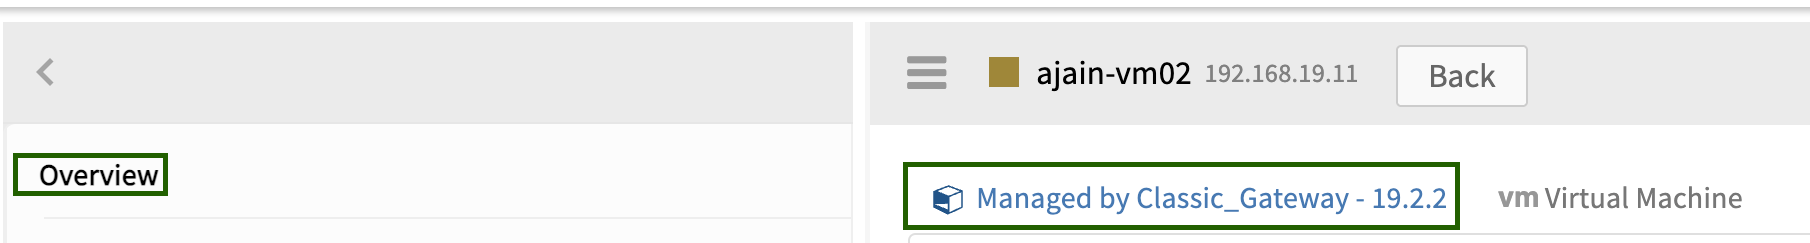
Navigate to the Overview page of the Device (Infrastructure > Resources > Search using IP or Device Name ) and on that device ensure that the device is managed by Gateway and it is online (indicated by blue color as shown below).
Step 2:
Identify whether a template is global or customer written.
To determine if a template is global or custom-written, refer to FAQ #3.
Step 3:
Alerts Types:
Review any alerts associated with the template on the Overview page of the Device (or) navigate to Command Center > Alerts page and filter using the specific server name or Ip address. Common alert subjects to look out are as follows:
i. There are two cases as mentioned below:
Case I: InvalidJsonException: Validate your Script Output. (Metric Name is rse.invalid.json.error )
Case II: ScriptExecutionFailureException: Failed to execute the Script.Validate your Script. (Metric Name is rse.script.error or rse.script.timeout.error)
When encountering such errors within global templates, follow below steps:
Ensure that input parameters are provided to the template in the Input Parameters section according to the Template Usage Guidelines or the Template description, if any.
If custom script Type is selected, make sure that the script execution path is valid.
Ensure that the server meets the pre-requisites mentioned in the Template’s pre-requisites section, if any.
If the input parameters are provided as per the Template Usage Guidelines and Pre-requisites are met, then raise a case by manually executing the script and retrieving both the script output and debug level agent logs as mentioned in step #4.
When you encounter such errors in customer-written scripts, follow below steps:
Advise customers to ensure that the final script output adheres to one of the JSON output formats mentioned in the link
In Script failure exception cases, look for the proper error message given in alert description and rectify the code accordingly.
If custom script Type is selected, make sure that the script execution path is valid.
ii. No Credentials found against the Device of Type: SSH ( Metric Name is rse.no.credentials.error )
To resolve this issue, check the following when you observe such alerts:
Credentials are not attached to device.
Attach credentials of type SSH, if remote operating system is Linux or Unix.
Attach credentials of type Windows, if remote operating system is Windows.
iii. Macros related errors ( Metric Name is rse.unresolved.macro.error )
To resolve this issue, check the following when you observe such alerts:
The macros used in the script are not resolved.
The credentials used in the macros are not available on the device.
The customAttributes used in the macros are not available on the device.
iv. Device connection errors ( Metric Name is rse.device.connection.errors )
To resolve this issue, check the following when you observe such alerts:
The device should be reachable from Gateway.
The port should be accepting the connections.
The Credentials attached to this device are valid.
If Credentials are Key based, evaluate your private key.
v. Authentication errors ( Metric Name is rse.authentication.error )
To resolve this issue, check the following when you observe such alerts:
If OSType is WINDOWS:
Credentials attached to this device should be valid.
WinRM Service should be enabled on Gateway or Remote Device.
WinRm Service should be allowed through Firewall on Gateway or Remote Device.
If OSType is not Windows:
The following may be one of the reasons for this alert:
Credentials attached to this device are not valid.
If credentials are Key based, evaluate your private key.
vi. Handling Other Alert Subjects returned from scriptExceptions ( Metric Name is rse_metric_collection_failures )
For alerts with subjects like “An exception has occurred. Unable to fetch the monitoring data,” typically encountered in global templates due to exception handling mechanisms within scripts.
If you encounter alerts with descriptions such as “Empty/invalid input parameters,” “Unable to load PostgreSQL environment,” etc., follow these steps:
Check if input parameters are provided to the template in the input parameters section according to the Template Usage Guidelines or Template description.
Confirm that the server meets any pre-requisites mentioned in the template’s Pre-Requisites section, if any.
Step 4:
Gather debug-level logs as depicted below:
For Windows:
Enable Debug Mode for Logs:
Access the Gateway Command Line Interface (gcli) by running: telnet localhost 11445
Use the following commands to enable the required flags:
syntax : flag add rse.log on
flag add rse.log on 30
flag add rse.script.log on 30
Retrieve Logs:
Check the latest logs: C:\Program Files\OpsRamp\Gateway\log\vprobe.log
Get that log folder in ZIP format with respective team for further analysis(C:\Program Files\OpsRamp\Gateway\log).
For Linux:
Enable Debug Mode for Logs:
Enter gcli mode by running command: gcli
Execute the following commands to enable flags:
syntax: flag add rse.log on
flag add rse.log on 30
flag add rse.script.log on 30
Retrieve Logs:
Exit gcli and run the following command to observe logs:
sudo tail -100f /var/log/app/vprobe.log
After following the above steps for different errors, if the issue still persists, then raise a case with your findings, while sharing that log folder in ZIP format with the respective team for further analysis(/var/log/app).
Use case 2
Graph data is not populating for specific or all metrics.
This section helps you to troubleshoot the common issues encountered while using Gateway-based RSE templates on Windows or Linux devices. Each use case below provides step-by-step solutions for identifying and resolving common RSE errors.
Use Case 1: Unable to Fetch Latest Metrics Data
If you see the message Failed to get latest metrics / Gateway is offline after applying a Gateway-based RSE template, follow these steps to troubleshoot.
Step 1: Verify Device and Gateway Status
Navigate to Infrastructure > Resources.
Search for the device by its IP address or Name.
In the Overview section, confirm that:
The device is managed by a Gateway.
The Gateway is online, indicated by a blue icon on the device’s overview page.
Tip
A gray icon indicates that the Gateway or device is offline, which can prevent metrics from being fetched.
Step 2: Identify the Template Type
Determine if the template is:
Global (provided by OpsRamp)
Custom Template (created by the customer)
🔍 Refer to FAQ 3 for guidance on identifying template types.
This helps decide whether the issue needs to be addressed by the Customer or OpsRamp Support.
Step 3: Review Alert Types
Check for alerts related to the device:
In the Overview section, or
Go to Command Center > Alerts, and filter by Device Name or IP address.
Check for alert subjects related to RSE metrics. The following cases cover the most common alert scenarios.
flag add rse.log on 30
flag add rse.script.log on 30
Retrieve logs from:
C:\Program Files\OpsRamp\Gateway\log\vprobe.log
Zip and share the log folder:
C:\Program Files\OpsRamp\Gateway\log
For Linux
Enter GCLI:
gcli
Enable debug flags:
flag add rse.log on 30
flag add rse.script.log on 30
Retrieve logs:
sudo tail -100f /var/log/app/vprobe.log
Zip and share:
/var/log/app
If the issue persists
Raise a case with OpsRamp Support, including the zipped log folder and script output for further analysis.
Use Case 2: Graph Data Not Populating for Metrics
Step 1: Check Data Retrieval
Go to the latest snapshot data for the metric.
Confirm whether the metric is retrieving data from the end device.
If no data is retrieved, refer to Use Case 1 for resolution.
Step 2: Verify Graph Settings
Check if the graph is enabled at the metric level.
If it’s disabled, enable it and recheck the graph.
Step 3: Inspect Data Type
If data is retrieved, check the data type in the latest snapshot.
If the value is a string, proceed to the next step.
Step 4: Check Enum Mapping
Verify if Enum Mapping is defined for the string value at the metric level.
If Enum Mapping exists, the graph should populate correctly.
Step 5: Handle Missing Enum Mapping
If Enum Mapping is not defined, follow based on template type:
Global Template:
Raise a support case.
Attach:
Screenshot of latest snapshot data
Screenshot of Enum Mapping defined at the metric level
Customer-Written Template:
Advise the customer to:
Edit the metric
Add the new string value in the State Descriptions field
Use Case 3: Gaps in Metric Graphs
Possible Reasons:
The Agent might have been offline.
The Device might have been offline.
No data was available for the metric at that time.
Solution:
Look at debug-level logs to see if the Agent or Device was offline during the time gaps appeared.
If no relevant logs are found, raise a support ticket with your findings and attach the available logs for analysis. This will help the support team review the command or script behavior during the specific time when the graph data was missing.
Use Case 4: Alerts not Generated for Specific Metrics
Step 1: Check Snapshot Data
Look at the latest snapshot for the metric.
See if any data is being collected from the device.
Step 2: Check Thresholds
Make sure thresholds are defined correctly for the metric.
Alerts won’t trigger if thresholds are missing or misconfigured.
Step 3: Run Command Manually
If no data is coming in:
Run the command or script manually on the device.
Check if the metric returns any data.
Step 4: Raise a Case (if needed)
If the issue is still unclear:
Raise a support case.
Share your findings and include screenshots or logs.
Use Case 5: Alerts Do Not Match Defined Thresholds
Step 1: Understand Alert Threshold Priority
Alerts follow a specific order of precedence:
Template Level Thresholds
Set in the template.
Lowest priority.
Device Level Thresholds
Set on the device page.
Overrides template thresholds.
Device Component Level Thresholds
Set in the Monitors tab for each metric component.
Highest priority.
Step 2: Check Thresholds at All Levels
Review thresholds at:
Template level
Device level
Device component level
Make sure the correct threshold is applied based on the hierarchy.
Step 3: Raise a Case (if needed)
If alerts still don’t match the expected thresholds:
Raise a support case.
Share your findings and include screenshots or logs.
Use Case 6: Changes to Metrics or Monitors Not Reflected
After making changes to metrics or monitors:
For Metric-Level Changes
(Applies only to customer-created metrics)
Unassign the template from all devices.
Remove the monitor from the template and add a different one temporarily.
Go to the monitor and open the metric section.
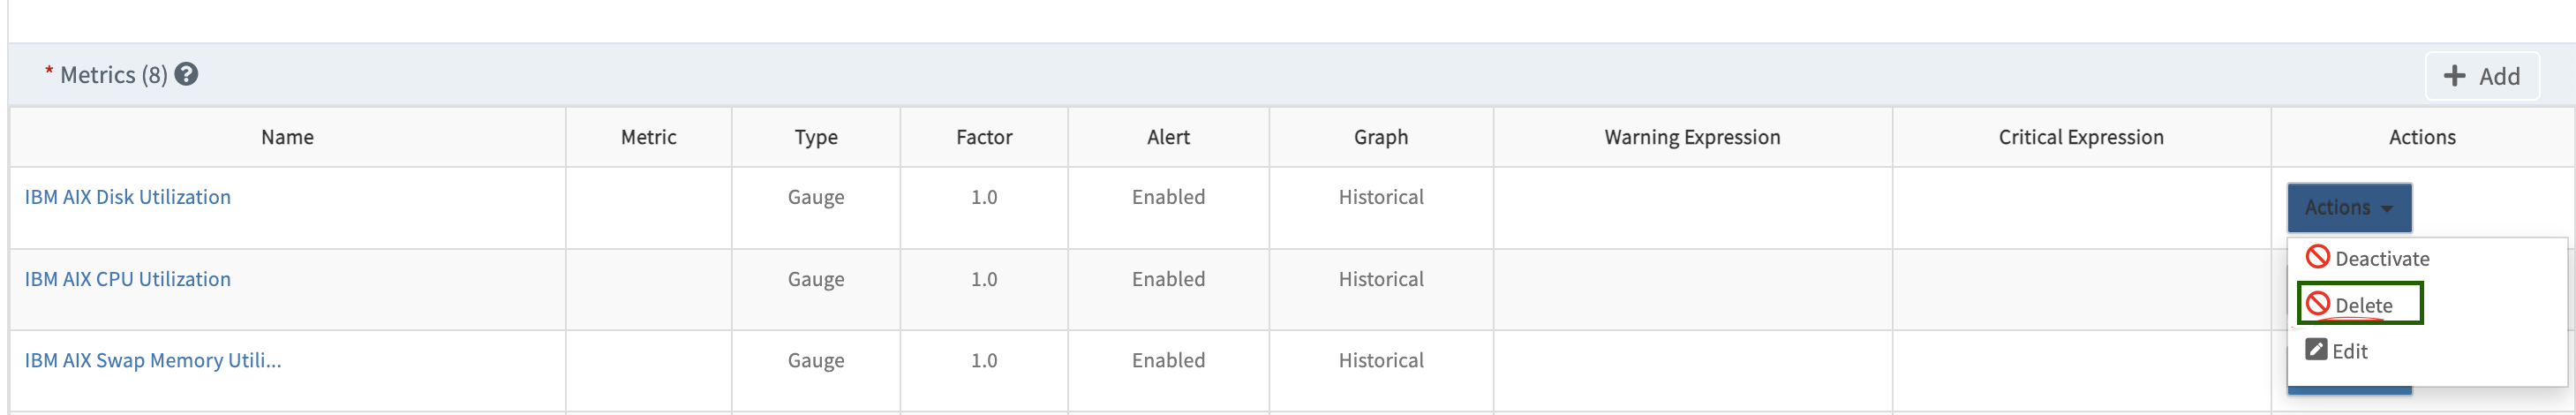
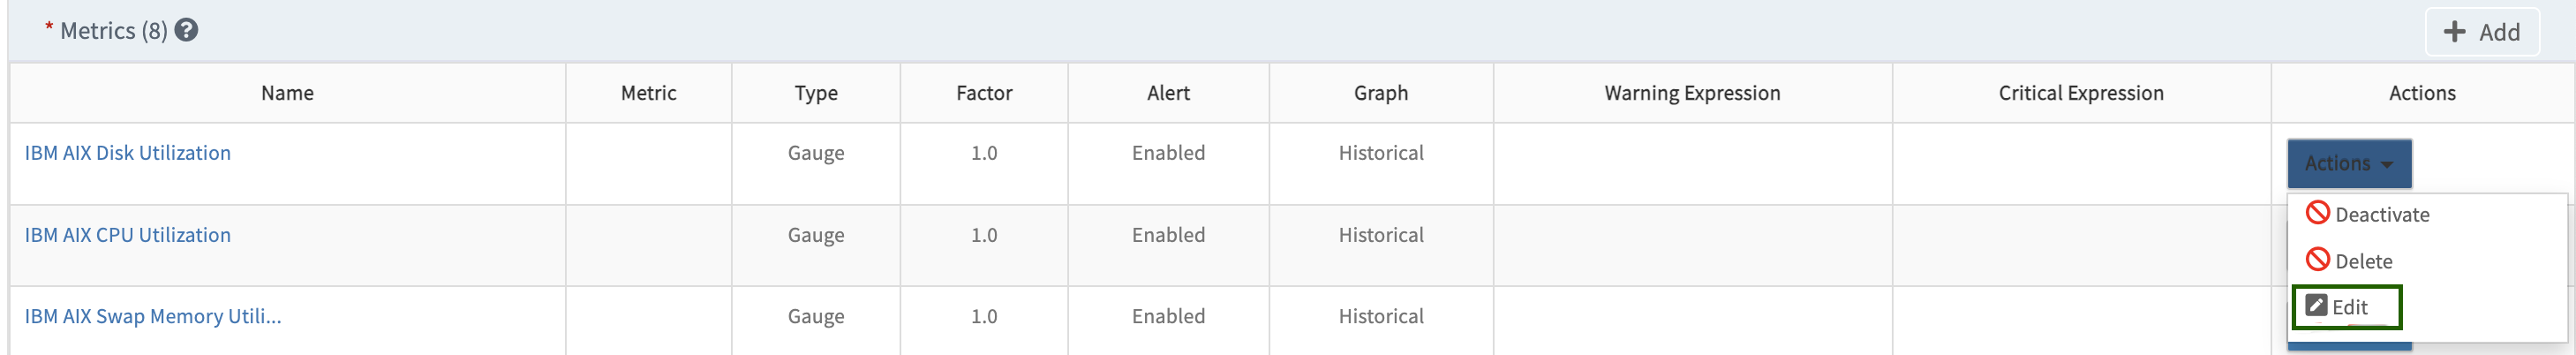
Click Actions on the updated metric and choose Delete.
Save the monitor.
Reopen the monitor, add the updated metric, and save again.
Reassign the monitor back to the template.
For Monitor-Level Changes
(Applies to custom monitors or copies of global monitors)
If you have changed the script or configuration, simply reassign the monitor to the template.
This will apply the latest changes.
Use Case 7: User Removed Metrics from a Monitor
Step 1: Understand the Impact
If a customer clones a monitor and removes metrics directly from it, it can cause errors.
This happens because the metric mappings at the monitor level may break.
Step 2: Recommended Approach
Do not remove metrics directly from the monitor.
Instead, remove unwanted metrics during template creation.
This ensures proper mapping and avoids errors.
Gateway G2 RSE FAQ’s
1. Why am I seeing “Invalid JSON” or “Script Failure” alerts on the Device Overview page?
Refer to the Alert Types section in the Troubleshooting.
For general needs: Submit a Request for Enhancement (RFE).
For customer-specific needs: Develop your own script using RSE documentation.
3. Does RSE support network devices?
RSE supports network devices with Bash or Python environments.
Ensure SSH credentials are configured on the device.
4. How to identify if a template is global or customer-written?
The details available in the G2 Template documentation, only pertain to Global Templates and Metrics.
5. How to choose the correct JSON format when writing custom scripts?
Run the command manually on the device and format the output as per supported JSON formats:
Agent Based RSE
Note
JSON formats are the same for both Agent and Gateway collectors.
6. How to capture logs and generate alerts for script failures in custom scripts?
To capture additional logs and generate alerts for script failure reasons, in customer written scripts, users can utilise the scriptExceptions option of RSE. Refer RSE documentation
7. Where to start when developing custom G2 monitoring using RSE?
8. Why is latest metric snapshot data missing from the template?
Refer to Use Case 1 in the Troubleshooting section.
9. How to plot graphs for string values like health or status?
To plot graph for state or status-related metrics returned as strings, utilise the Enumerated Map option in RSE. This needs to be defined at the metric level by selecting Datapoint Value Conversion as Enumerated Map. Refere to RSE documentation.
10. What to do when script argument macro errors appear in alerts?
CCheck if macros are being properly used in script at monitor level. Refer RSE documentation.
For gateway templates enable below flag in GCLI and then we can see replaced script in logs, there we can see if macro values are properly replaced or not in the script. flag add rse.script.log on 1440
For Agent templates, refer to Alert Types Troubleshooting section.
11. What to do when credential-related macro errors appear in logs?
Check if credential related macros are being properly used in script at monitor level. Refer RSE documentation.
For Agent templates, refer to Alert Types in Troubleshooting section.
12. Why are metric or monitor changes not reflected in template data?
Refer to Use Case 6: Metric or Monitor Changes for detailed steps in Troubleshooting section
13. How to exclude certain components from metric monitoring?
If User wants to exclude monitoring some components of metric, use Component Filters option in RSE to include or exclude specific components.
By using these component filters, you can monitor specific components or ignore unwanted components from monitoring.
Refer to documentation on how to use RSE Component Filters.
14. Why am I seeing authentication error alerts (SSH or Database) on the Device Overview page?
If there are any database related templates are assigned on device( Agent or Gateway ), make sure that respective credentials of type Database must be assigned on device.
For Agent based Template: refer to Alert Types in Troubleshooting section.
15. How can I add extra information to alert subject or description?
In order to provide extra information about the metric in alert subject or alert description, use Alert Tokens feature of RSE.
Make sure that the alert tokens output falls under one of the supported Alert Tokens formats mentioned in documentation(Formats 4, 5, & 6), refer G2 Custom Monitor documentation.
For more information on Alert Tokens (i.e. how to use them), refer to Generate Alert Tokens in RSE documentation.
16. Alerts are not getting generated for a specific metric. What should I check?
Refer to the Use case 4 in troubleshooting section.
17. What if I see command execution errors like permission issues in alert descriptions?
Ensure the Agent or Gateway has the required permissions to run the script commands on the device.
18. Alerts are not matching the defined thresholds. Why?
Refer to the Use case 5 in troubleshooting section to understand threshold precedence.
19. How can I view the queries or commands used in a template?
If customer wants to know the queries or commands used in RSE template, create a copy of global monitor and see the queries or commands used, and then delete that copied monitor if its not needed anymore.
If the command \ query used is still not clear, then raise a JIRA with respective team / template owner.
20. How can I customize the alert subject and description for a global metric?
Copy the Global Monitor Follow the steps in Copy a Monitor to create a copy of the required global monitor.
Edit Metric Details
Go to the Setup page of the copied monitor.
Under the Actions tab, click Edit for the metric you want to modify.
Update Alert Information: In the Edit window:
Enter your custom message in the Subject field to update the alert subject.
Enter your preferred text in the Description field to update the alert description.
Apply Changes
Save the updates.
Add the copied monitor to the relevant template for the changes to take effect.
Note
From the same Edit window, you can also update the metric units if required.
21 What is the maximum character limit for template input parameters?
You can pass up to 65,535 characters as input parameters.
22. Can I assign multiple versions (v1, v2, v3…) of a template to the same device?
No. Always use the latest version of the template, as it includes improvements and bug fixes.
23. What values can be returned as metric/component outputs?
Component values should be limited to either a string representing a state/status or an integer, which can be used for configuring alerts relevant to monitoring.
Other values, such as IP addresses, time formats, or strings that represent names (other than state/status), should be included in alertTokens as additional information related to the metric/component. This extra information will only be displayed when an alert is triggered for the corresponding component/metric.
For detailed guidance on using alert tokens in RSE, refer to RSE documentation.
RSE Limitations and Challenges
Challenges across all script types
Can’t use 3rd party utilities with out additional installations in the end device.
Monitoring of Windows environment through Linux Gateway is not supported.
Challenges specific to script type for Gateway Collector Type
Bash – No support for arrays. It will treat array syntax as pre-defined macros available in RSE framework