The availability of multiple TCP ports can be monitored by TCP Port on a local or remote host. Response time thresholds can be set to monitor connectivity and raise critical alerts if it surpasses the configured threshold value. The TCP Port monitor is compatible with both Windows and Linux operating systems.
To check the connectivity between the port and a specific host, a TCP port monitor can be added using Setup > Monitoring > Templates > Other Monitors.
After applying the template to a device, the template can be validated if it is assigned to a resource.
Create TCP port monitors
Select a client from the All Clients list.
Go to Setup > Monitoring > Templates.
From TEMPLATES, click +Add. The monitor template is displayed.
From MONITOR TEMPLATE, enter:
Select Template Scope: The partner template or client-specific template. For the client-specific template, select the client.
Collector Type: The application type used to gather information. Select the agent.
Applicable for: The type of application.
Template Name: The name of the template.
Description: The summary of the template.
Generation: The generation that the template belongs to. For example, Generation 2.
Tags: The user-defined tags used for enhanced filtering.
Prerequisites: The essential prerequisites to consider while monitoring using a template.
Status: The active or end-of-life templates.
Notes: Additional information to add to the template.
Template Family Name: The category that applies to the application. For example, storage server and network server.
Deployment Type: Select one of the following methods to apply the template to resources:
- Custom
- Optional
- Standard
Click Save.
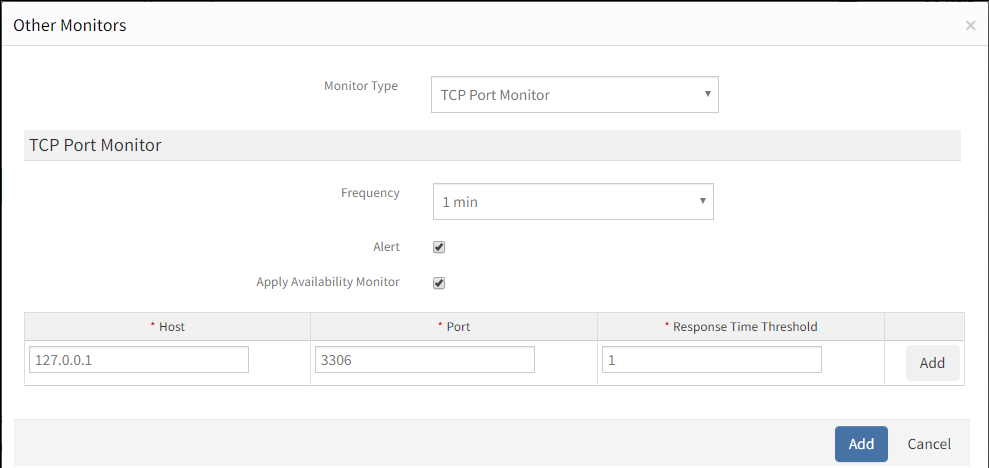
After configuring the template, go to Other Monitors and click +Add.
From the options displayed in the Monitor Type drop-down, select TCP port monitor.
From TCP Port Monitor, click Add to provide more detailed parameters. Click Add and Remove to increase or decrease the following settings:
- Frequency: The intervals used to monitor the connection. The recommendation is 15 minutes.
- Alert: Select Alert to get alerts for any match.
- Apply Availability Monitor: Select the checkbox to show the availability of the monitors.
- Host: The server IP address. The default is 127.0.0.1.
- Port: The server port.
- Response Time Threshold: The time taken to connect to the TCP port specified in seconds.
The MySQL port can be monitored from localhost: 127.0.0.1 and critical alerts raised if the response time surpasses the time provided in seconds.
After adding a template with a TCP port monitor, assign the template to a device to start monitoring.
Manage TCP port monitors
TCP port monitor details can be viewed and modified when added to a template. Do the following actions to manage the TCP port monitor:
- Edit: Click the template name displayed on the templates screen to change the monitor details.
- View: View the monitor details in the templates screen. Click the arrow next to the template name to view the TCP port monitor added to the current template.
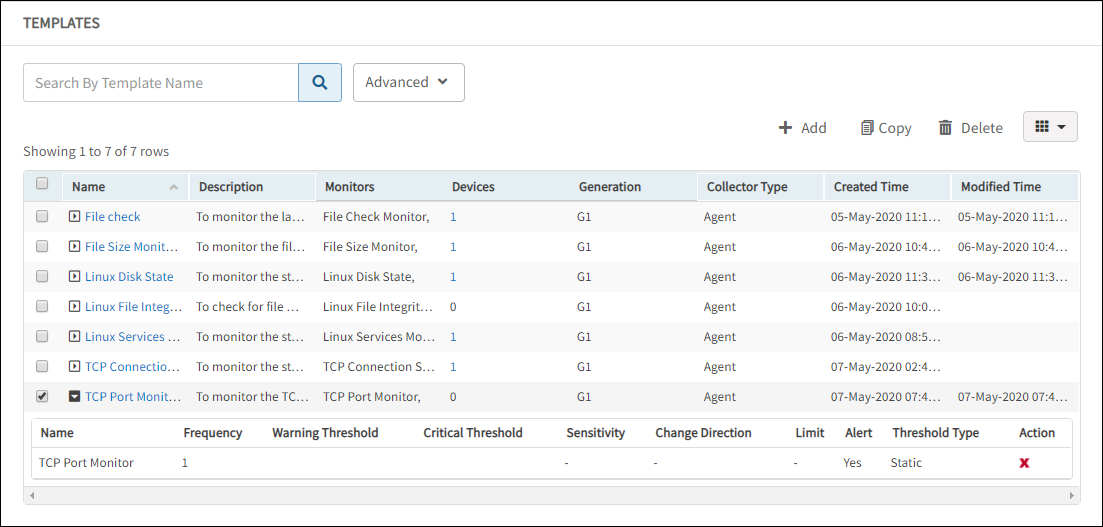
Validate template
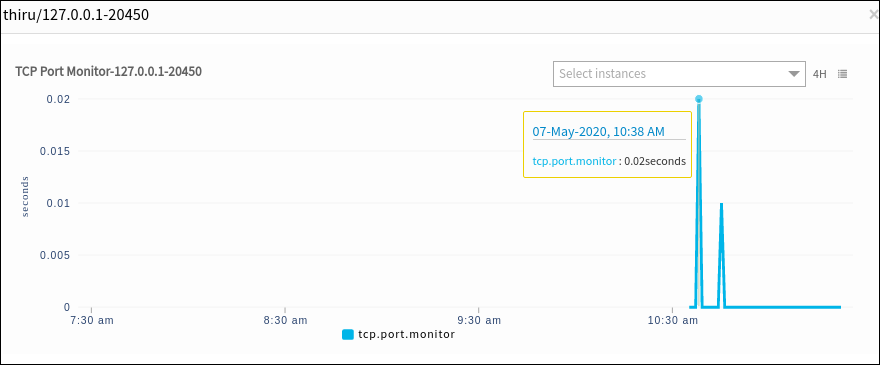
The graphical data is displayed for each name configured in the TCP port monitor. Monitor graphs can be viewed under Infrastructure > Resources > Device Details > Metrics. Only one graph is displayed for all configured names in an individual TCP port monitor. The graph displays the monitor details based on response times.