Add Metric
To add metrics, click +Add in the Metrics section. The system redirects to the Add Metric page, where you can configure the required metric details for monitoring.
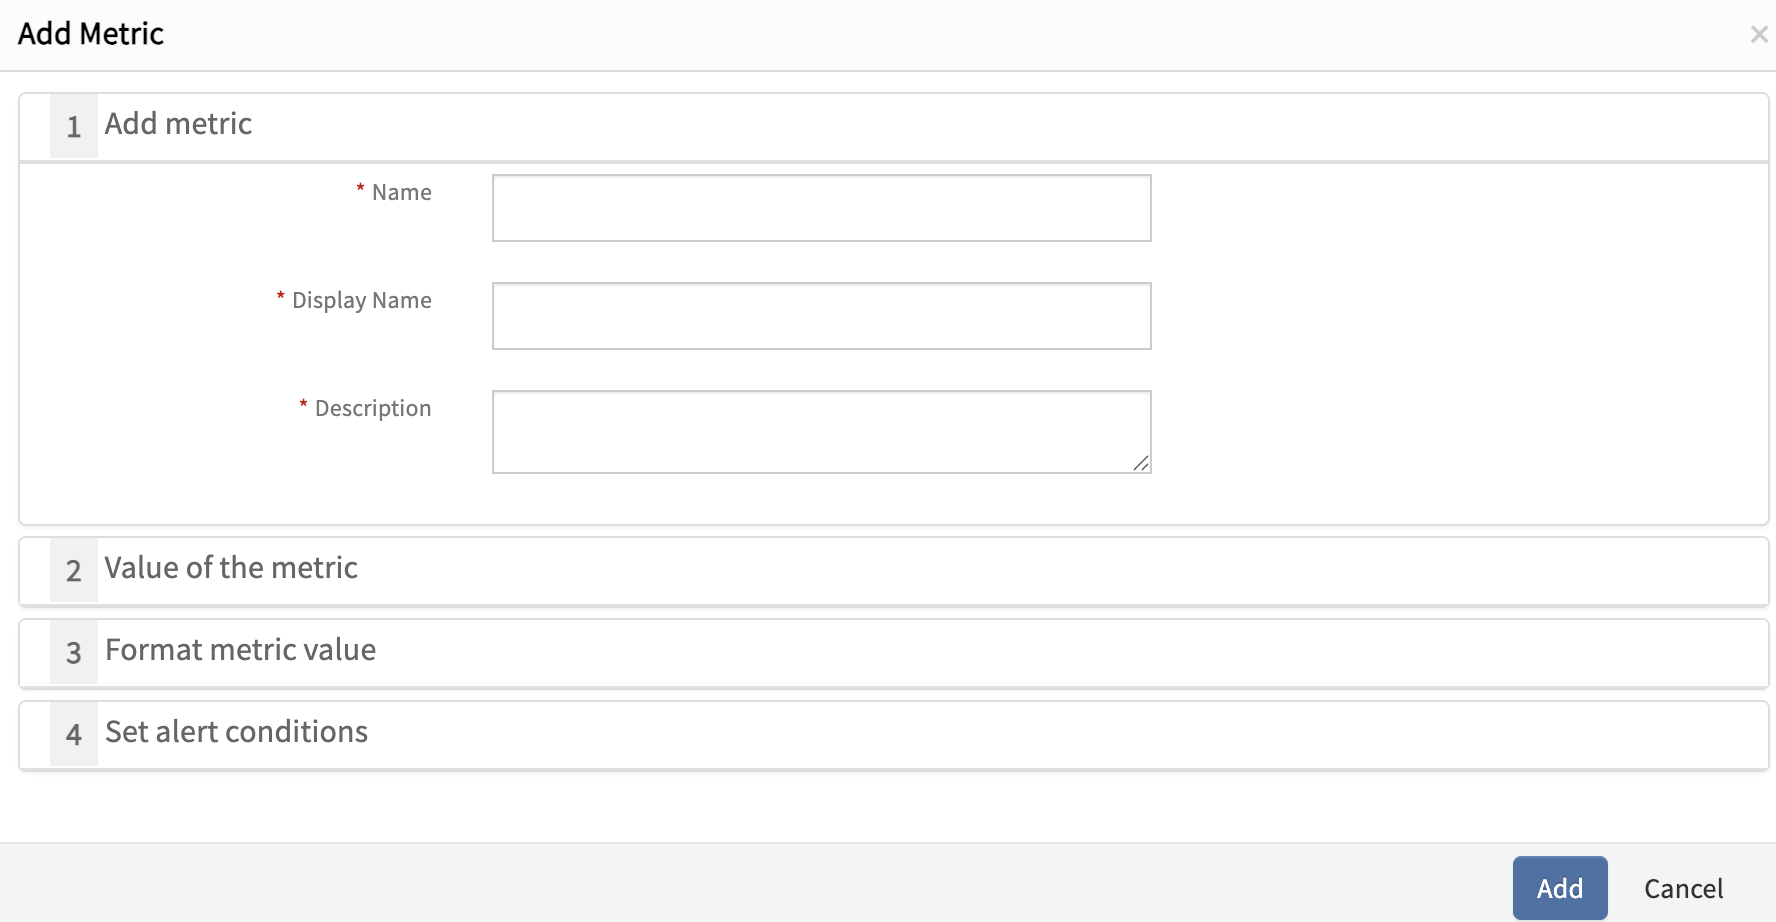
The following are the parameters required while defining a metric:
Name
Specifies the unique name of the metric, which is used to identify the metric and is displayed on graphs.
Example: cisco_nexus_switch_cpu_Utilization
Metric Naming Best Practices
Format:
<vendor>_<device_type/model/OS>_<use_case>
Rules:
- Specificity: Include vendor, device type/model, OS, and use case.
- Underscores Only: Use
_as a separator; no spaces, hyphens, or other special characters. - Capitalization: Only the first letter of the last word (use case) is capitalized.
- Clarity: Last word should clearly indicate the metric being measured.
Example:
cisco_nexus_switch_cpu_Utilization
hpe_instanton_switch_Health
juniper_mx_router_junos_memory_Utilization
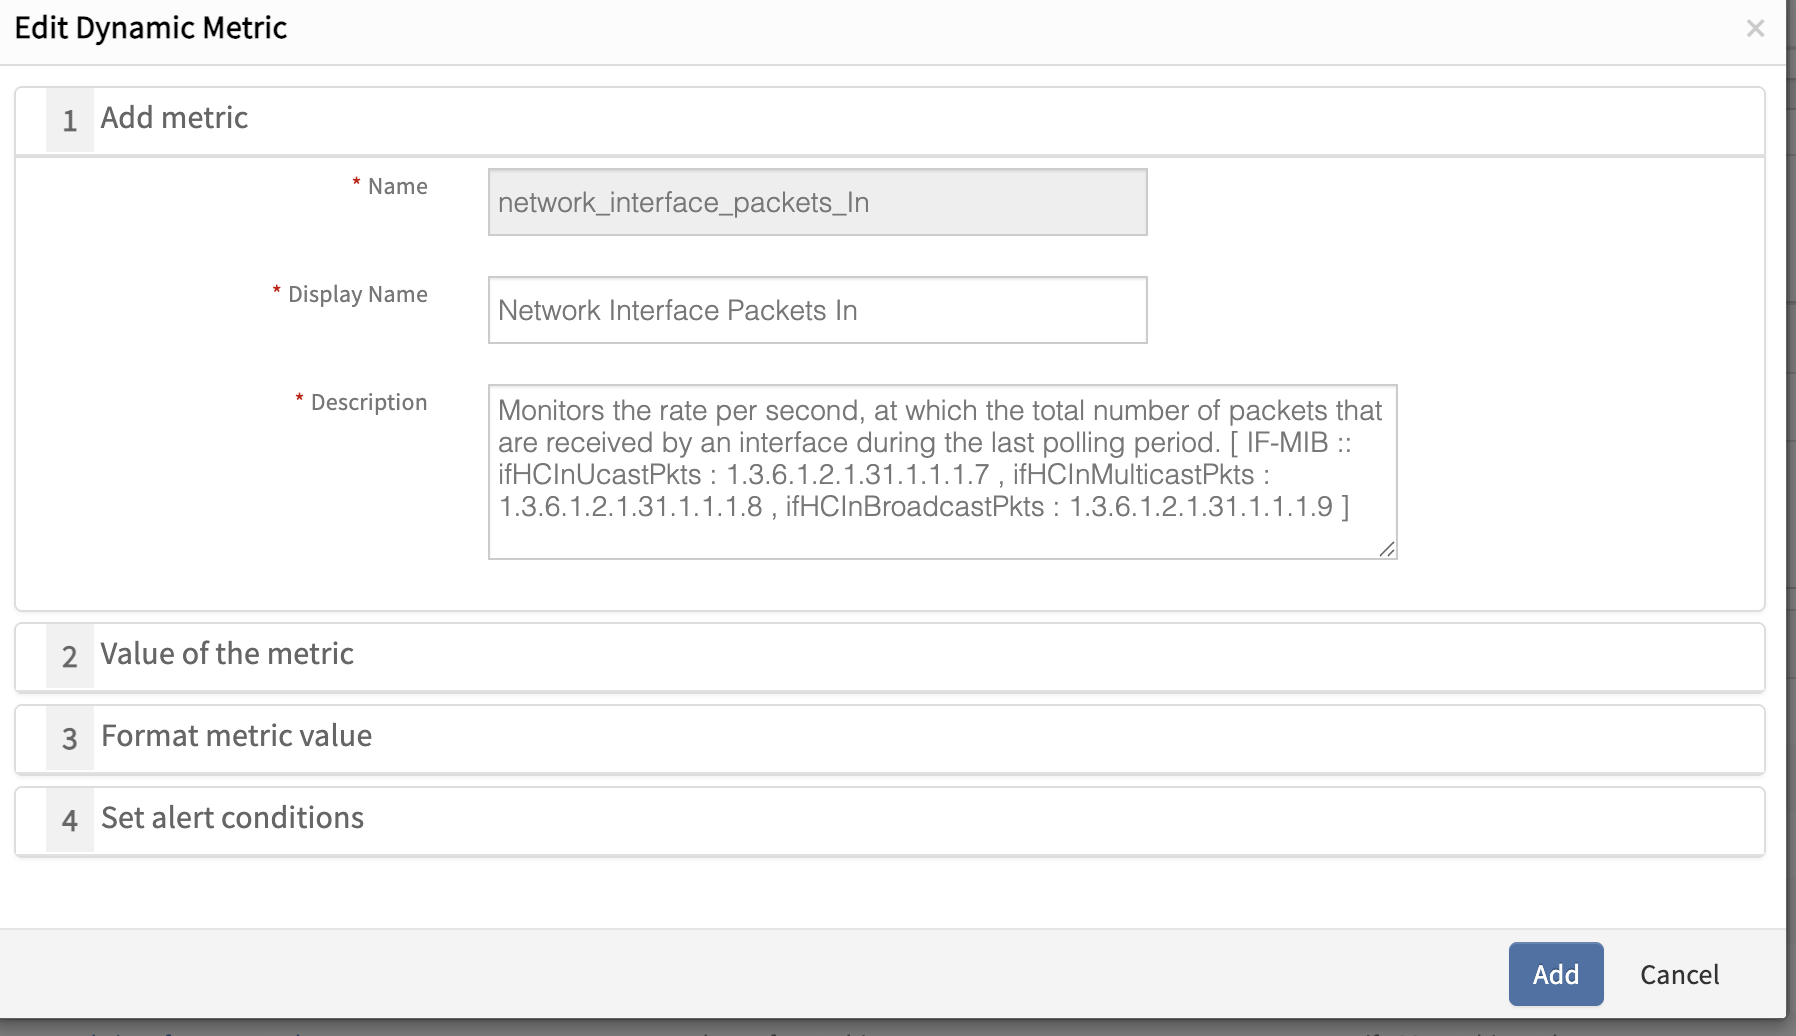
Display Name
Defines the name or label displayed on the dashboard, making it easier to understand the metric.
For Display Name, any spaces or special characters are allowed.
Example: Cisco Nexus Switch CPU Utilization
Description
Provides a brief explanation of the purpose of the metric, describing why it is used and what it represents.
Note
The Metric Name, Display Name, and Description fields are non-editable once created. Please finalize these details before creating the metric to avoid issues.Value of the Metric
The following parameters define how the metric value is collected and calculated using SNMP OIDs:
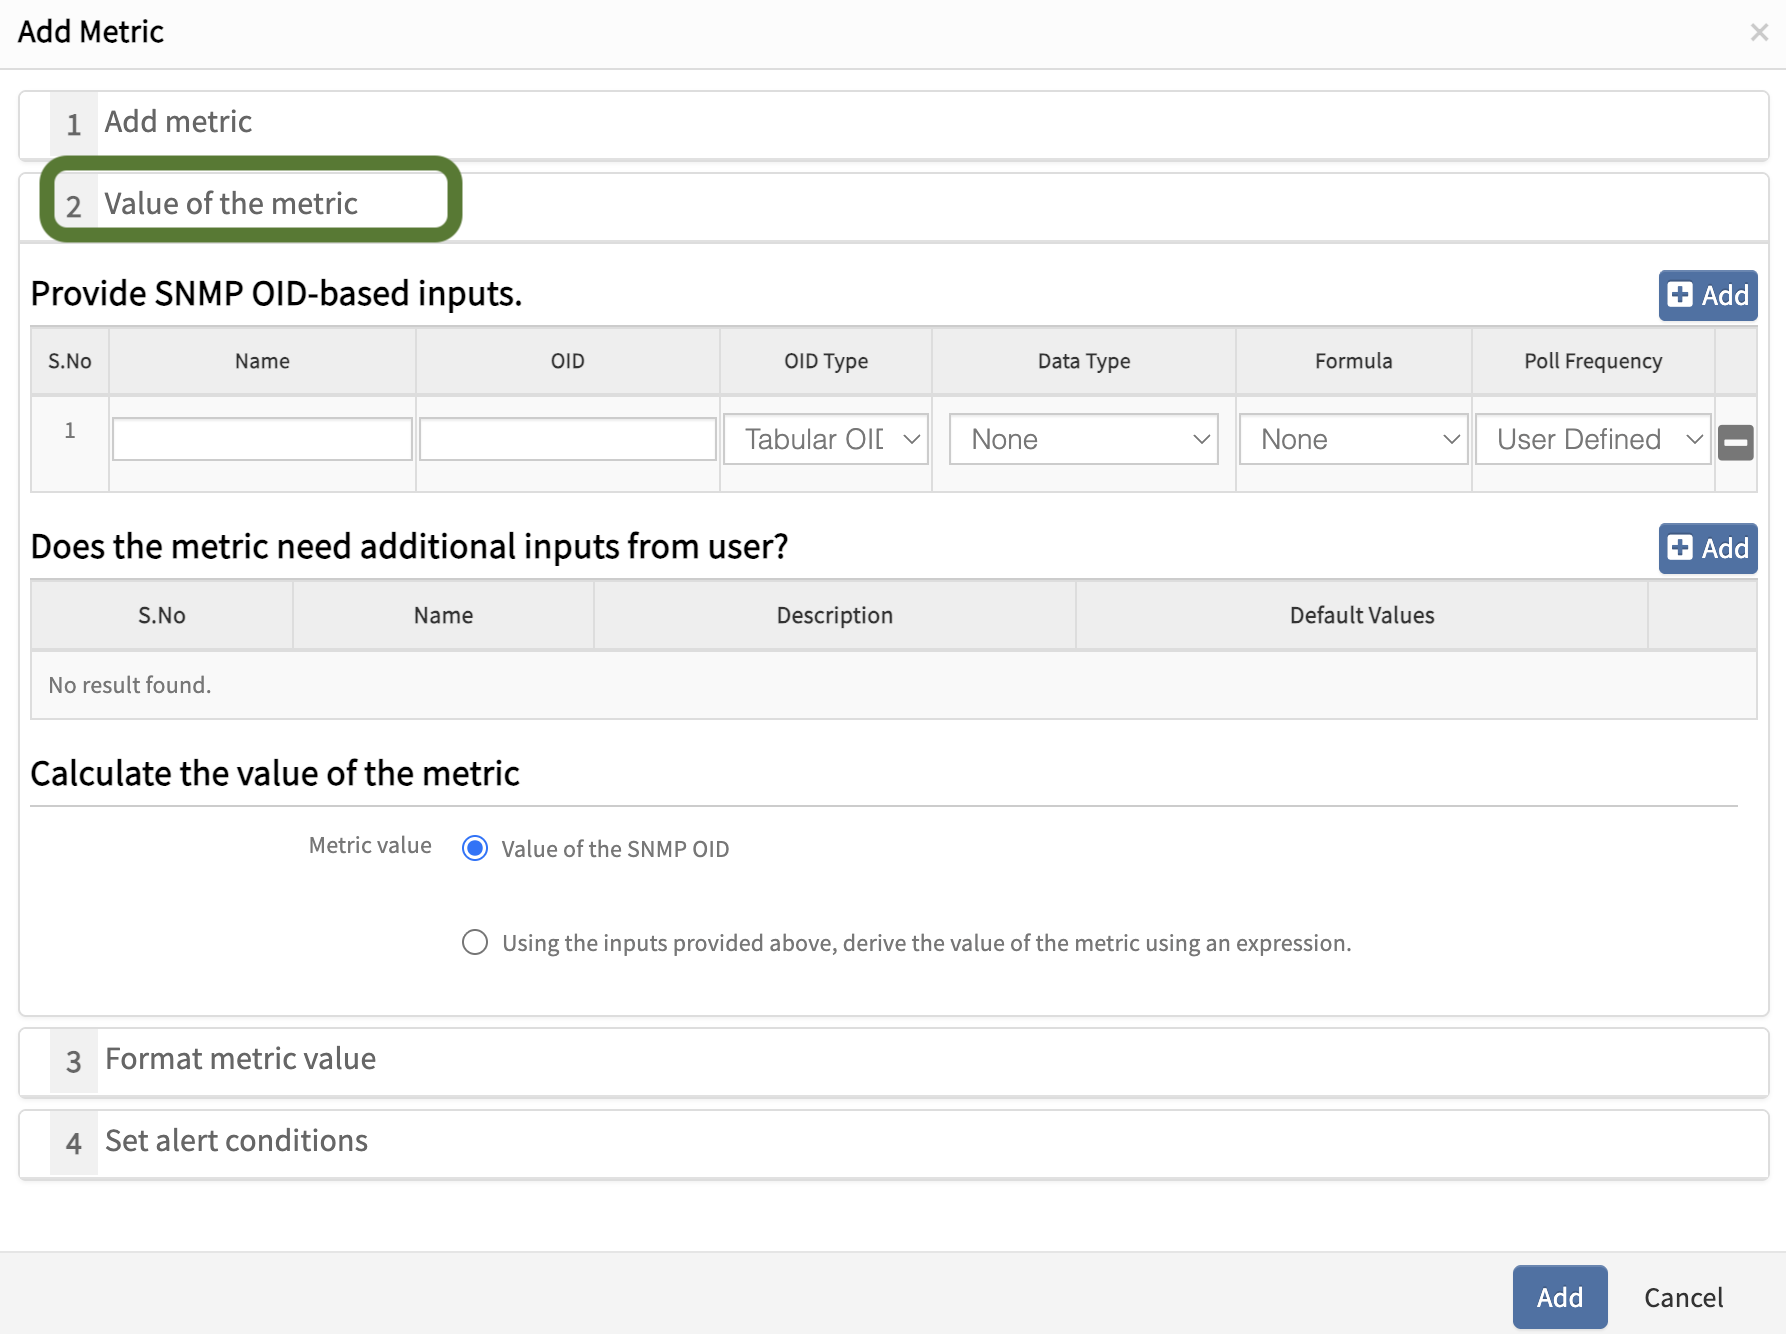
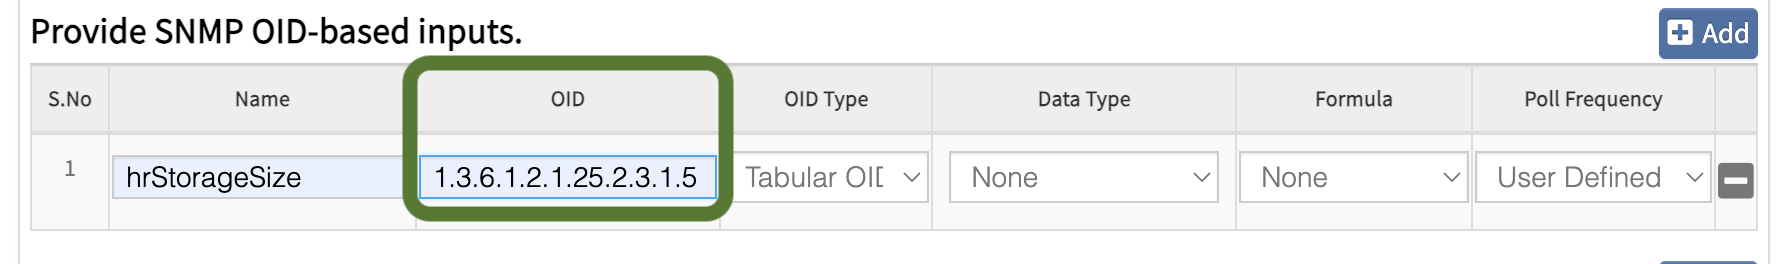
Provide SNMP OID-based Inputs
Click +Add to add OID based metric inputs. Multiple metric inputs can be added using the +Add option.
Name
Enters the OID object name as specified in the MIB.
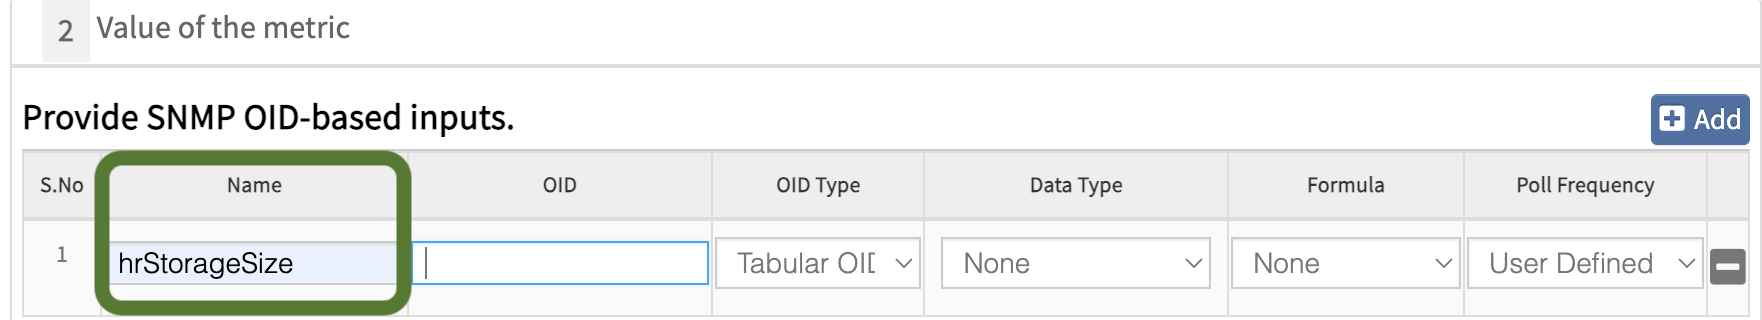
OID
Enter the OID as defined in the MIB. For Scalar OIDs, ensure the OID ends with .0.
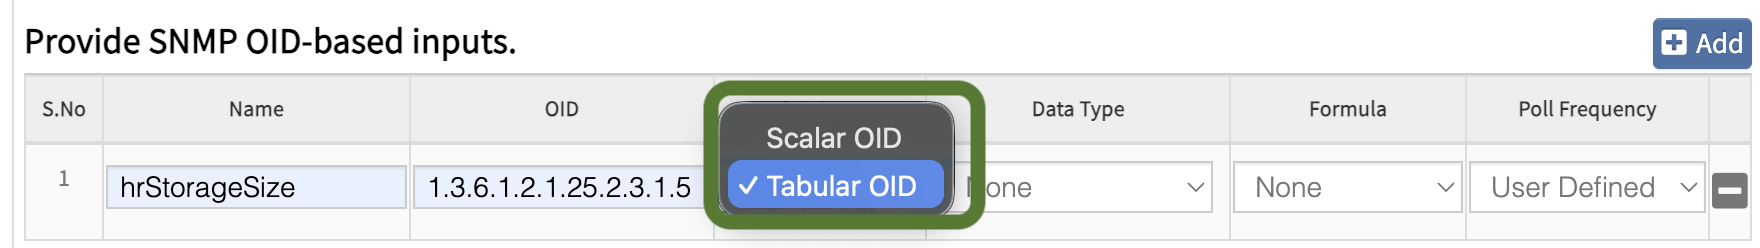
OID Type
Select whether the OID is:
- Scalar OID
- Tabular OID
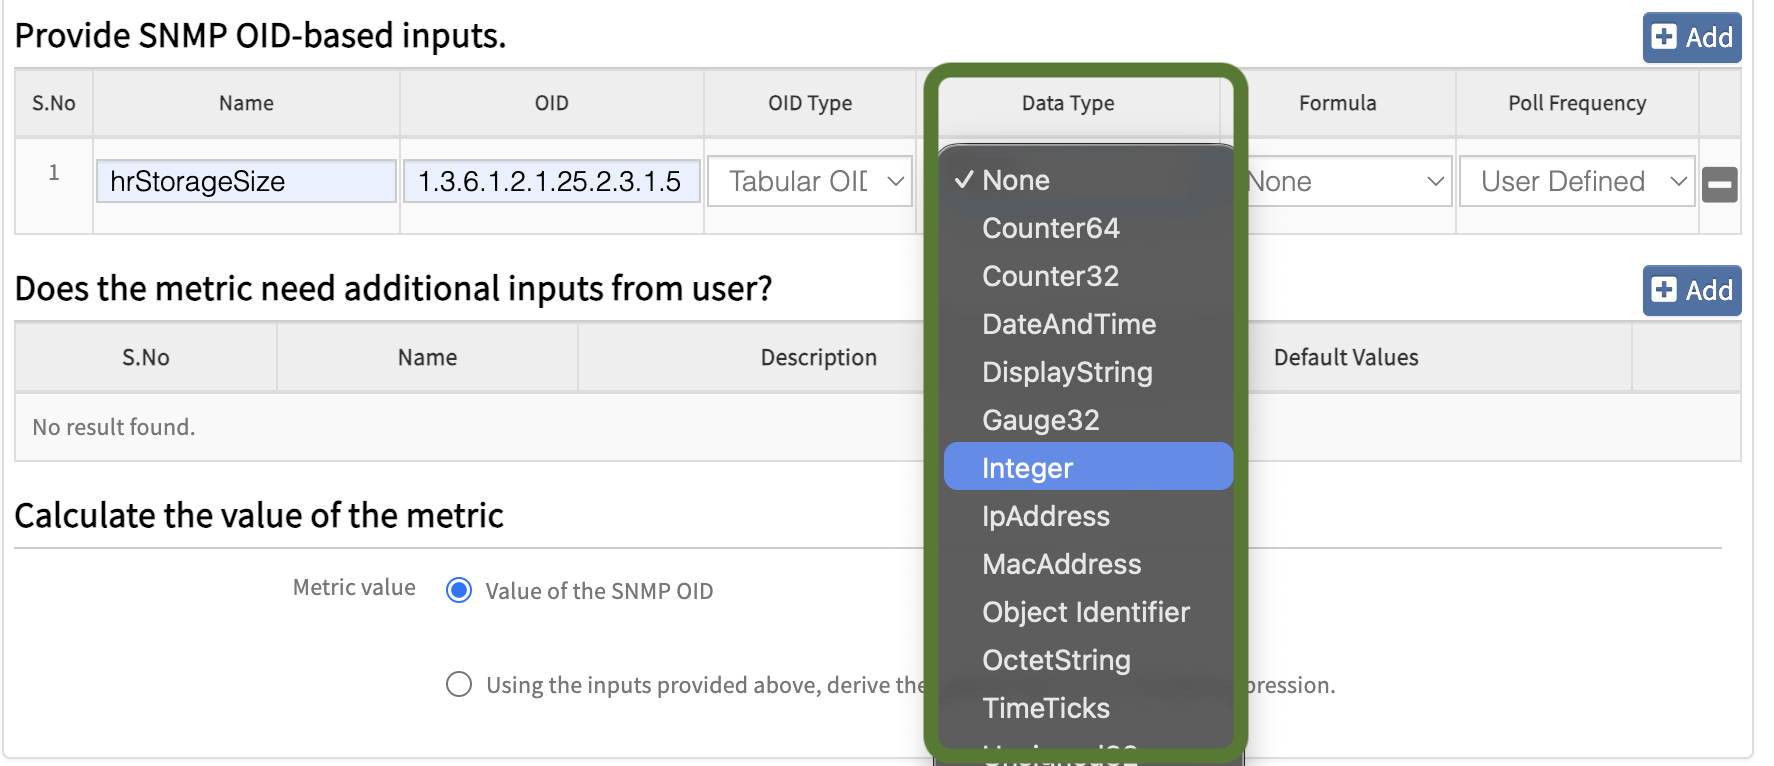
Data Type
Defines the base syntax of the OID as specified in the MIB. Select the appropriate data type according to the metric.
Formula
Defines how the metric value is calculated based on polling data. Select the appropriate formula according to the metric.
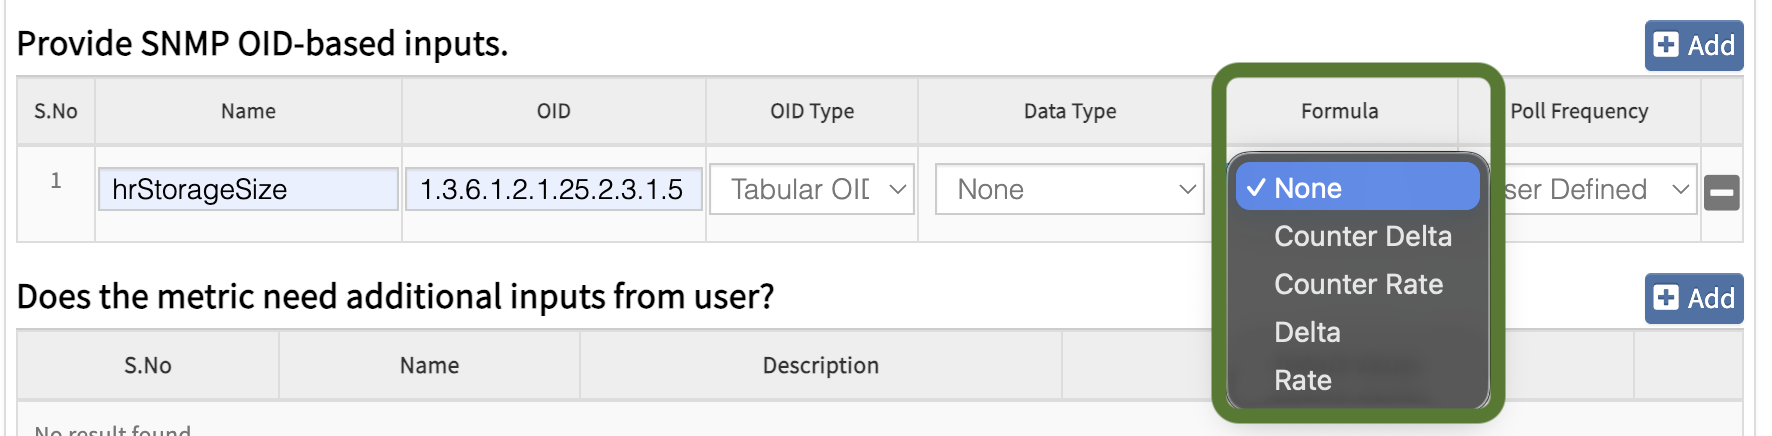
Delta
Provides the difference between the current poll value and the previous poll value.
Delta = Current Poll Value – Previous Poll Value
- Returns positive, negative, or zero values
- Suitable for values that can increase or decrease such as interface traffic, disk usage changes, or memory consumption differences
Example:
- OID:
1.3.6.1.2.1.2.2.1.10.1(Interface Inbound Octets)
Sample Values
- Previous Poll Value = 102400
- Current Poll Value = 105600
Delta Calculation:
Delta = 105600 – 102400 = 3200 bytes
Rate
Provides the rate of change per second between two poll values.
Rate = (Current Poll Value – Previous Poll Value) / (Current Poll Time – Previous Poll Time)
- Returns values in per second format (e.g., bytes/sec, requests/sec)
- Can return positive, negative, or zero values
- Useful when you want to measure how fast a value is changing over time
Example:
- OID:
1.3.6.1.2.1.2.2.1.10.1(ifInOctets) - Previous Value = 1,000,000
- Current Value = 1,500,000
- Time Difference = 10 seconds
- Rate = (1500000 – 1000000) / 10 = 50000 bytes/sec
Counter Delta
Provides the difference between current and previous values for counter-based OIDs.
Counter Delta = Current Poll Value – Previous Poll Value
- Returns only positive or zero values
- For negative values, it will return null or no data
- Used for counters that continuously increase (e.g., total packets, total bytes)
- Handles counter resets by avoiding negative values
Example:
- OID:
1.3.6.1.2.1.2.2.1.11.1(ifInUcastPkts) - Previous Value = 2000
- Current Value = 2600
- Counter Delta = 2600 – 2000 = 600 packets
Counter Rate
Provides the per second rate for counter-based OIDs.
Counter Rate = (Current Poll Value – Previous Poll Value) / (Current Poll Time – Previous Poll Time)
- Returns values in per second format
- Returns only positive or zero values
- For negative values, it will return null or no data
- Used for calculating traffic rate, packet rate, error rate, etc.
Example:
- OID:
1.3.6.1.2.1.2.2.1.16.1(ifOutOctets) - Previous Value = 5,000,000
- Current Value = 6,000,000
- Time Difference = 20 seconds
- Counter Rate = (6000000 – 5000000) / 20 = 50000 bytes/sec
Difference Between Delta/Rate and Counter Delta/Counter Rate
Delta vs Counter Delta
- Delta: Measures the change for metrics that can increase or decrease (e.g., CPU, temperature).
- Counter Delta: Measures the change for counter OIDs which always increase (e.g., byte counters, packet counters).
Rate vs Counter Rate
- Rate: Measures the per-second change for metrics, which can be positive or negative.
- Counter Rate: Measures the per-second change of counter OIDs which always increase, always positive.
Poll Frequency
Defines how frequently the devices are monitored.
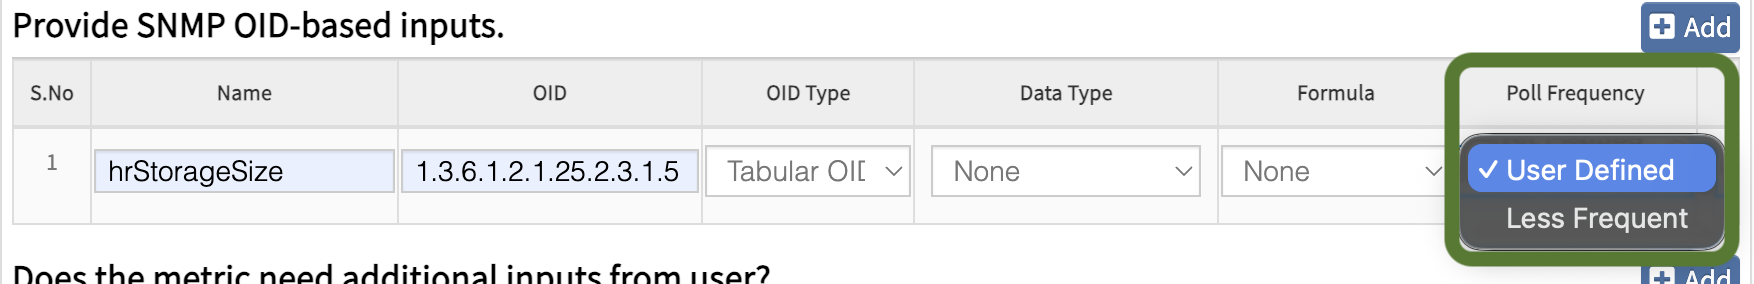
User-Defined
- Recommended when the selected OID requires frequent monitoring.
- The polling frequency is configured by the user based on the requirement, such as 1 min, 2 min, 5 min, 10 min, or 15 min.
- Example: CPU utilization monitored every 5 minutes.
Less Frequent
- Suitable when the selected OID does not require frequent updates and does not change often.
- In this case, the OIDs are polled once every 8 hours.
- Example: Device details such as fan location or hardware-related information that does not change frequently.
Note: User-Defined is the recommended option among the two.
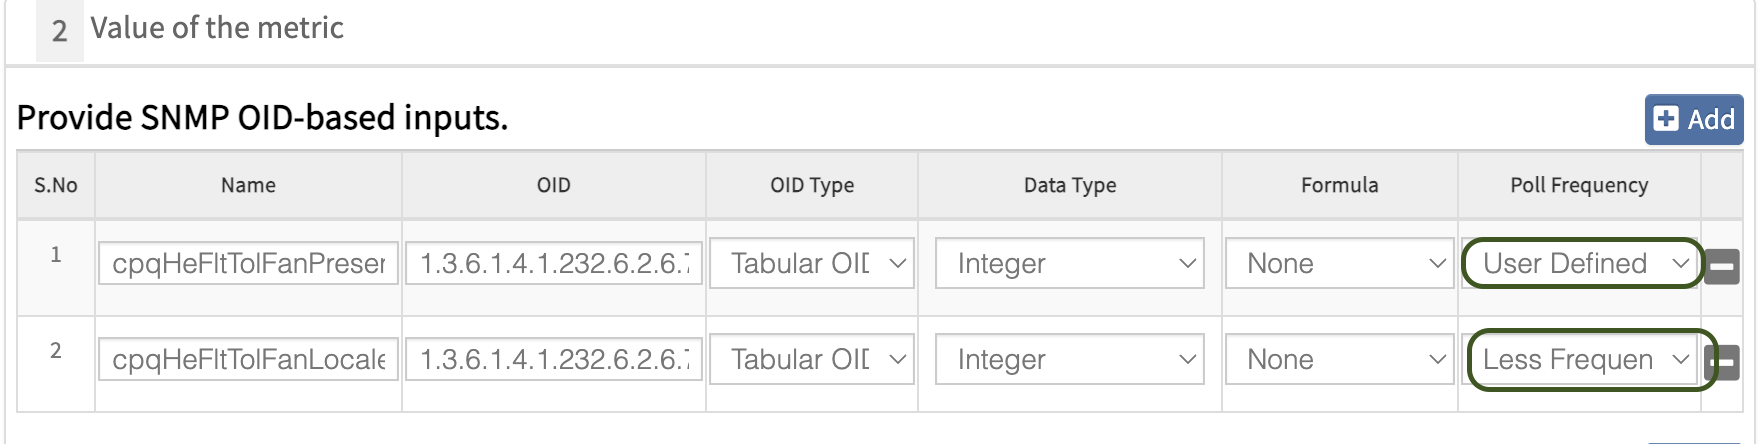
Use Case:
If a fan status metric is being monitored, the fan status OID can be configured with a User-Defined frequency for frequent monitoring. In addition to this, if the fan location is required in the alert body when the fan status becomes critical, a separate fan location OID can be configured. Since the fan location does not change frequently and is only required for reference (e.g., in alerts), it can be configured with Less Frequent polling.
Does the Metric Need Additional Inputs from User?
- Required when metric calculation depends on user-provided inputs.
- Component-level input is not possible; only metric-level input is supported.
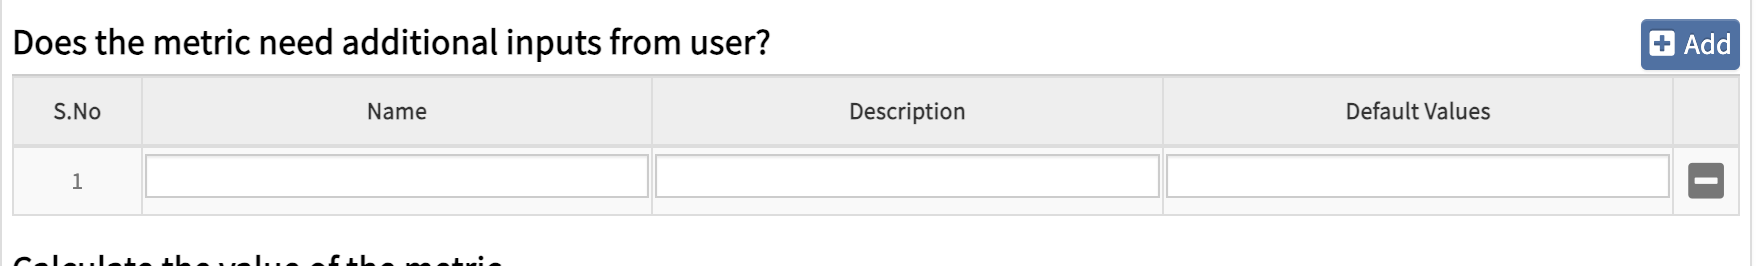
Name
Defines the variable name used in the metric calculation.
Description
Provides details about the purpose of the variable.
Default Values
Enter the default value for the variable. If no value is provided for this variable while assigning the template, the default value will be used automatically.
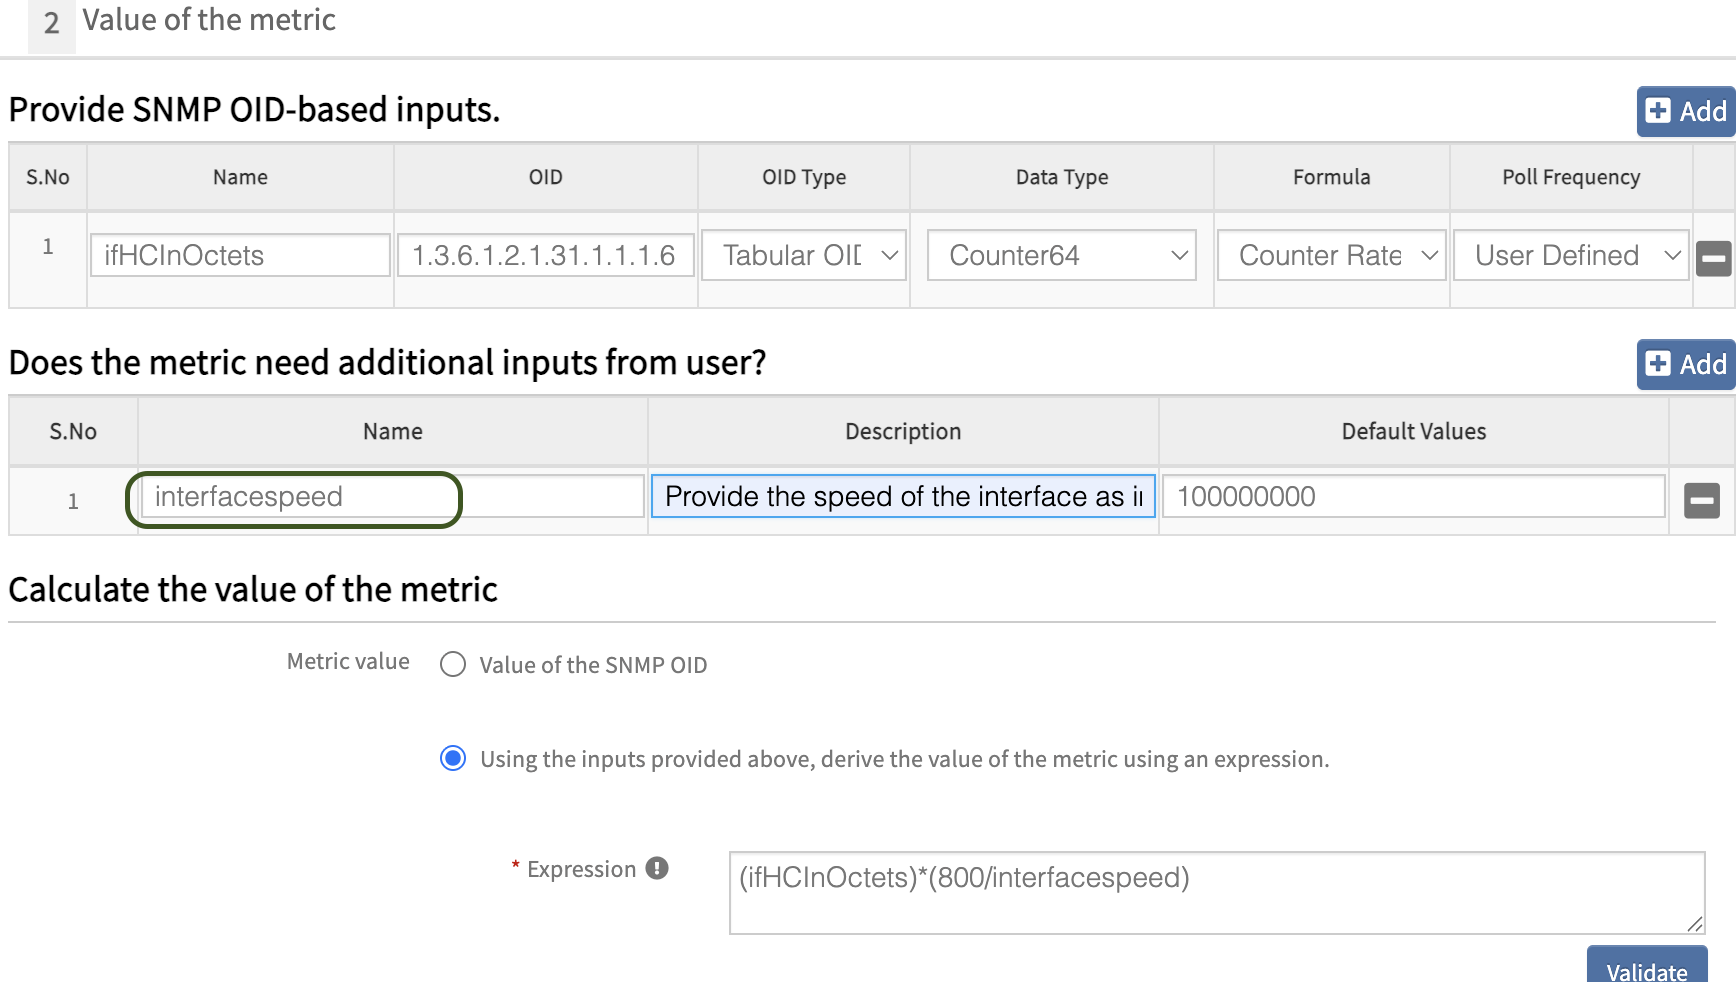
Example:
For example, if you want to monitor the network interface bandwidth for WAN links, provide the ISP speed value in bps.
Summary
- User inputs allow dynamic customization of metrics
- Default values act as a fallback when input is not provided
- Useful for scenarios where common logic is reused with different input values
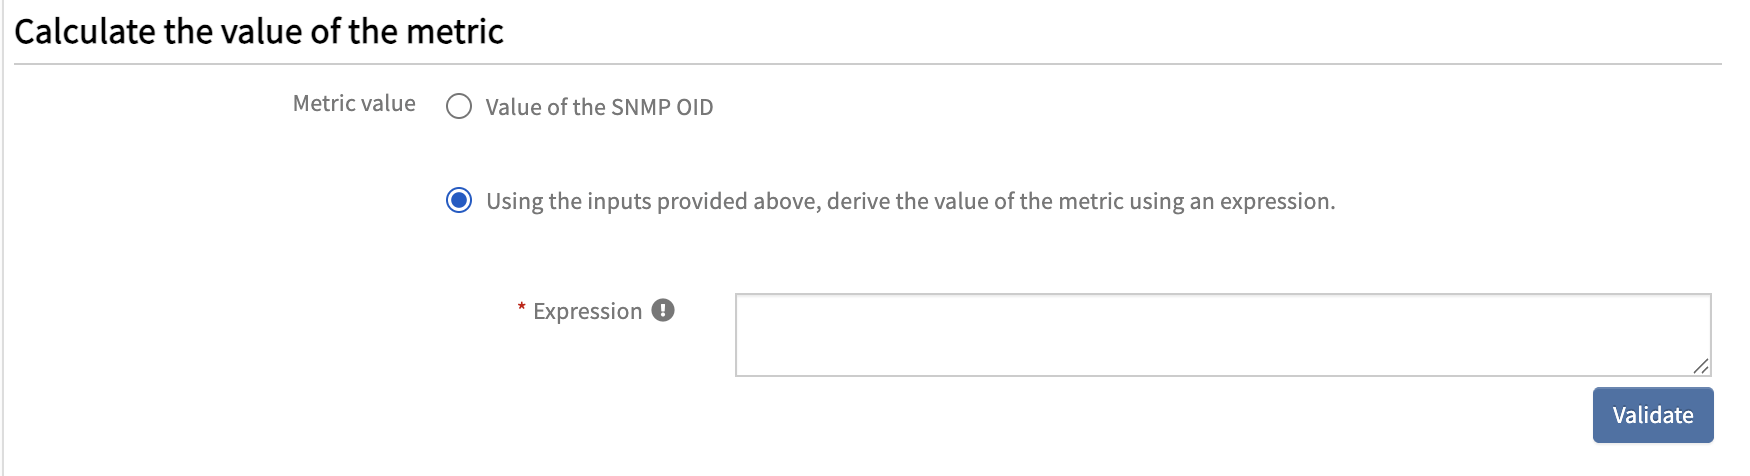
Calculate the Value of the Metric
Defines how the final metric value is derived.
Metric Value
Value of the SNMP OID
Selected by default when only a single OID input is provided.

Using the inputs provided above, derive the value of the metric using an expression
This option allows you to calculate the final metric value using a Java-based mathematical expression by combining one or more SNMP OID inputs.
User can perform:
- Mathematical operations (addition, subtraction, division, etc.)
- Conditional logic using functions like IF
- Parsing and formatting of SNMP values
For detailed information on supported operators and functions, refer to: SNMP Operators and Functions
Note:
- Click on the Validate button to check whether the expression is valid.
- If more than one OID is provided as input, the option “Using the inputs provided above, derive the value of the metric using an expression” will be automatically selected.
Examples with Use Cases
1. Storage Utilization Percentage
Use Case: Calculates storage utilization percentage to monitor disk usage.
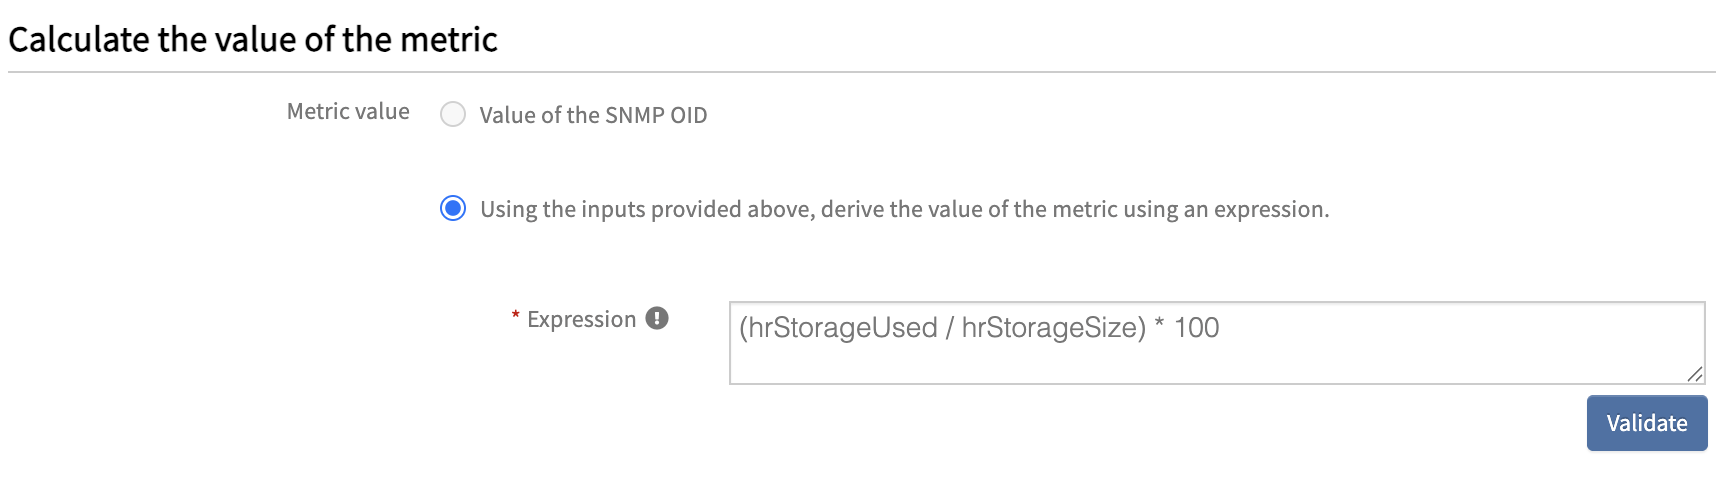
Expression: (hrStorageUsed / hrStorageSize) * 100
OIDs:
hrStorageUsed → 1.3.6.1.2.1.25.2.3.1.6hrStorageSize → 1.3.6.1.2.1.25.2.3.1.5
2. Interface Utilization with Limit
Use Case:
Calculates interface utilization while preventing values from exceeding 100%, ensuring accurate monitoring and avoiding unrealistic spikes in graphs and alerts.
The metric network.interface.traffic.in is reused in calculating the expression for another metric within the monitor, enabling derived metrics based on existing SNMP data.
Expression: IF((network.interface.traffic.in) / (ifHighSpeed * 10000) > 100, 100, (network.interface.traffic.in) / (ifHighSpeed * 10000))
OIDs:
network.interface.traffic.in → Derived from ifHCInOctets (1.3.6.1.2.1.31.1.1.1.6) using RateifHighSpeed → 1.3.6.1.2.1.31.1.1.1.15
Explanation:
- Calculates the interface utilization percentage by dividing incoming traffic with interface speed.
The IF condition ensures that:
- If the calculated value exceeds 100%, it returns 100.
- Otherwise, it returns the actual utilization value.
3. Interface Status Validation
Use Case: Returns operational status only when the interface is administratively enabled, avoiding false alerts for disabled interfaces.
Expression: IF(ifAdminStatus != 1, 0, ifOperStatus)
OIDs:
ifAdminStatus → 1.3.6.1.2.1.2.2.1.7ifOperStatus → 1.3.6.1.2.1.2.2.1.8
4. PARSER Use Case – Fan Speed Extraction
Use Case:
For vendor-specific OIDs (e.g., Fiberstore) where values include units, enabling proper numeric monitoring.
OID:devMFanSpeed → 1.3.6.1.4.1.52642.1.37.1.1.1.1.5
Expression:PARSER(devMFanSpeed,'{1}','(\d+(\.\d+)?)%')
Sample SNMP Walk Output:
1.3.6.1.4.1.52642.1.37.1.1.1.1.5.1 = STRING: "45%"
1.3.6.1.4.1.52642.1.37.1.1.1.1.5.2 = STRING: "38%"
1.3.6.1.4.1.52642.1.37.1.1.1.1.5.3 = STRING: "50%"
Explanation: The SNMP output returns values with %. The parser extracts only the numeric value using regex.Parsed Output:
45
38
50
5. Total Outgoing Traffic
Use Case: Calculates total outgoing packet rate across all traffic types.
Expression: (ifHCOutUcastPkts.rate + ifHCOutMulticastPkts.rate + ifHCOutBroadcastPkts.rate)
OIDs:
ifHCOutUcastPkts → 1.3.6.1.2.1.31.1.1.1.11ifHCOutMulticastPkts → 1.3.6.1.2.1.31.1.1.1.13ifHCOutBroadcastPkts → 1.3.6.1.2.1.31.1.1.1.15
6. PARSER Use Case – CPU (Five Minutes)
Use Case: Applicable when multiple values exist in a single SNMP response and only a specific interval metric is required.
Sample SNMP Walk Output:
SNMPv2-SMI::enterprises.4526.10.1.1.5.3.1.3.0 = STRING: "Five Seconds( 0.80%) One Minute( 0.76%) Five Minutes( 0.97%)"
Expression: PARSER(agentSwitchCpuProcessPercentageUtilization,'{1}','Five\s*Minutes\s*\(\s*(\d+(\.\d+)*)%\)')
Explanation: Extracts only the Five Minutes CPU utilization value from a string containing multiple intervals.
Parsed Output: 0.97
7. Conditional Expression – CPU Validation
Use Case: Ensures only valid CPU data is used, avoiding false alerts.
Expression: if(rlCpuUtilEnable != 1, 0, if(rlCpuUtilDuringLast5Minutes = 101, 0, rlCpuUtilDuringLast5Minutes))
OIDs:
rlCpuUtilEnable → CPU monitoring enable statusrlCpuUtilDuringLast5Minutes → CPU utilization
Explanation: If CPU monitoring is disabled, return 0. If value is invalid (101), return 0. Otherwise, return actual CPU value.
8. Fan Status Metric Using Expression by referencing two OID inputs
Use Case: Monitor the Fan Status metric by referencing two OID inputs: fan status and fan description, but focus only on the fan status value for the metric output.
OIDs:
ciscoEnvMonFanState → 1.3.6.1.4.1.9.9.13.1.4.1.3ciscoEnvMonFanStatusDescr → 1.3.6.1.4.1.9.9.13.1.4.1.2
Expression: ciscoEnvMonFanState
Explanation:
- Uses the fan status object as the metric expression.
- Ignores the fan description input for metric calculation; only fanStatus is evaluated.
Summary
Use this option to:
- Retrieve a single metric value from multiple OID inputs.
- Perform mathematical calculations using multiple OID values to derive the final metric output.
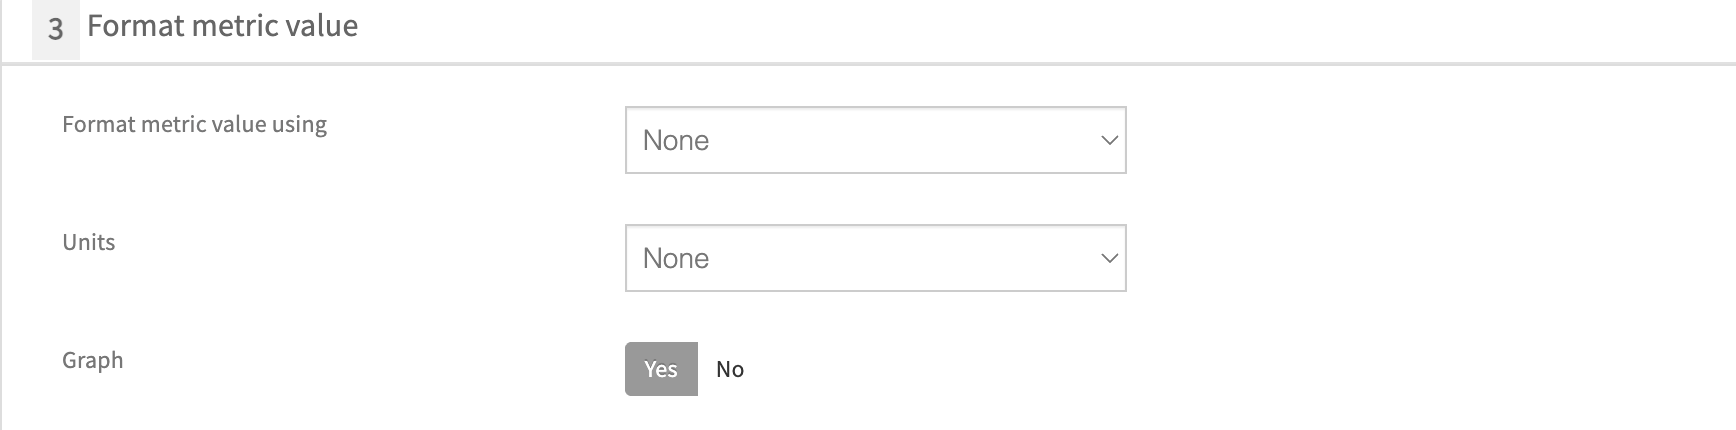
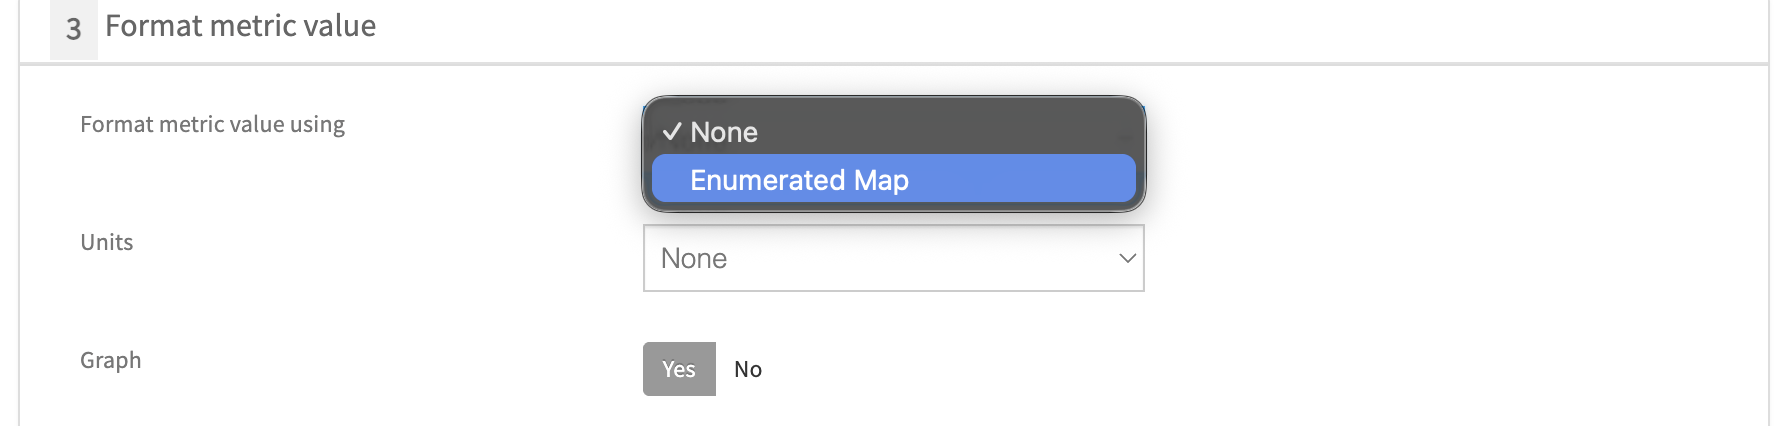
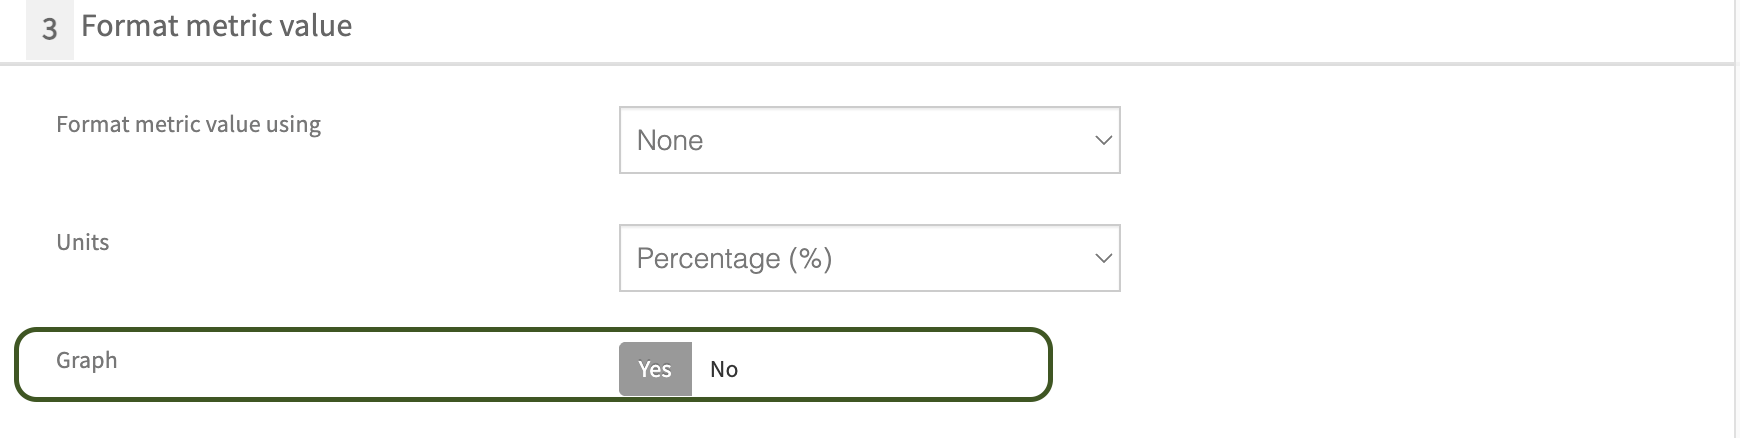
Format Metric Value
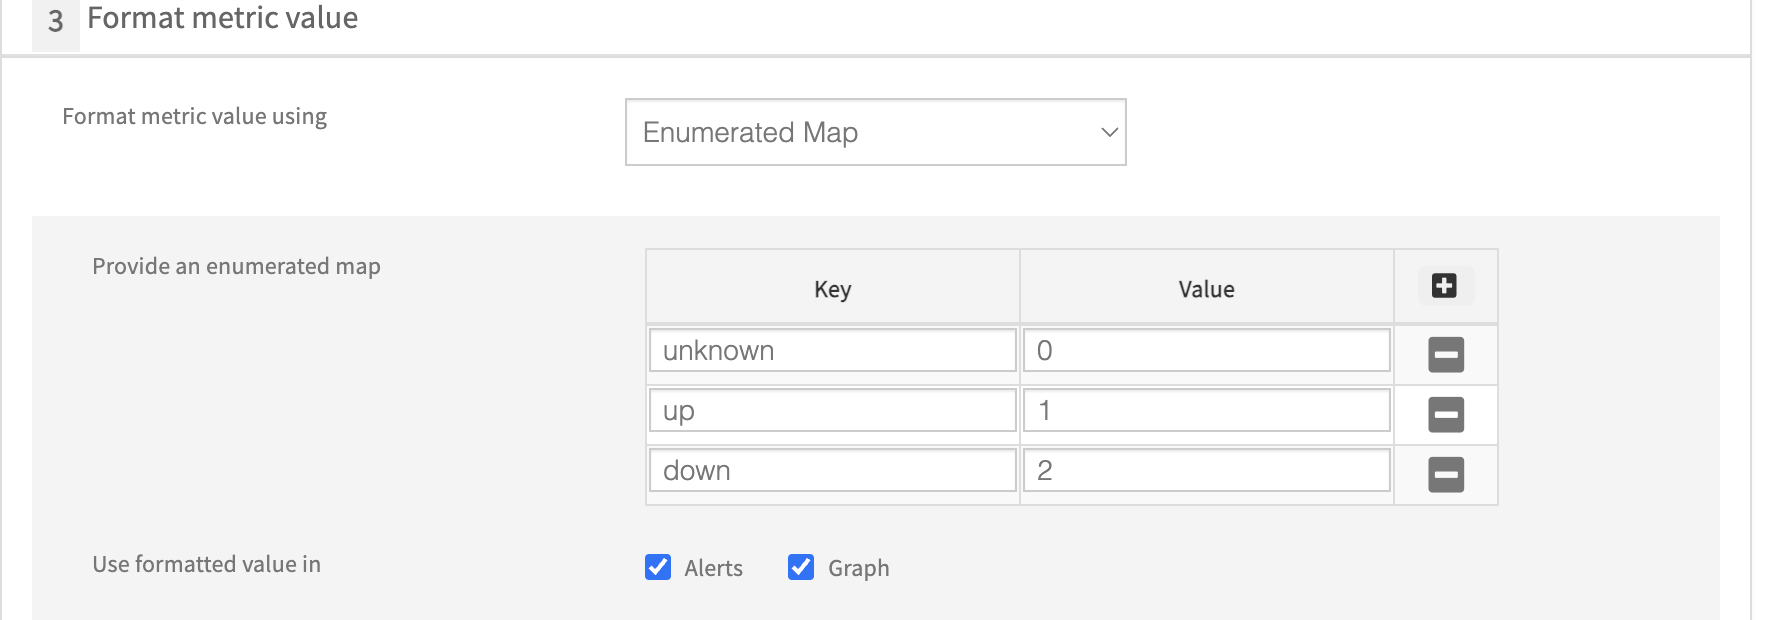
Defines how the monitoring output should be formatted. Select Enumerated Map when the OID returns numeric values that need to be converted into readable text and vice-versa.
Specify key-value pairs to map numeric OID values to readable states.
Types of Enumerated Mapping
There are two types of Enumerated Mapping supported:
Type 1: String to Integer Mapping Converts string values into numeric values for readability in alerts and graphs.
Type 2: Integer to String Mapping Converts numeric OID values into meaningful text for readability in alerts.
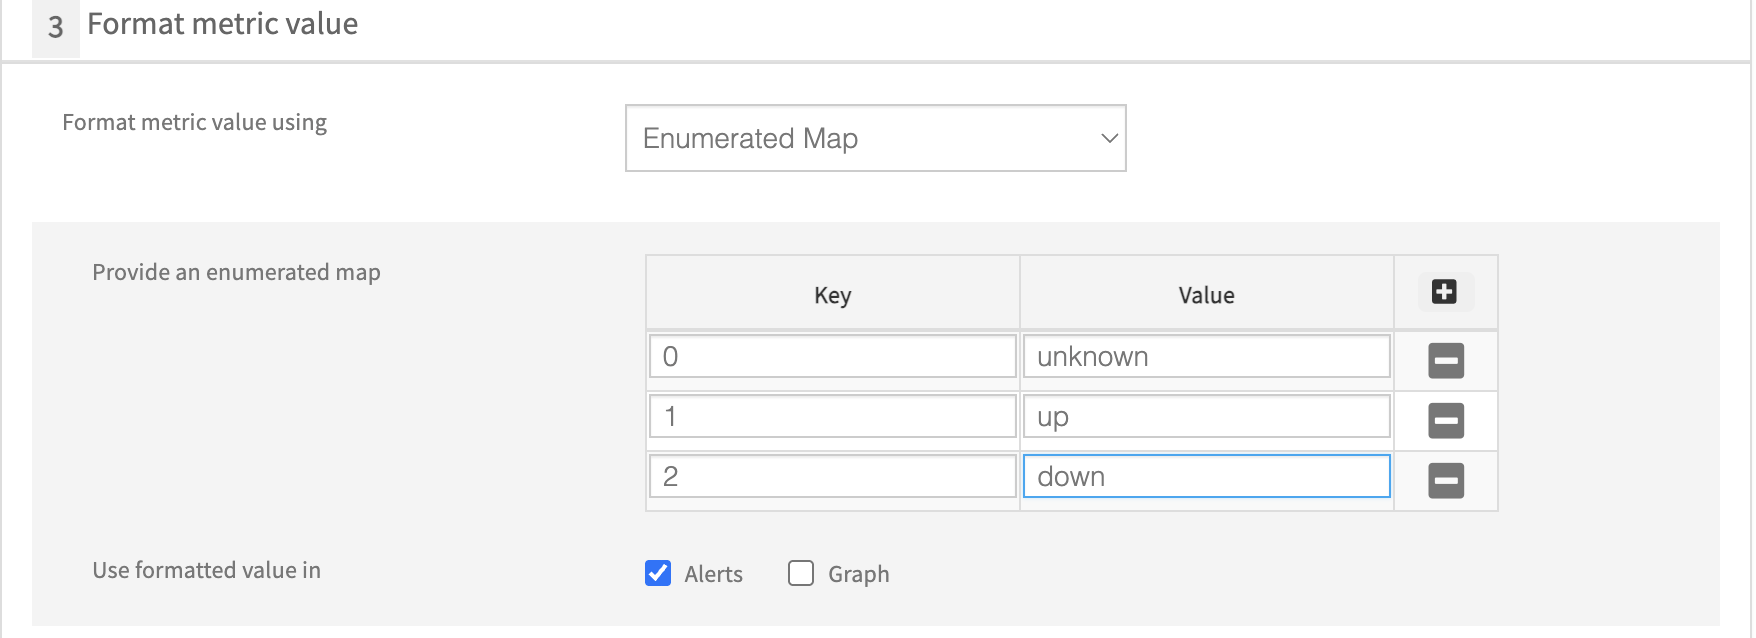
Example 1: Integer to String Mapping
| Numeric Value | Mapped Value |
|---|---|
| 0 | unknown |
| 1 | up |
| 2 | down |
Example 2: String to Integer Mapping
| String Value | Mapped Value |
|---|---|
| unknown | 0 |
| up | 1 |
| down | 2 |
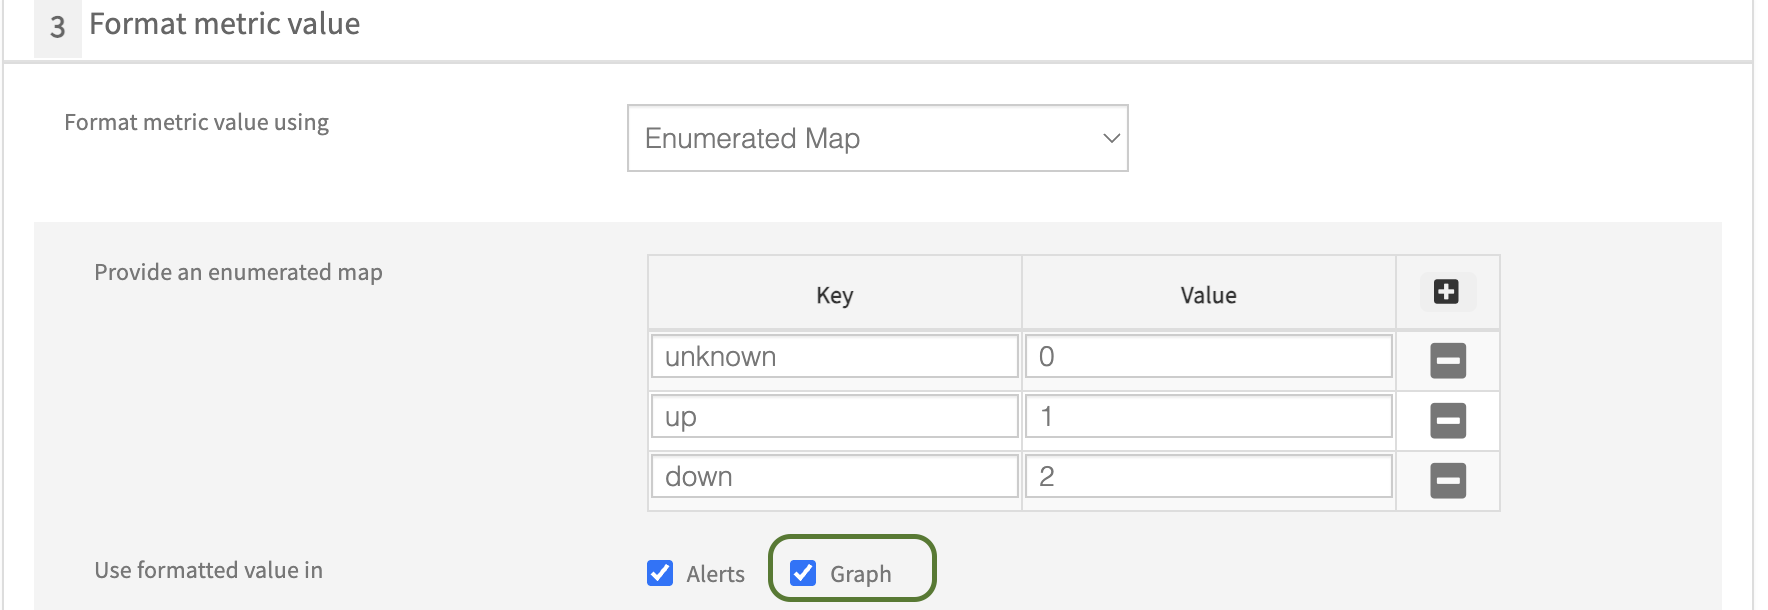
Use formatted value in
Specifies where the formatted (mapped) values should be used:
- Alerts: Displays readable values in alert messages.
- Graph: Displays formatted values in metric graphs. (Check this box only when using String to Integer Mapping.)
Unit
Defines the unit of the metric value (e.g., %, bps, KB, W).
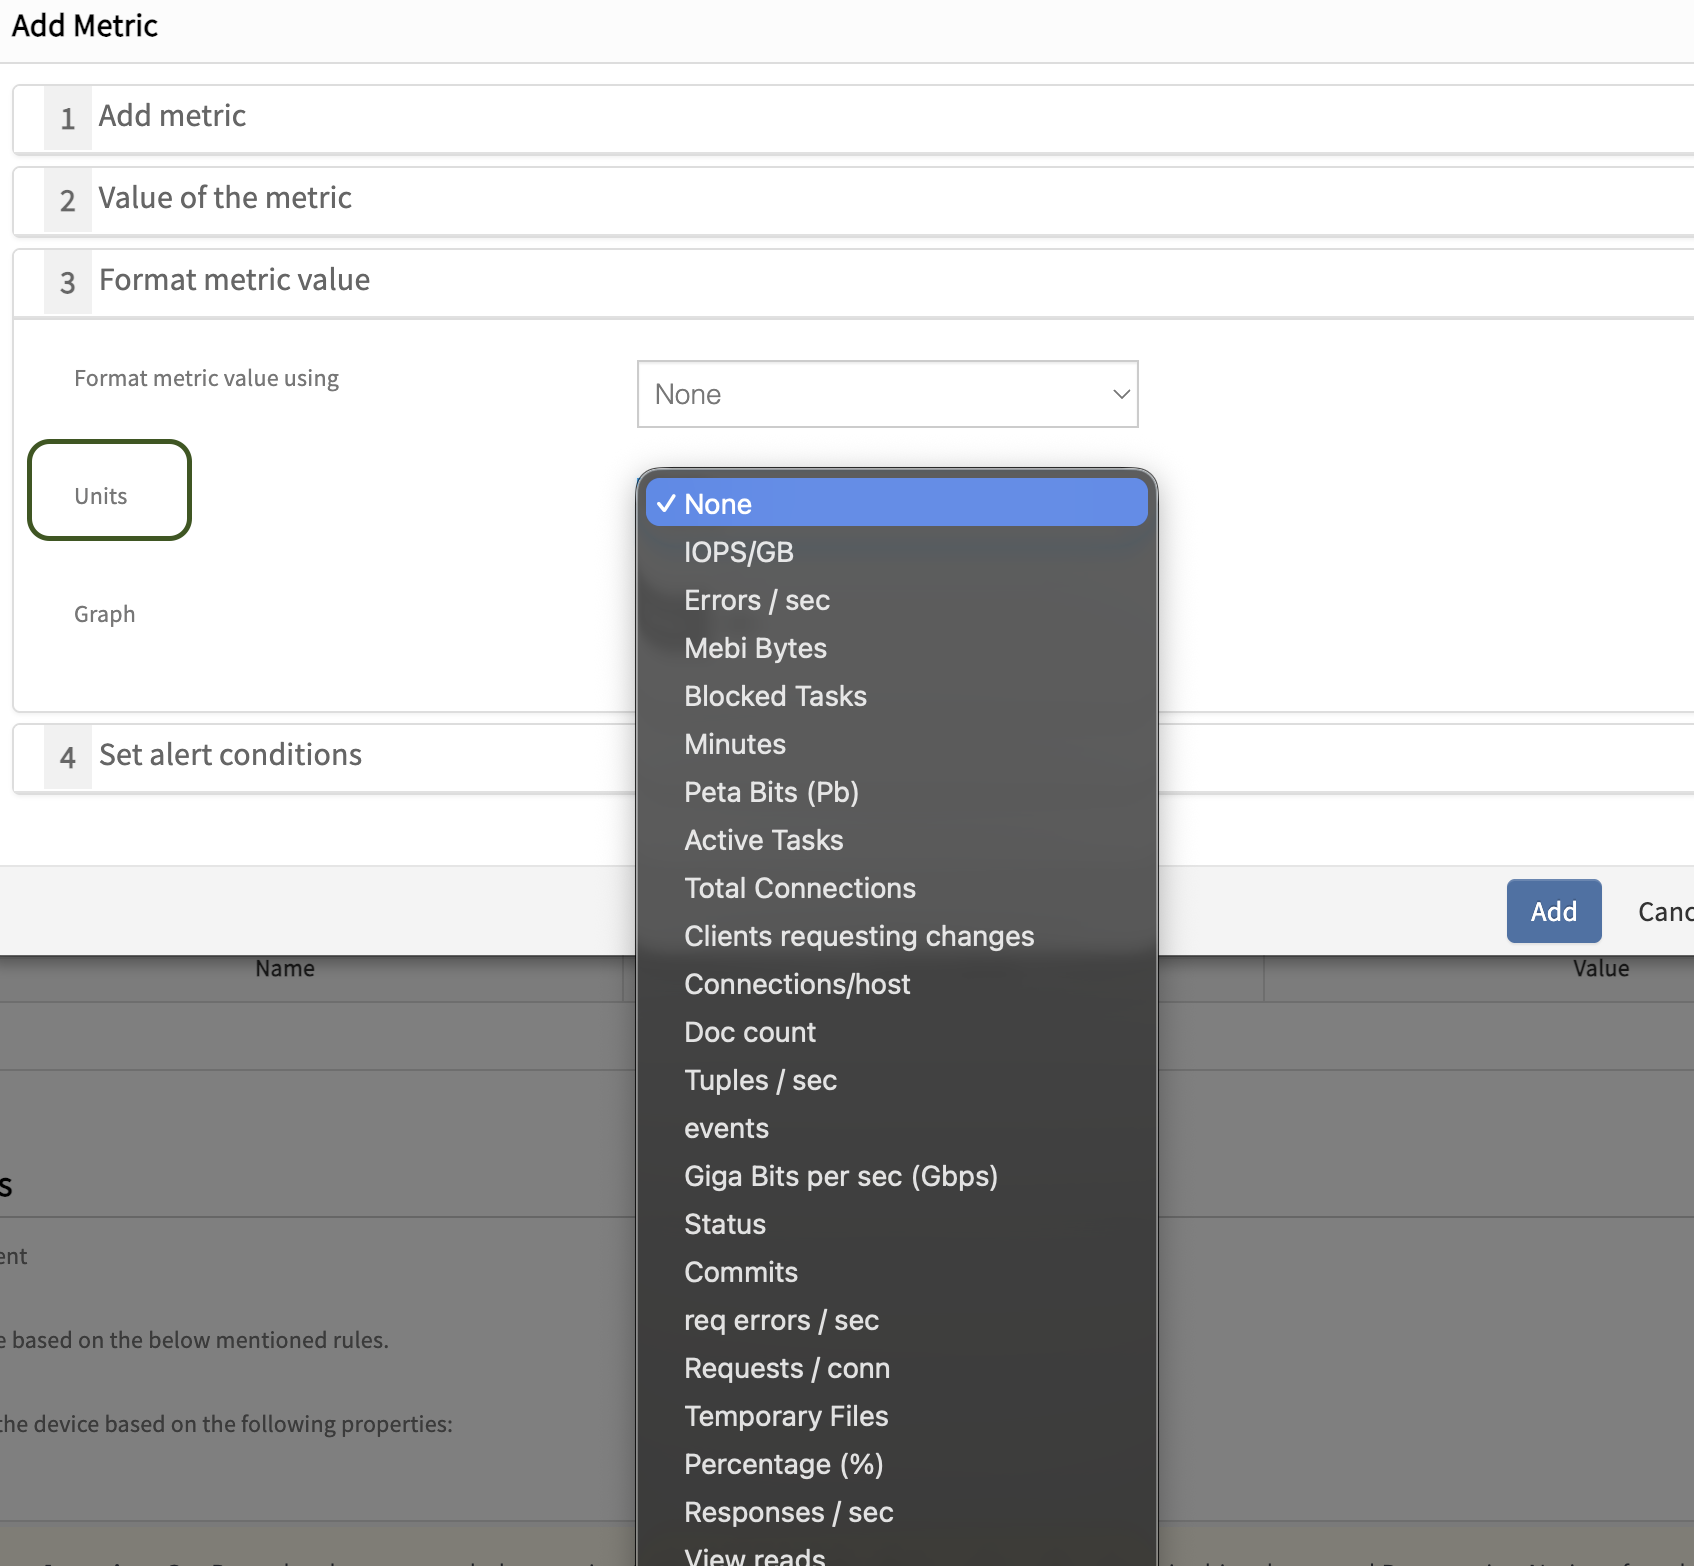
Note
Skip unit selection when Enumerated Map is used, as the value is already converted into text/numbers.Limitation
Select the appropriate unit while creating the metric for the first time, as the Unit field is non-editable after creation.Graph
Select Yes to enable graph generation for the metric.
Set Alert Conditions
Select the respective Warning and Critical conditions for generating alerts.
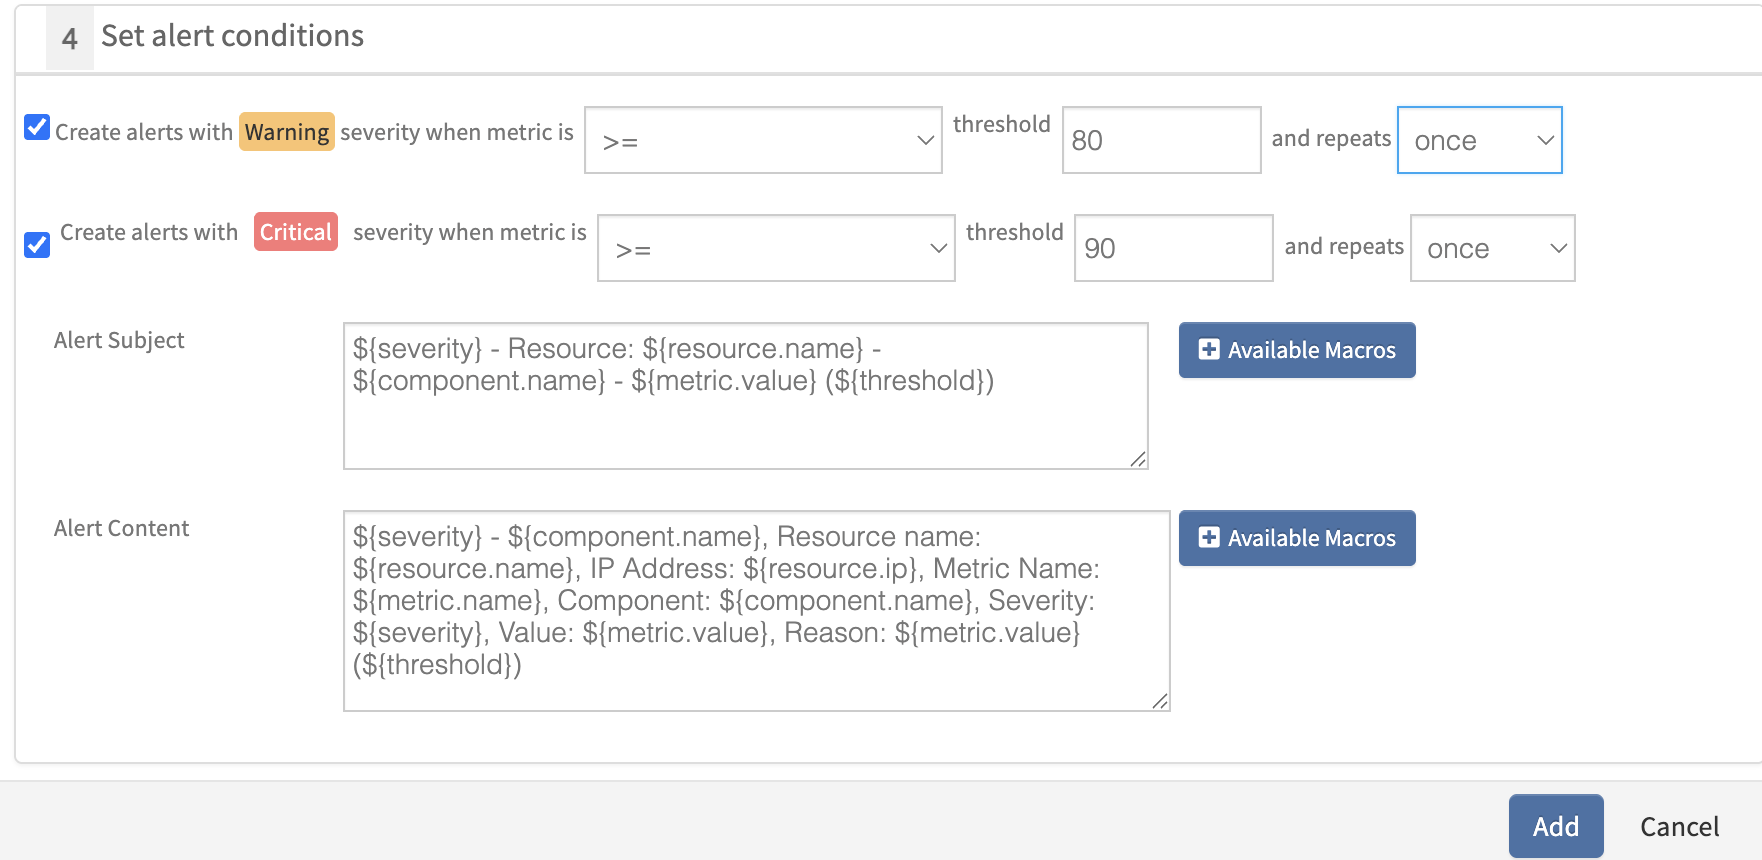
Warning Severity
Warning alert is created when the metric matches the selected operator and exceeds the warning threshold value. Select the appropriate operator and threshold based on the metric requirement. Also, configure the repeat option to define how many times the alert should be triggered (e.g., once, twice, thrice).
Critical Severity
Critical alert is created when the metric matches the selected operator and exceeds the critical threshold value. Select the appropriate operator and threshold based on the metric requirement. Also, configure the repeat option to define how many times the alert should be triggered (e.g., once, twice, thrice).
Alert Subject
Alert subject displayed for a warning or critical alert on the alert browser.
The following are the default tokens available for configuring the alert subject. These can be further customized based on requirements.
Default Alert Subject Format:
${severity} - Resource: ${resource.name} - ${component.name} - ${metric.value} (${threshold})
Additional alert tokens can be selected by clicking on + Available Macros.
Alert Content
Alert description displayed on the alert details page. The actual values replace the variables used in the alert subject and content.
The following are the default tokens available for configuring the alert content. These can be customized as per requirements.
Default Alert Content Format:
${severity} - ${component.name}, Resource name: ${resource.name}, IP Address: ${resource.ip}, Metric Name: ${metric.name}, Component: ${component.name}, Severity: ${severity}, Value: ${metric.value}, Reason: ${metric.value} (${threshold})
Additional alert tokens can be selected by clicking on + Available Macros.
Example Alert Configurations
Example 1: Fan Speed Alert
Alert Subject:
${severity} - Resource: ${resource.name} - HPE Fan Speed: ${metric.value} (${threshold})
Alert Content:
Resource name: ${resource.name}
IP Address: ${resource.ip}
Alert Generated Time: ${alert.generated.time}
Severity: ${severity}
Metric Name: ${metric.name}
HPE Fan Speed: ${metric.value}
Reason: HPE Fan Speed is ${metric.value} (${threshold})
Example 2: Memory Utilization Alert
Alert Subject:
${severity} - Resource: ${resource.name} - Alaxala AX23AX26S Switch Memory Utilization: ${metric.value} (${threshold})
Alert Content:
Resource name: ${resource.name}
IP Address: ${resource.ip}
Alert Generated Time: ${alert.generated.time}
Severity: ${severity}
Metric Name: ${metric.name}
Alaxala AX23AX26S Switch Total Memory: ${axsMemoryTotalSize} KB
Alaxala AX23AX26S Switch Used Memory: ${axsMemoryUsedSize} KB
Alaxala AX23AX26S Switch Free Memory: ${axsMemoryFreeSize} KB
Alaxala AX23AX26S Switch Memory Utilization: ${metric.value}
Reason: Alaxala AX23AX26S Switch Memory Utilization is ${metric.value} (${threshold})
Example 3: Status / State Alert (Without Threshold)
Alert Subject:
${severity} - Resource: ${resource.name} - HPE Power Supply State: ${metric.value}
Alert Content:
Resource name: ${resource.name}
IP Address: ${resource.ip}
Alert Generated Time: ${alert.generated.time}
Severity: ${severity}
Metric Name: ${metric.name}
HPE Power Supply State: ${metric.value}
Reason: HPE Power Supply State is ${metric.value}
Note
For status or state metrics, remove${threshold} from alert subject and content.After adding all the above details, click +Add to save the metric.
Key Considerations
- Multiple metrics can be added within a single monitor.
- Tabular and Scalar OIDs cannot be used together in the same monitor. Separate monitors must be created for Tabular OIDs and Scalar OIDs.
- OID inputs defined in one metric can be reused in other metrics within the same monitor. For example, if
cempMemPoolUsedandcempMemPoolFreeare used in a metric likecisco_memory_utilization, the same inputs can be reused in another metric such ascisco_memory_totalby defining an expression like:cempMemPoolUsed + cempMemPoolFree - Either Graph or Alert must be enabled on a metric for data collection.