The FTP synthetic monitor verifies the time taken to connect to the FTP server and the time taken to download a file from the FTP server to the local machine.
Configuration Parameters
Before you create the monitor, enable the synthetic agent flag in Setup > Resources > Management Profile > Management Gateways > Synthetic. This flag is used to show your private locations.
Enter the follwoing details to configure the FTP synthetic monitor:
| Section | Field Name | Description | Values/Example | Field Type |
|---|---|---|---|---|
| Basic Details | Name | Enter a name for the synthetic monitor. | Text | |
| Type | Select the type of synthetic monitor. | FTP | Dropdown | |
| FTP Configuration | Host | Enter the IP address/host name of the synthetics. It should be accessible from Gateway. |
| Text |
| Connection Timeout | Maximum time-out to connect to the FTP server. |
| String | |
| Port | Enter the port number of the FTP server to communicate with OpsRamp's endpoints. It should be accessible from Gateway. |
| String | |
| Assign Credentials | Credential Set | Select the credentials to access the FTP Server from the dropdown list. | Dropdown | |
| Proxy Settings | Configuration Type | Enable Proxy Configuration option and select the configuration type.
| Checkbox | |
| Upload/Download | File upload options | Select an option to upload or download a file:
| Checkbox | |
| Locations | Public Locations | Select the public locations where the monitor will run. | INT Public1 | Checkbox |
| Private Locations | Select the private locations where the monitor will run. | INT Private1 | Checkbox |
After configuring, view metrics, and graphical representations for more information.
Graphical metrics representation
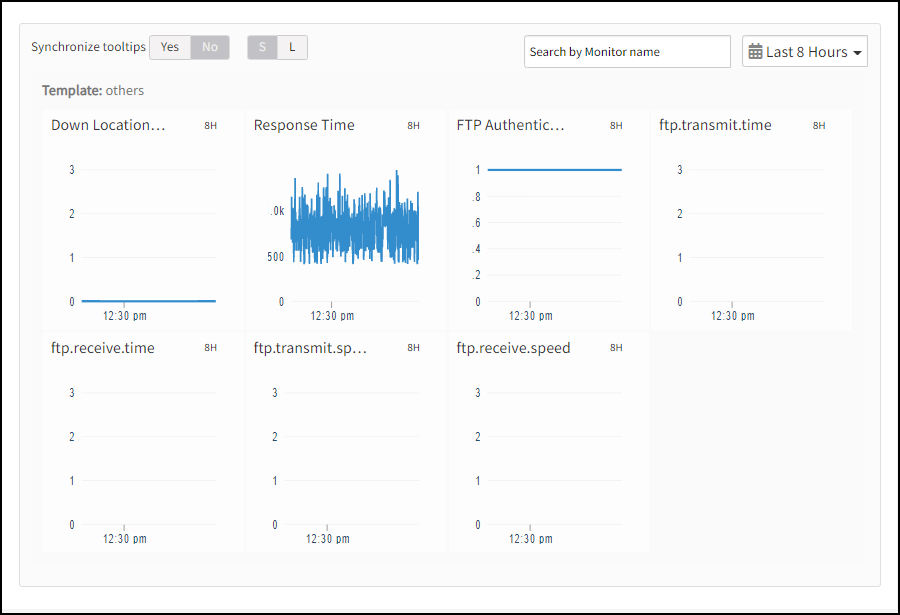
Supported metrics
| Metric Name | Units |
|---|---|
| availability.down.location.count Location Count. Number of locations where the configured host is down | - |
| synthetic.response.time The time taken for the FTP server to transfer the file | milliseconds |
| ftp.authentication.check Verify FTP authentication | NA |
| ftp.transmit.time Time taken to upload file | seconds |
| ftp.transmit.speed Number of bytes uploaded per second | bytes/sec |
| ftp.receive.time Time taken to download a file | seconds |
| ftp.receive.speed Number of bytes downloaded per second | bytes/sec |
| ftp.transmit.time and ftp.transmit.speed These metrics will display when you have an upload option | - |
| ftp.receive.speed and ftp.receive.time These metrics will display when you have a download option | - |