The Network Performance Management (NPM) guide is designed to help you navigate and utilize the features of our dashboard efficiently.
Introduction
The NPM Dashboard provides a comprehensive view of network performance metrics collected and analyzed by OpsRamp’s Network Performance Monitoring capabilities. The NPM utilizes flow technologies (sFlow, NetFlow v5/9, and IPFIX) to gain insight into network performance providing end-to-end visibility. With the ability to drill down to network hotspots, NPM enables Network Administrators to handle network-based performance issues and plan for capacity updates proactively.
The NetFlow conversation typically refers to communicating or exchanging data packets between network devices or endpoints. This analysis provides insights into network traffic, including source and destination IP addresses, ports used, and the volume of data exchanged.
NPM depends on a Flow Collector Integration to be installed and provides out-of-the-box dashboards for Top Talkers with respect to the Conversations, Protocols, etc.
Key components of NPM are:Flow exporter: A network device (usually a router or firewall) collects and exports flow information to a flow collector.Flow collector application: An appliance or server that receives exported flow information.Flow ingester: An application that analyzes flow information the flow collector collects.
Prerequisite
- SNMP discovery for effectively managing or discover the network devices.
- NPM supports sFlow, NetFlow v5, NetFlow v9, and IPFIX protocols.
- NextGen Gateway version 17.2.0 and above is compatible with this feature. During the installation of the NextGen Gateway, make sure to enable third-party integration by using the flag
-t enable. See Available flags for installing nextgen gateway for more details. - Contact OpsRamp support to enable the NPM feature at the Partner or Client level.
Install NPM Collector
See NPM Collector for more details.
Note
During NPM collector installation, it is recommended to use the port range 30100 - 32000. Otherwise, the Kubernetes cluster configuration must be updated to accept a different range.Enable NPM
See Users and Permissions for more details on how to enable Network Performance Management from the OpsRamp portal.
Note
To enable NPM, you need theNPM_View or NPM_Manage permissions.NPM Dashboard
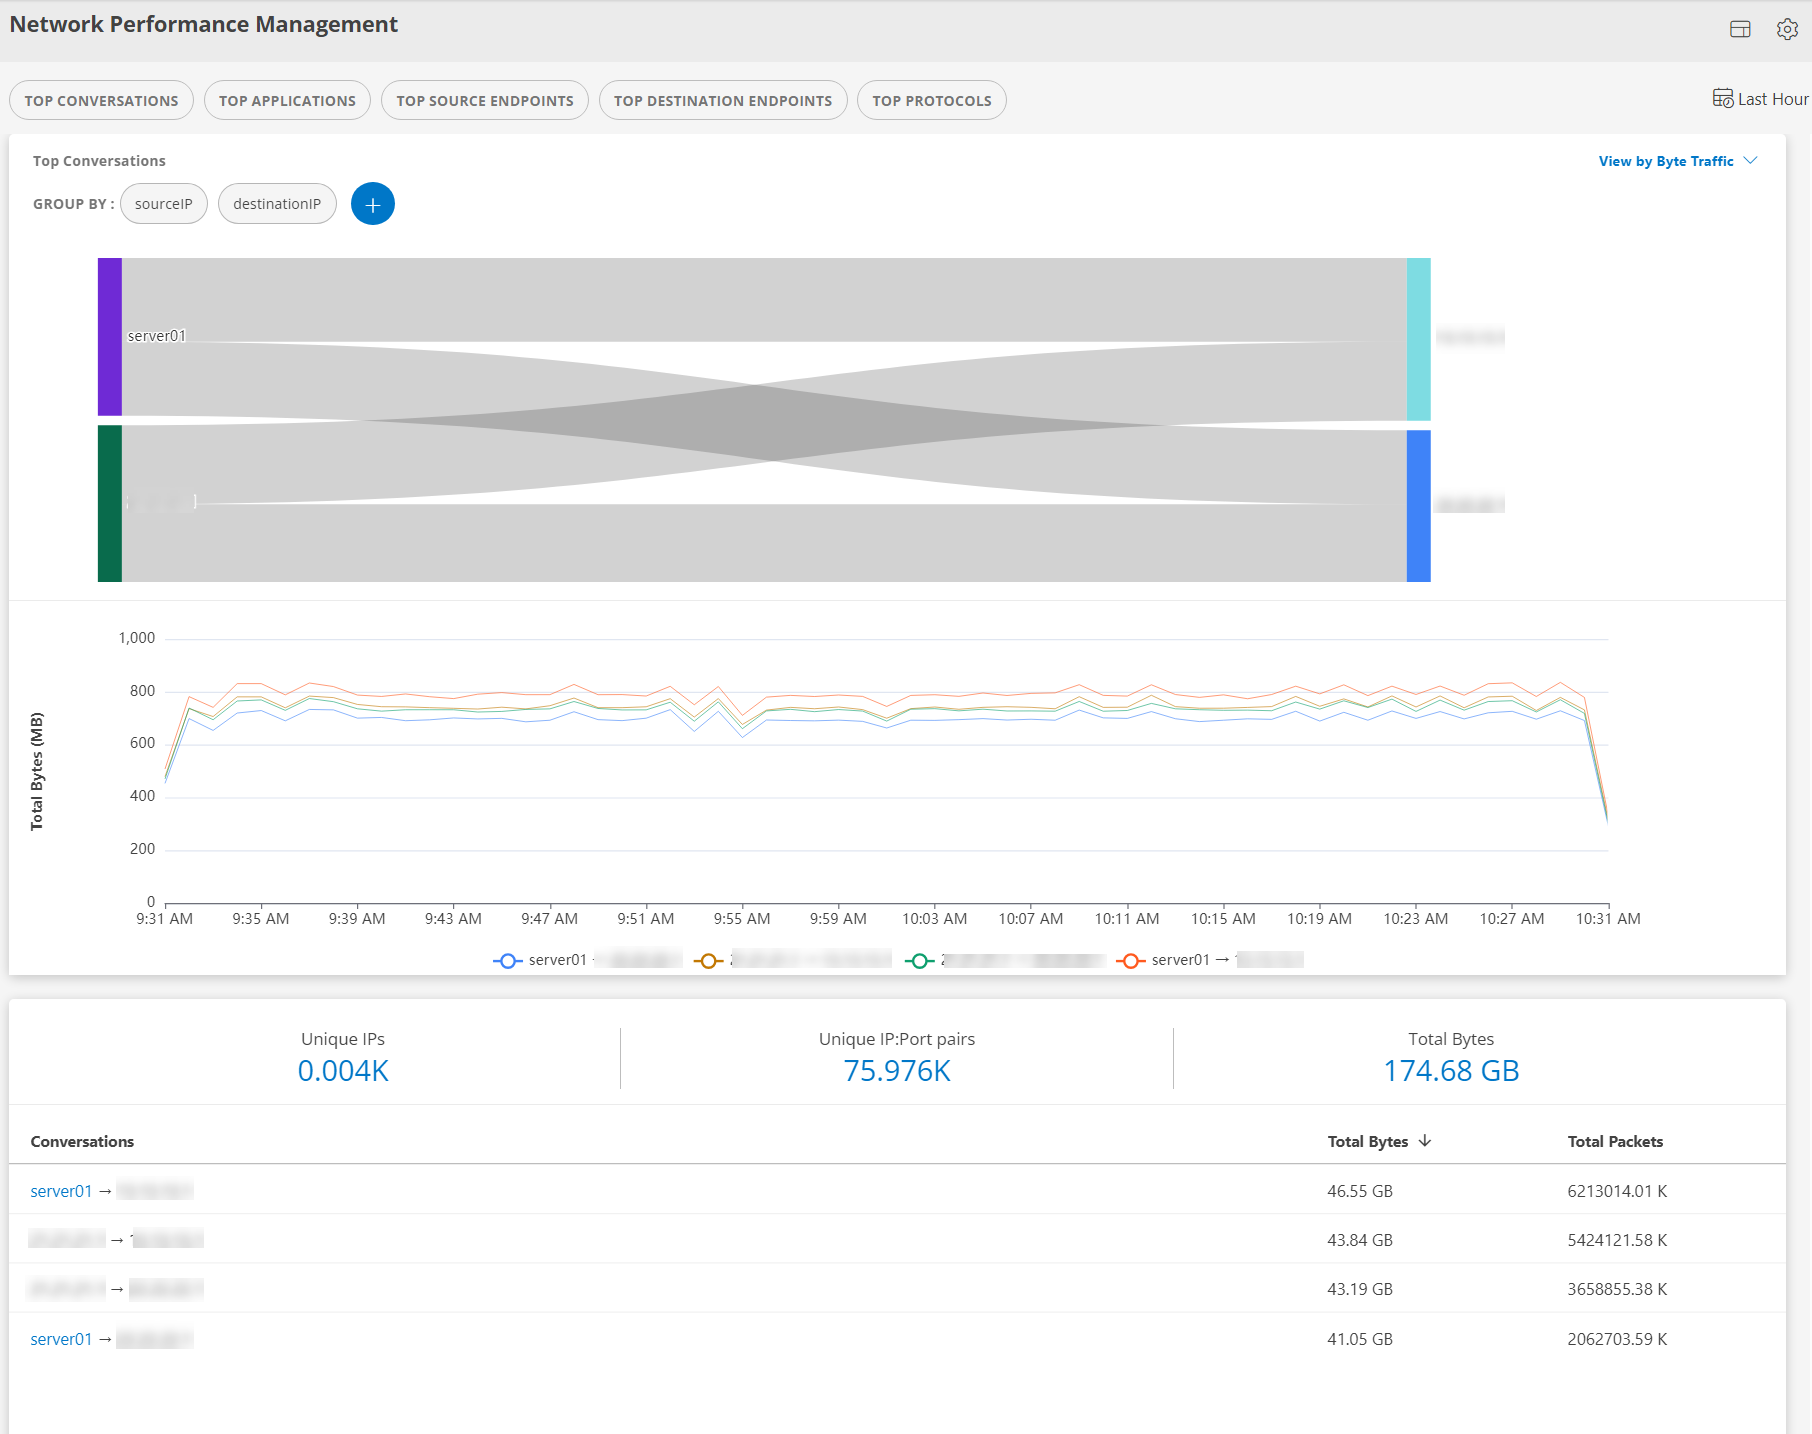
The Network Performance Management is your home base where you can view the information regarding flow records generated by network devices. The dashboard provides insights into your network’s performance through various metrics and visualizations. You can view a visual representation of the flow records, including top conversations, applications, source endpoints, destination endpoints, and protocols.
Navigate to Infrastructure > Net Flows to access the NPM dashboard.
Click on any component within the dashboard interface to activate a dropdown menu, from which you can select other components to interact with.

Dashboard Components
Refers to a section or visualization that displays information about the most active communication exchanges (conversations) occurring within a pair of network endpoints (source and destination).

Refers to a section or visualization that provides insights into the applications or services consuming the most network resources within the monitored environment. These applications could include business-critical applications, web services, file-sharing applications, streaming services, and more.

Identifies the network devices generating the most outbound traffic within the network. These endpoints could include computers, servers, or other devices that initiate communication with other devices or services.

Identifies the network devices receiving the most inbound traffic within the network. These endpoints could include servers, routers, gateways, or any other devices that are the intended recipients of communication from different devices.

Identifies the protocols that are most used for communication within the network. Protocols govern how data is transmitted, received, and interpreted across the network infrastructure.

The Select Device, Select Interface, Ingress, and Egress options allow you to specify the network device, interface, and direction of traffic flow for monitoring and analysis purposes.

The View by Byte Traffic and View by Packet Traffic dropdown options provide you with the ability to choose how you want to view and analyze network traffic data. These dropdown options allow you to toggle between viewing network traffic metrics either by the total number of bytes transferred or by the total number of packets transmitted.
View by Bytes traffic
View by Packet traffic

Graphs
- Sankey Graph: Displays the flow of data between different nodes in your network. Selecting any of the top metrics will generate a Sankey graph illustrating the data flow.
- Time Series Graph: Provides a visual representation of the selected metric over time. This graph allows you to track changes and trends in network performance.
Note
You can use hide or unhide option to hide specific conversations. This feature allows for better focus on the remaining trend graph metrics.
Query
The query option allows you to specify criteria to filter the data displayed on the dashboard. You can filter by time range, specific applications, protocols, endpoints, etc.

Click the arrows to enter a default query to filter the data displayed on the dashboard.

Group By
This feature enables you to group the data based on different parameters such as application, protocol, endpoint, etc., providing a more granular view of your network traffic.
Other Components
The dashboard is also designed to offer insights into various aspects of network traffic, including unique IPs, unique IP pairs, total bytes transferred, and conversations.
Unique IPs: This section displays a count of unique IP addresses observed within your network environment. This metric helps you understand the number of distinct devices or endpoints communicating across your network.
Unique IP:Port pairs: You will find a count of unique combinations of IP addresses and port numbers observed in network traffic. This metric provides insights into the diversity of communication channels and services utilized within your network infrastructure.
Total Bytes: This section presents the total volume of data transferred over the network during the specified time. Monitoring total bytes helps you track overall network utilization and identify periods of high or low data activity.
Conversations: This table offers a detailed view of communication exchanges (conversations) occurring within the network. Each row represents a unique conversation between source and destination endpoints, displaying information such as source IP, destination IP, port numbers, and total bytes/packets transferred.
You can sort the conversations table based on various criteria to identify specific communication patterns.

To select a source or device from the Conversations, click on the respective row corresponding to the source or device. Upon clicking, the dashboard will redirect you to the resources page, where you can view detailed information about the selected source or device.

- Settings: From the settings, you have the option to configure the retention period and size limit for the flow records.

- Retention Period: The retention period specifies how long the flow records are retained in the system before being automatically deleted. The maximum data retention period is 30 days.
You can configure the retention period by selecting the number of days from the drop-down list.
- Size Limit: The size or count limit sets a threshold on the amount of storage allocated for storing flow records. You will receive warning/critical notifications when the storage size approaches the specified limit.
OpsRamp will continue to collect data even if the configured data size limit is exceeded. You can monitor data usage by navigating to Dashboard -> NPM Usage/Health Statistics.
For instance, a warning notification is triggered when the size or count reaches 80% of the specified limit, while a critical notification is generated at 90% of the specified limit.
Note
In case both the size and count are configured, an alert will be issued if either of them crosses the threshold.Related Topics
Click the NPM overview Dashboard icon to navigate to NPM Usage/Health Statistics section.
