Checking Gateway Running Status
Use the following command to verify whether NextGen Gateway POD (nextgen-gw-0) is running or not.
Example:kubectl get pods
If you see the POD status as Running, it means NextGen Gateway is running successfully.
To ensure that the gateway tunnel is properly established to the cloud, use the following command to verify the vprobe container logs.
Example:kubectl logs nextgen-gw-0 -c vprobe --tail=200 | grep TlsMonComm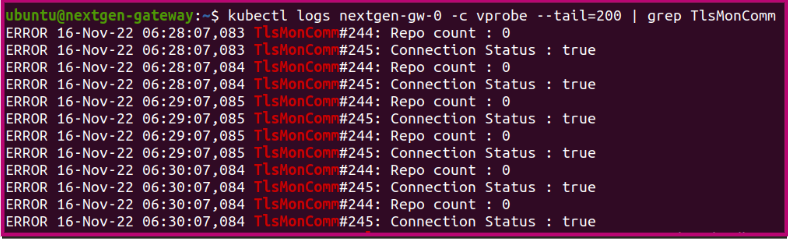
Make sure that the connection status is True. If the connection is False, use the following command to check the complete vprobe logs for additional information.
kubectl logs nextgen-gw-0 -c vprobe -fIf you see POD status other than Running, then you must debug the pod. Use the following command to check the current status of the POD.
Example:kubectl describe pod ${POD_NAME}ubuntu@nextgen-gateway:~$ kubectl describe pod nextgen-gw-0 Name: nextgen-gw-0 Namespace: default Priority: 0 Node: nextgen-gateway/10.248.157.185 Start Time: Fri, 28 Oct 2022 16:57:45 +0530 Labels: app=nextgen-gw controller-revision-hash=nextgen-gw-6744bddc6f statefulset.kubernetes.io/pod-name=nextgen-gw-0 Annotations: <none> Status: Running IP: 10.42.0.60 IPs: IP: 10.42.0.60 Controlled By: StatefulSet/nextgen-gw
Note
If a POD is stuck in the Pending state, it cannot be scheduled onto a node. Generally this is due to there are insufficient resources of one type or another type which prevents scheduling. The scheduler should send you messages explaining why it is unable to schedule your pod.
If a Pod is in the Waiting state, it means it was scheduled to a worker node but cannot run on that node. Again, the output of the kubectl describe command should be useful. The most common cause of Waiting pods is an image failure.
Accessing Gateway Logs
Kubernetes keeps detailed logs of all cluster and application activities, which you can use to narrow down the causes of any failures.
You can access the gateway logs in two ways:
- Using kubectl command
- Accessing log files directly from node
1. Using Kubectl command
The kubectl command is the built-in way to view logs on your Kubernetes cluster.
How to view detailed logs for each container ?
- To check the detailed logs for each container, first we need to get the pod name using the following command.
kubectl get pods -A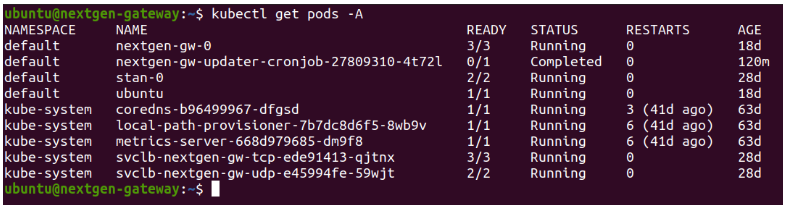
- Now, if we want to check the nextgen-gw-0 pod logs and the list of containers running within the POD, use the following command.
kubectl get pod nextgen-gw-0 -o="custom-columns=NAME:.metadata.name,CONTAINERS:.spec.containers[*].name"
To check the container logs, use the following command.
kubectl logs <pod name> --container <container name> -fTo check the previously terminated pod logs, use the following command.
kubectl logs <pod name> --container <container name> -f -p
Vprobe Container Logs:
Vprobe container is a core container and if any issues observed with connectivity issues, discovery, monitoring, scheduling, app install/uninstall, and app upgrade then you must to verify the vprobe container logs.
kubectl logs nextgen-gw-0 --container vprobe -fNativebridge Container Logs:
Nativebridge is responsible for native commands and script executions. If you observe any issues with modules that use native commands or script executions, you should check the nativebridge container logs.
Example: Ping, EMC VNX, EMC VNXe, EMC ClaRiion, RSE etc.
kubectl logs nextgen-gw-0 --container nativebridge -fPostgres Container Logs:
Postgres container is responsible for persisting the data. If you observe any issues with postgres container startup, you should check the postgres container logs.
kubectl logs nextgen-gw-0 --container postgres -f2. Accessing log files directly from node
If the Kubernetes service is down and needs to verify the pods logs, then the above approach will not work. In this case you can directly access the log files from the node.
Kubernetes by default store logs in the /var/log/pods/ location in the node. You can also manually check the logs from this location.
Example: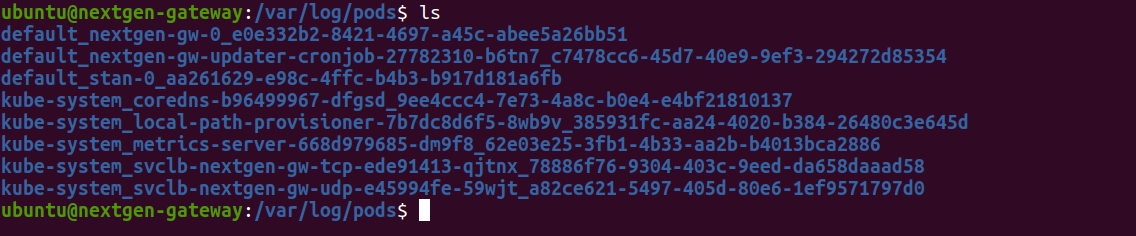
You can change the directory to the required pod and find the container folders inside it.
Debugging Connectivity Issues
Unable to register the NextGen Gateway ?
OpsRamp IP should be reachable from the gateway. Refer to this link for OpsRamp IP list.
Example:Note
If you cannot find the required POD public IPs in the above link, please contact the OpsRamp SaaS team.telnet ${OPSRAMP_IP} 443Openssl should work properly. See the below examples:
Direct Connection
openssl s_client -connect ${OPSRAMP_IP}:443Proxy Connection
openssl s_client -connect ${OPSRAMP_IP}:443 -proxy ${PROXY_SERVER_IP}:${PROXY_PORT}
The Gateway tunnel is not up after registering the gateway ?
Opsramp connection grid ip should be reachable. See the below example for your better understanding.
You can find the connection node ip address from vprobe logs using the following command.telnet ${CONNECTION_NODE_IP} 443
Here you can copy the Host value.ERROR 17-Nov-22 06:03:10,330 TlsMonComm#189: CommChannelsProcessor. Connection Node : {"httpHost":"cn01-gi01-sjc.opsramp.net","httpPort":8443,"tlsHost":"cn01-gi01-sjc.opsramp.net","tlsPort":443,"resourceToken":"GWXHWfRnBfFj","apiHost":"nextgen.asura.api.opsramp.net"}(cn01-gi01-sjc.opsramp.net)Openssl should work properly. See the below examples:
- Direct Connection
openssl s_client -connect ${CONNECTION_NODE_IP}:443 - Proxy Connection
openssl s_client -connect ${CONNECTION_NODE_IP}:443 -proxy ${PROXY_SERVER_IP}:${PROXY_PORT}
- Direct Connection
Verifying Memory Usage
To verify the memory usage in Kubernetes pods, make sure that you have enabled the metrics server in the Kubernetes cluster. Kubectl top command can be used to retrieve snapshots of resource utilization of pods or nodes in your Kubernetes cluster.
Verify POD memory usage
$ kubectl top pods
NAME           CPU(cores)   MEMORY(bytes)
nextgen-gw-0   48m          1375Mi
Verify Node memory usage
$ kubectl top nodes
NAME              CPU(cores)   CPU%   MEMORY(bytes)   MEMORY%
nextgen-gateway   189m         9%     3969Mi          49%