Metrics in OpsRamp Monitoring allow you to track resource performance and system health. This section covers how to manage metrics, understand their formats, and use export/import features for efficient monitoring.
Create a Metric
To create a metric,
Login to OpsRamp portal.
Navigate to Setup > Account.
Click the Monitoring card. The following page is displayed.
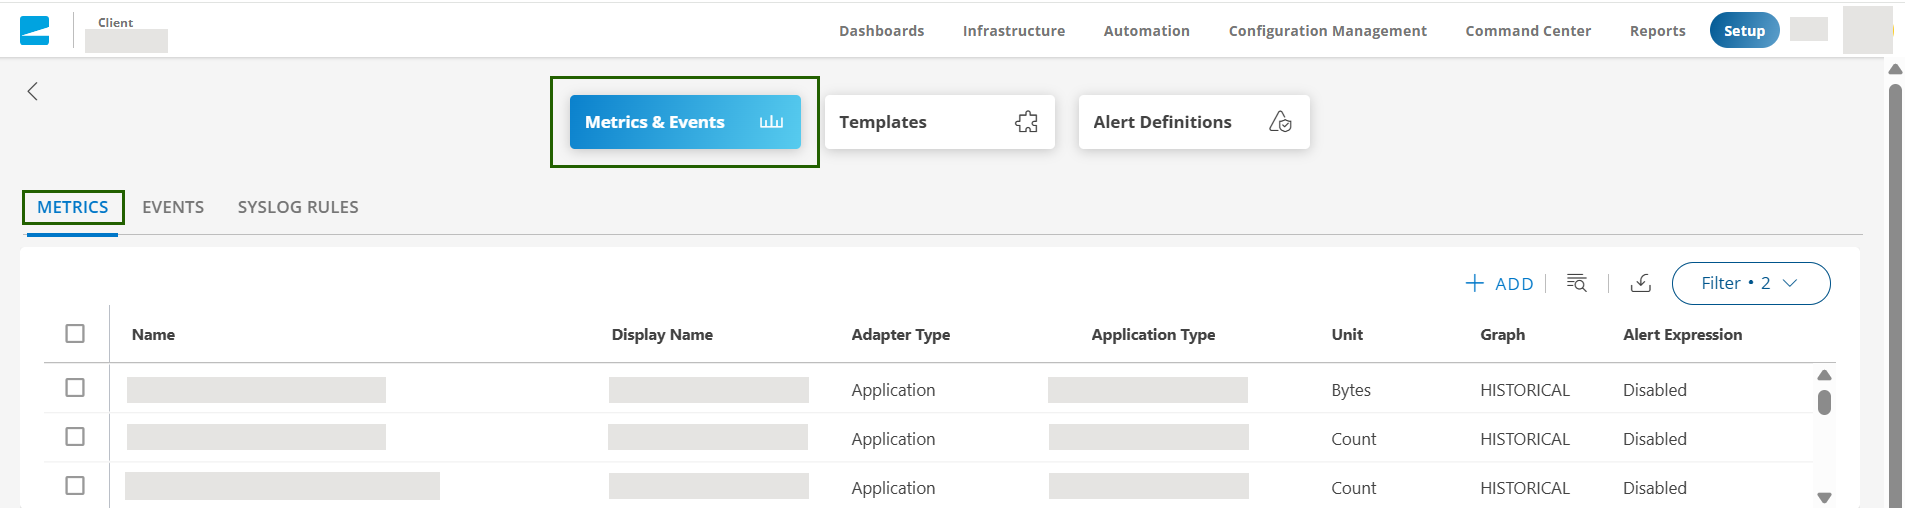
In the Metrics tab, click +ADD. The ADD METRIC page is displayed.
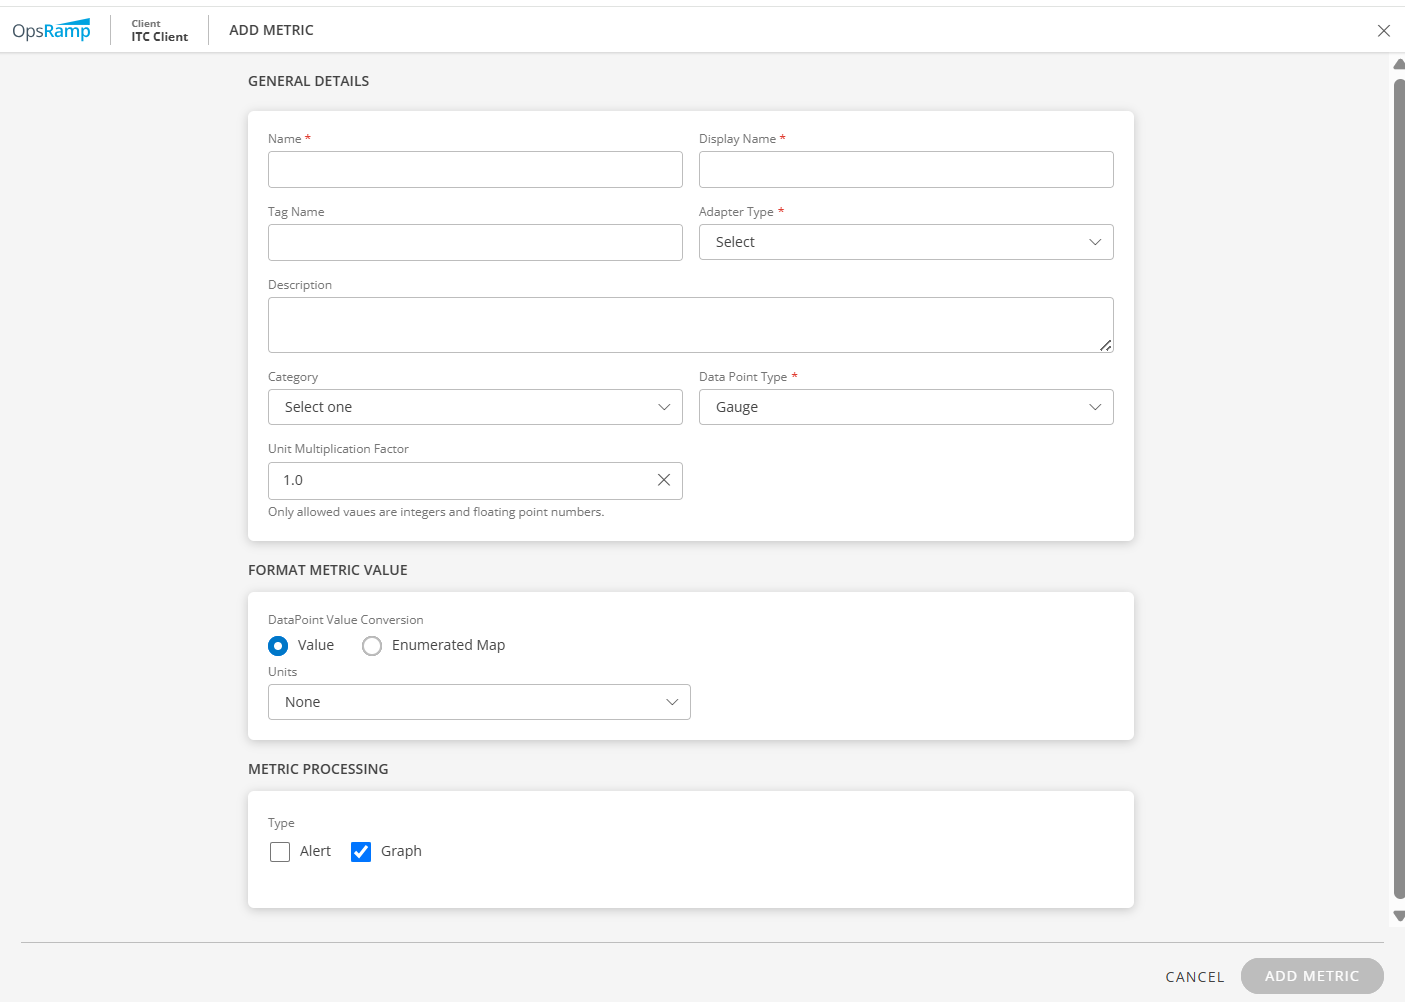
Enter the following field details:
Section Field Description General Details Name Unique name for the metric. For example, apache_tomcat_webapps_count_.Display Name Enter Display Name. For example, System Drive Free Space. Tag Name User-defined tags for better filtering. Adapter Type Select from: - Application, for which you also need to select a value for Application Type and Attribute.
JMX, for which you also need to enter value for Class/Attribute path. - Derived Metric, for which you need to select Metric from the Metric Query drop-down list in Query Builder.
Description Provide additional details for the metric. Category Select the appropriate category for the metric. Data Point type Value chosen to plot data in the graph. Unit Multiplication Factor Value chosen to multiply a value based on the chosen unit. Format Metric Value DataPoint Value Conversion Options are: Value:To populate data using values. Select the appropriate unit from the Units drop-down.Enumerated Map: To populate alert and graph details after adding the states such as Up or Down. The screen displays a section where you can add the state descriptions and select Alerts and Graphs to populate data.
Query Builder (for Derived Metric type only) Frequency The time interval to run the query. Metric Processing Type Select Alert and/or Graph checkboxes for metric processing type.
Alert allows you to setup a warning or critical alert based on the metric, threshold, and repetition.
You can also decide how to display the alert details by adding a format in Alert Subject and Alert Content fields.Query Builder(for Derived Metric type only) Frequency The time interval to run the query. Metric Query Query expression used to retrieve and aggregate metric data. Query Result Results returned by the metric query. Labels Map (for Derived Metric type only) Name and Value Click +ADD LABEL to add details about label maps. - Application, for which you also need to select a value for Application Type and Attribute.
Click ADD METRIC. The metric is added and is available in the metrics list.
Metric name format
The following are acceptable formats for a metric name:
- Metric names should not contain a dot (.), instead use an underscore (_) between the words.
system.cpu.usageis not validsystem_cpu_usageis valid - A metric name can have a maximum of ten underscores “_”. A metric name cannot start or end with an underscore.
- A metric name can contain numeric values (0-9), but cannot start with a numeric value.
- A metric name should be case-insensitive.
- The length of the metric name should be less than or equal to 255, including underscores.
Graphs with New Metrics data
The following table details the graphs.
View details
| Property | Expected Behaviour | Workaround / Details |
|---|---|---|
| Graphs plotting frequency Vs Monitoring Frequency | The graph shows raw samples based on default step value: 1min i..e the plotting frequency for graphs irrespective of configured monitoring frequency. |
|
| Graphs plotting behavior |
| To avoid plotting gaps, ensure that the metric collection frequency matches the default graphing frequency or adjust the graphing frequency to match the metric collection intervals which is less than or equal to 5 minutes. The recommend monitoring frequency for any metric should be <= 5 minutes |
| Visualize Real-time data | The data points for new metric graph data are calculatedly plotted every 1 min except at the frequency time-interval. In order to view real-time data, the metric graphs offer displaying the actual timestamps when the data was collected.Status and availability metrics need to show when data collection stopped, indicating a resource or service outage. | Graph > Expand Info section > shows “Real Time Data” option. |
| Metrics Details | In the new metrics system, templates that describe the relationship between different metrics are not available. User might see the legacy metrics name while detailing, which is expected behavior and these will be slowly transitioned to show in the new metric nomenclature. | To view the relationships between template and metrics, navigate to the Monitors tab where detailed information is provided. |
| Default Time Period for Graphs | Default time-period has been set as 1 Hour from the existing 4 Hr window | Default Time-period is now set 1H |
| Multiple metrics | The new metric visualization supports only a single metric graph data. | The new metric visualization doesn’t support multiple metric graph data visualization due pagination and hence not available. |
View Metrics
You can view the list of all metrics in the Metrics page.
The following table provides details of each field.
| Attributes | Description |
|---|---|
| Name | Unique name for the metric. |
| Display Name | Display name for the metric. |
| Adaptor Type | Collector type that you want to use to gather metric data. |
| Application Type | Technology associated with the metric. |
| Unit | Metric value unit. |
| Graph | Configured critical or warning expressions. |
| Alert Expression (Warning/Critical) | The configured critical or warning expressions. |
| Description | Metric description. |
Export a metric
The Export functionality allows you to save a metric in CSV or JSON format. Follow these steps to export a metric:
In the Metrics tab, search for the metric(s) you want to export.
Select the metric(s) and click Export.
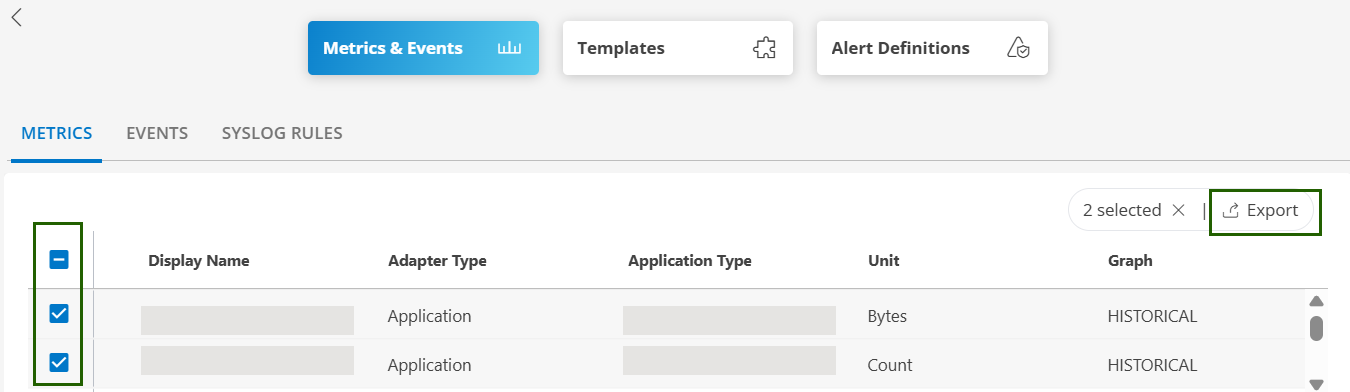
The metric is exported.
Note
If no specific metric(s) are selected before exporting, all the available metrics in the scope will be exported, by default.
Import a metric
The Import functionality allows you to import a CSV or JSON formatted metric file as a metric. Follow these steps to import a metric:
In the Metrics tab, click the Import icon and then click Upload.
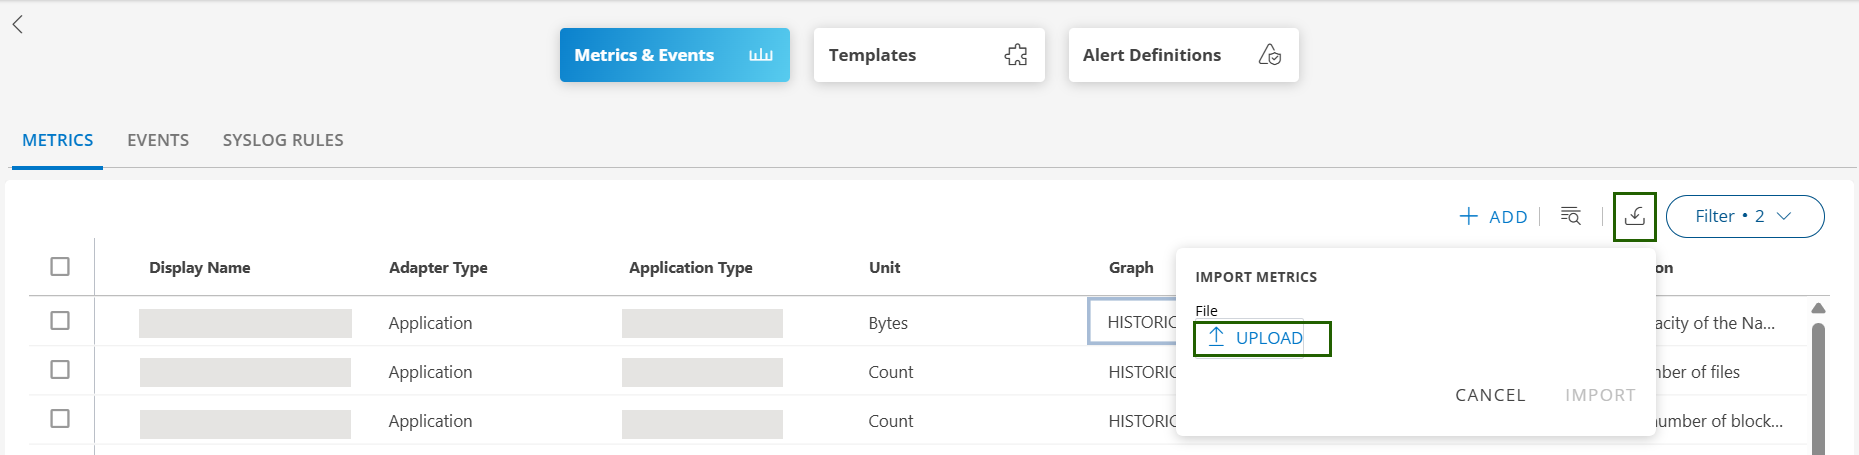
Select a file to upload. Supported file formats are JSON or CSV.
Click Import. The metric is imported and the details are shown in the Import Metrics page.
If the import fails, a message is displayed with the reason for the failure.