December 2021
We are excited to announce our Fall 2021 (v11) update!
Discovery and Monitoring
Office 365 discovery and monitoring support
Office 365 is a tool suite of choice for many organizations that enables teams to do their core job functions in a single integrated cloud-based SaaS solution. Ops teams and tools admins that manage subscriptions, licenses, and consumption of Office 365 require visibility into the application suite to drive better usage forecasting and financial planning. OpsRamp now supports the discovery, monitoring, and visualization of the Office 365 suite so that tools admins and Ops can centralize performance data from their infrastructure with that coming from their Office 365 environment.
HTTP response code monitoring in synthetics
HTTP response code monitoring enables SREs and Ops teams to more easily track the availability of their applications by focusing on the response received by the services hosting the application. OpsRamp provides the ability to specify a URL endpoint and set the expected response code so deviations can be easily surfaced to SREs and Ops to take action. Within HTTP(s) based synthetics, SREs and Ops can specify the expected response codes. If the response code specified is not returned, an alert is generated, and the location availability is impacted. Quick response to deviances in response codes means that SREs and Ops can take action before application availability is impacted and SLAs are breached.
Zoom discovery and monitoring
Zoom connects teams and provides the ability to effectively communicate while working remotely. Tool admins and Ops teams can now gain visibility into their Zoom accounts within OpsRamp. With a focus on Zoom usage and plan consumption, users can visualize Zoom metrics in Dashboards, view their account details, and report on their Zoom utilization back to the business for financial planning and account management. Centralizing insights from Zoom, along with the rest of the IT infrastructure, consolidates the view for Ops and Tools teams and drives collocation of critical data within a single platform.
Multi-tier default dashboard support for Dashboard 2.0
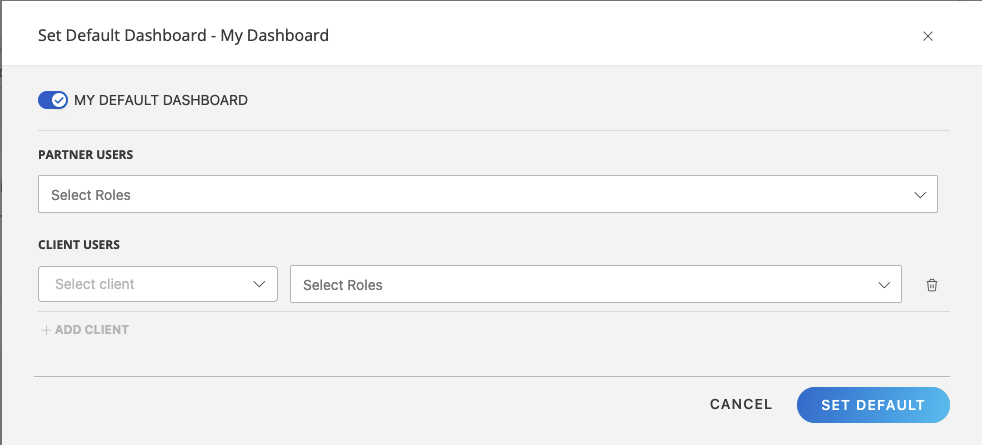
We have enhanced Dashboard 2.0 to support setting default dashboards at the client and partner levels based on role.
Limitation: Only client administrators and partner administrators can set default dashboards for other users.
OpsRamp data source for Grafana
Grafana serves as the monitoring hub for SREs and DevOps teams around the world. As a member of the cloud-native community, OpsRamp proudly announces that it is now a data source for Grafana. SREs and DevOps teams can leverage the metrics being collected by OpsRamp to be used in Grafana. Whether it is SNMP, VMware, WMI, Prometheus, or other monitoring integrations, SREs can visualize metrics in Grafana and use OpsRamp as their datastore for persistent storage and long-term retention.
Resource availability metrics
Availability represents the ability or aptitude for a service, application, or infrastructure element to do the required tasks in a way that works for the business. Insight into the availability of applications, services, and infrastructure provides Ops teams with more control and visibility over their managed resources. OpsRamp now provides Ops teams the ability to granularly visualize, alert, and report on availability metrics over time. This enhanced control enables Ops teams to watch the high-level metrics that provide early warning indicators of service degradation before an SLA is breached.
PromQL support in alert definitions
Alert Definitions now support the ability to set PromQL queries. Administrators can now create query-based alert definitions that span multiple resources, applications, and metrics. This flexibility enables administrators to create more meaningful alerts, which results in less alert noise and drives focus to higher-level constructs, such as applications, clusters, or sets of hosts responsible for delivering and providing a service to an end-user.
Constraint: Limited to automonitoring-enabled clients.
Event and Incident Management
Business hours in alert escalation policies
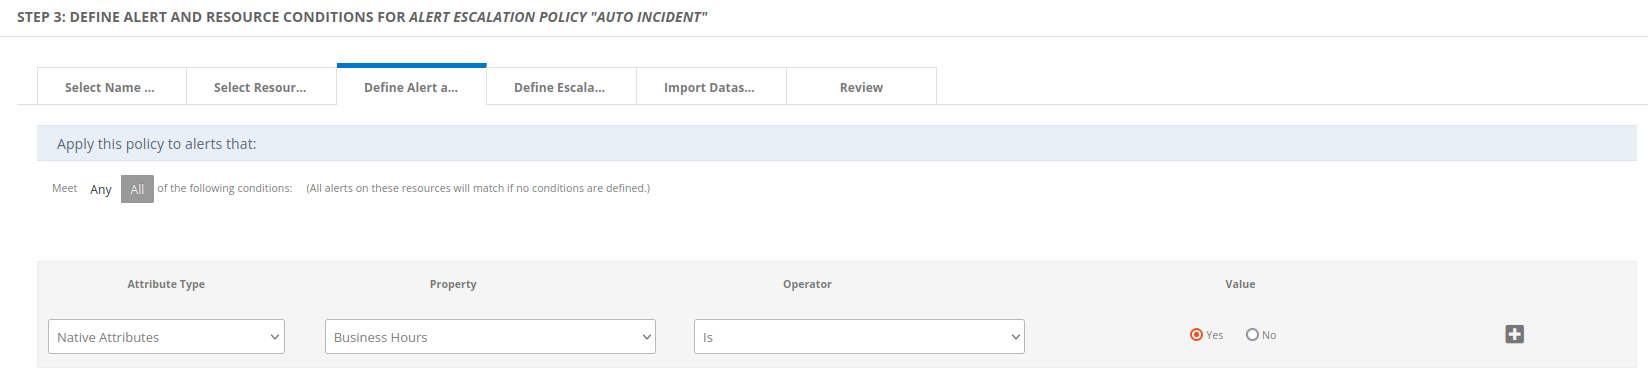
We have introduced a new attribute to allow triggering and filtering of Alert Escalation policies based on the Business Hours defined under client settings.
Business hours in service desk SLAs
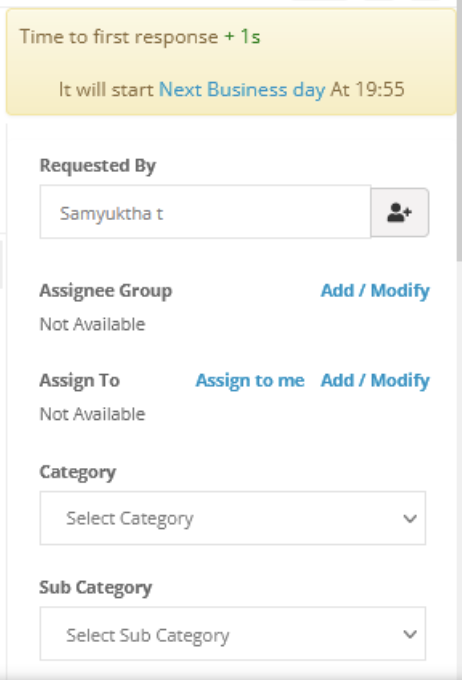
We have enhanced Service Desk SLAs such as time to first response and time to resolve will now only include the hours defined as business hours in client settings.
Wild card filter for learned configuration at alert escalation
We have introduced wildcard expressions to the learned configuration training file used in Alert Escalation. By using regex, we no longer require an exact match to detect patterns.
Alert enrichment reformatting of the alert subject message
We have added the ability to run a process automation workflow to update and enhance the alert subject for ingested alerts that may not have sufficient details.
Create a correlation method where incidents are opened immediately
We have removed the stop-gap that caused a delay in incident generation from alert escalation policies when executed subsequently with alert correlation policies. Incident generation will now occur.
Alert suppression based on a counter
We have introduced a new attribute called Alert Occurrence Frequency to First Response Policies that will suppress the alert based on how many times it occurs within a user-defined time interval.
Remediation and Automation
Support for Windows Defender antivirus
Support for windows defender anti-virus is added.
Dynamic process workflow script tasks
Workflows script task now supports dynamic input using decision tables.
Controls to install only baseline patches
Patch workflows support the ability to install just the chosen baseline of patches. Before this, the agent would install all the approved patches when a patch installation was triggered. With this change, a user can now control which specific baseline of patches need to be installed when the patch installation happens.
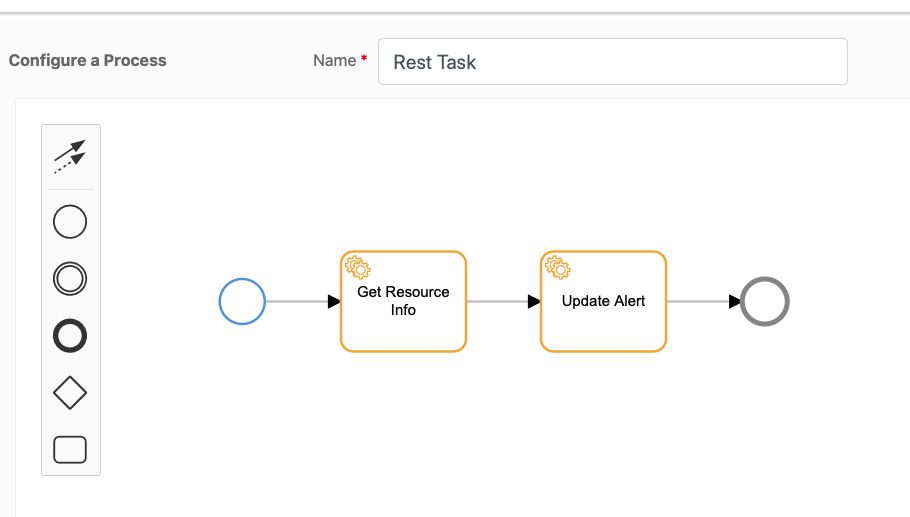
Nested process automation workflows
Workflows now allow you to call an already-defined process definition as a subprocess of another process definition. This way you can reuse existing workflows and do not have to redesign an entire workflow for every small customization.
Platform
Ability to run FreeBSD agent as a non-root user
Now you can install and run the agent as a non-root user on the FreeBSD operating system. Previously, the FreeBSD operating system agent worked only with root users.
Update agent screen legacy issues and improvements
Now you can find the agent update status directly from the Setting > Monitoring > Update Agent page. This feature will give more visibility about agent update status and in case of agent update failure the reason is shown in the UI.
Separate permission for scheduled maintenance
A new permission is added to control privileges to view/manage scheduled maintenance. Scheduled maintenance permission was earlier embedded in the device manage permission. With this change, users no longer need to be given device manage permission if the idea is to let them manage the maintenance of resources.
Week of November 9, 2021
| Update Type | Category | Change Description |
|---|---|---|
| Enhancements | API Framework | Client create API should support all attributes as are supported in the UI Added support for more attributes to the client creation API |
| API Framework | API : Re-try endpoint to re-process failed events Integration admin users can now automate retries of the failed events logged in the audit logs, for a given integration, using an API endpoint, which enables successful execution of the failed events . Constraints: Only valid payloads that failed due to network failures or time-outs can be successfully retried. The Activity endpoint is able to query audit logs for:
New events endpoint, retry action:
GET Activity endpoint update to query based on timestamp and better response payloads:
| |
| Agent | Agent download redirection from Application server to Download server to fix download issues Agent download and updater binaries are moved from the Application Server to the Download Server to smooth the agent download and update process. Make sure outbound access to the IPs is allowed: https://docs.opsramp.com/support/reference/public-ip-addresses/#agent-and-gateway-whitelist-ip-addresses | |
| Availability | Availability Report: Add Scheduled Maintenance | |
| Cloud Monitoring | Separate category for azure events alerts | |
| Cloud-Native Monitoring | Monitor Kube virt component and VMs deployed using kubevirt in K3S cluster? | |
| Cloud-Native Monitoring | Kubevirt discovery and monitoring | |
| Cloud-Native Monitoring | Template based for Kubevirt | |
| Core Platform | Resource types for web/network endpoint monitoring | |
| Patch Management | "Next patch Schedule Date" added to device->patch details page 'Next patch Schedule Date' is added to the patch information tab of the device details page | |
| Reports | Allow editing in Batch Exports | |
| Tenancy and RBAC | Added support for more attributes to the client creation API | |
| UI | UI representation for new resource type "Endpoint" | |
| UI | View Display Name instead of resource type in Configuration of SDK apps | |
| Issues Fixed | API Framework | API - Create Alert Escalation Policy - error when filtering alert by Resource Type |
| API Framework | Resource API details Incorrect or missing using API | |
| Alert Management | API to Get alert details by alert ID using msp id not working | |
| Alert Management | Webhook integrated alerts create new resources | |
| Alert Management | Conversation is not being added to ticket for the repeated alerts | |
| Cloud Monitoring | Issue with the discovery of sub device | |
| Core Platform | post_elastic_async_activities_queue size is increasing | |
| Dashboard | [Y2S:5155] Metric List widget shows only one metric. | |
| Dashboard | Emailed dashboard does not properly filter based on site | |
| Dashboard | in Dashboard 2.0 metrics are not showing | |
| Integration Framework | vCenter is not deleted after uninstallation | |
| Integrations | Meraki integration fails with "com.opsramp.json.JSONNull and com.opsramp.json.JSONArray are in unnamed module of loader 'app'" | |
| Knowledge Base | In Knowledge base, after editing a category, page is not auto refreshing, edited name is not reflecting for the category. Also add article button is not getting displayed | |
| Monitoring Management | Unable to find monitors in EUPOD1 | |
| Patch Management | Correct installed status and missing status in resource patch scan | |
| Patch Management | CSRF-delete-app-patch | |
| Remote Consoles | Recorded data cannot be played back | |
| Reports | No Console audit report for few users | |
| Resource Management | EOTSS Creating resource group filter is failing | |
| Resource Management | Get Resource API returning 500 server error for cloud resources | |
| Resource Management | Post 10.0 update, resource that SNMP traps were posting to changed | |
| Resource Management | Issue in getting paginated resources for Resources Indexing | |
| Resource Management | Netapp Storage Dependency Map Graph Data blocking Graph data Queue processing | |
| Service Management | Mail notification do not send in specific situation | |
| Tenancy and RBAC | "Edit" and "Re-Sync" option are displayed without permissions | |
| UI | MetricStream - Docker Container Alerts page(unable to see Overview tab on Docker Containers.) | |
| UI | OpsRamp UI Graphical Bug | |
| UI | when search option is used "Add script" buttion is grayed out | |
| Documentation Changes | — | Updated Alert Enrichment to Alert Problem Area to reflect interface changes. Renamed Alert Enrichment to Alert Problem Area in the documentation to align with interface changes. |
| — | Added 180-day alert occurrence history to data retention policies topic. Added 180-day alert occurrence history to data retention policies topic. | |
| — | Explain the smartness in smart filters when assigning templates with Device Management policies | |
| Patch Management | Added the Define a Patch Management Process tutorial to show how use the the patch management service to automate some patch management processes. Added the Define a Patch Management Process tutorial to show how use the the patch management service to automate some patch management processes. | |
| Process Automation | Added information on searching and filtering of the process definitions list based on date, start event, enabled, deployed, and start even object. Added information on searching and filtering of the process definitions list based on date, start event, enabled, deployed, and start even object. | |
| documentation | Agent and Gateway N-2 support policy clarification Provided clarification of versioned agent and gateway support policies. |
Week of October 19, 2021
| Update Type | Category | Change Description |
|---|---|---|
| Enhancements | — | Add advanced filter option into patch feed |
| — | Bulk whitelist and rating delete actions | |
| Alert Management | Schedule maintenance create rule for Resource Name | |
| Integration Framework | Azure Event Exports: webhook bug in custom integration does not allow breaks/fails JSON array as payload | |
| Patch Management | Bulk whitelisting of patches in the feed | |
| Resource Management | API: Enable query of the list of Windows services running on a Windows Server resource | |
| Issues Fixed | — | Hide invalid integrations, synthetics, and gateway from Onboarding Wizard |
| API Framework | Deletes using the API are not consistent | |
| Alert Management | Alerts are not correlating although they are out of maintenance | |
| Alert Management | Not showing matching escalation policy on Alert Details page if the filter condition has ResourceType | |
| Alert Management | Do not suppress OK alert through first response | |
| Alert Management | Alert Escalation page loads slowly | |
| Alert Management | Able to view the Deleted policy values in Alert Enrichment | |
| Cloud Monitoring | AWS stream event alerts are not appending under the same alert | |
| Cloud Monitoring | Issue with subdevice discovery | |
| Dashboard | Classic dashboard widget information unavailable | |
| Dashboard | When selecting the top consumers option in Browser Consoles Statistics, not receiving data | |
| Integration Framework | hnas_node_Status related monitoring graph is not populating | |
| Integration Framework | Meraki integration failing with class com.opsramp.json.JSONNull cannot be cast to class com.opsramp.json.JSONArray | |
| Integration Framework | Support for JSON array in outbound webhook payloads | |
| Knowledge Base | UI issue while creating new knowledge base article | |
| Patch Management | In Patch Feed Integration, Search with Date is not working correctly | |
| Process Automation | Scripts section has a searching scripts problem | |
| Remote Consoles | Webconsoles are not working: login failure | |
| Reports | Unable to pull Patch Summary Report | |
| Resource Management | Azure resources do not show when applying a custom attribute | |
| Service Management | Summary Report does not have incident data | |
| Service Management | Unable to create an incident for an alert created using email integration, which includes special characters in the resource name | |
| UI | Metric name shows as Undefined in graphs | |
| Documentation Changes | — | Add raw alerts retention time in data retention policies |
| — | Difference between occurrence frequency and number of occurrence in escalation alert conditions | |
| — | Describe the smartness in smart filters when assigning templates in device management policies | |
| Patch Management | Document process automation workflow changes for patch service | |
| Process Automation | Filter process definitions and process instances |
Week of October 12, 2021
| Update Type | Category | Change Description |
|---|---|---|
| Enhancements | Classic Gateway | Remove dependencies associated data and jobs from the gateway when the application is uninstalled |
| Cloud-Native Monitoring | Kubernetes YAML change for KubeVirt | |
| Cloud-Native Monitoring | KubeVirt UI | |
| Cloud-Native Monitoring | KubeVirt discovery message processing at cloud end | |
| Core Platform | Implement authentication from server side | |
| Integration Framework | Multiple vCenter integrations with same IP must be allowed | |
| Monitoring Management | Validate SNMP trap configuration using device groups | |
| Monitoring Management | Delete the device group mapping when the device group update/delete | |
| Monitoring Management | SNMP trap monitor confguration preparation to send gateway | |
| Monitoring Management | UI changes to display the available device groups and selected devicegroups in SNMP trap creation page | |
| UI | Alert definitions to be available in all clients | |
| Issues Fixed | Agent | Maintenance window issue |
| Classic App | Hyper-V integration: failing with message "Exception occurred while fetching the target Hyper-V device discovery data" | |
| Dashboard | Emailed dashboard does not properly filter based on site | |
| Dashboard | Metric List is not populating for synthetics while creating a time-series widget until characters are input in the search | |
| Integration Framework | Newline character does not send correctly to ServiceNow | |
| Monitoring Management | Failing to create Agent Custom Monitor scripts using the TemplateExport API | |
| Patch Management | Dependency patches are not approving from Process Definition | |
| Process Automation | Unable to save workflow with dynamic field Values in REST service task | |
| Reports | Audit logs do not show deleted device information | |
| Security | VA_Vulnerability observed on scripts activity in Resources | |
| UI | Unable to view Native Resource type under Components Attributes section | |
| Documentation Changes | — | SNMP TRAP configuration Improvement |
| Integration Framework | Cluster Gateway Syslog Adapter Installation |
Week of October 5, 2021
| Update Type | Category | Change Description |
|---|---|---|
| Enhancements | API Framework | Remove lower limit for phoneNumber in Create/Update Client API call |
| Alert Management | Alert notification delay | |
| Alert Management | When correlation policy is in observe mode, add a comment in alerFinished Datet regarding the matched policy and inferenceId details | |
| Alert Management | Show Mobile number instead of Contact while selecting a user in Escalation Notification | |
| Exports | Audit export report generation changes for recurring periods on Previous Month/Previous Week/Previous Day/Last 6 Hours | |
| Patch Management | Add more patch details to patch install task output | |
| Process Automation | Remove the Finished Date filter in the running instances page | |
| Process Automation | Add Output columns for the REST Task in the Decision table UI | |
| Process Automation | Implement UI to support dynamic values for the REST task | |
| Remote Consoles | Load balancing algorithm to pick console grid based on console protocol | |
| Remote Consoles | Video session fails to update when webconsole restarts | |
| Reports | Audit Batch Export | |
| Reports | Audit export backend scheduled changes | |
| Reports | Audit export UI support in Batch Export Listing | |
| UI | Include tenancy scope info as part of the onboarding wizard | |
| UI | Add link to launch SDK applications page | |
| UI | Dark mode UI changes on onboarding wizard | |
| UI | Install ported and SDK apps in the same client | |
| UI | UI issues in the dark theme DNM UI | |
| UI | Support dark mode in onboarding wizard | |
| Issues Fixed | API Framework | Audit report search API is not working |
| Alert Management | Incidents are not getting created | |
| Alert Management | Incorrect alert predictions | |
| Alert Management | Searching with 0 or any special character in alert search gives the wrong result | |
| Classic App | Integrations - Hyperflex Discovery API discovering incorrectly by storage IP | |
| Cloud Monitoring | Clicking on Install for External id integration, the pop-up is not initializing | |
| Core Platform | Wrong error message displaying while creating duplicate permission set | |
| Dashboard | Main dashboard takes time to load | |
| Integration Framework | Adapter category is showing in the Custom Integration section | |
| Integration Framework | Input field line borders are missing | |
| Monitoring Management | Monitoring threshold is not reflecting after the edition of the value it representing the same values as before editing only | |
| Patch Management | Getting we are sorry page for Patch Configuration Job if the process is deleted | |
| Patch Management | In Patch Configuration Job, the Select Process link is not shown if the recurrence pattern is changed | |
| Patch Management | Updating a job without a resource fails | |
| Process Automation | Custom integration Category Process Automation is not passing custom attribute | |
| Process Automation | Process definitions listing page is not loading sometimes | |
| Process Automation | Getting an error message when trying to run dynamic values for the REST service task | |
| Reports | Limiting visibility | |
| Resource Management | Agents are not reporting to the portal | |
| Resource Management | Device Overview page is blank | |
| Resource Management | Able to run Device Management Policy from different partner user login which is a security vulnerability | |
| SDK App | Triggering alerts on a metric which is not monitored | |
| Security | Fixed vulnerability in Infrastructure > Maintenance dialog | |
| UI | Some of the interface values for network devices are swapped in the UI | |
| UI | Alert notification permission denied | |
| UI | Install Integration link from Dashboard 2.0 does not work | |
| UI | Unable to view native resource type field under cloud_services generic resource attribute page | |
| UI | Overview page does not appear for cloud services resource | |
| UI | Client details are shown again when clicked on the network Details tab | |
| UI | When editing the client options are missing in remote access management | |
| UI | Update Service Groups API responses are taking an excessive amount of time | |
| UI | No error message is being displayed when attempting to log in with deactivated partner credentials | |
| Documentation Changes | Alert Management | Need documentation about noisy alerts |
Week of September 21, 2021
| Update Type | Category | Change Description |
|---|---|---|
| Enhancements | Alert Management | Add a count records API for pagination when consuming query service get records |
| Availability | Enhancement to the auto-heal job to support pod separation | |
| Cloud Monitoring | Monitoring support for Azure hosting environment | |
| Dashboard | API support for partner sharing | |
| Dashboard | Dashboard sharing in Dashboard 2.0 is enhanced to include partner-level roles. This allows dashboards to be shared with partner users.
 | |
| Evaluation | Remove Custom Attributes permissions | |
| Evaluation | Change image retrieval of email templates from URL to cid | |
| Evaluation | Resources limit should be configurable | |
| Patch Management | Add a new dropdown menu in the patch installation and approval tasks | |
| Patch Management | Numerous process list view improvements in the patch configuration policy | |
| Patch Management | Add emergency option to patch installation task | |
| Patch Management | Add emergency tag to patch approvals in workflow | |
| Patch Management | Show the Only Patch category process in the patch configuration policies | |
| Patch Management | Add search option in process dropdown for patch config policy | |
| Patch Management | controller support to return the list of baselines | |
| Patch Management | APIs for patch compliant/non-complaint resources | |
| Patch Management | Get compliant/non-compliant workflow patch service task | |
| Patch Management | UI implementation for get compliant/non-compliant workflow patch service | |
| Patch Management | Providing workflow patch service to get the compliant / non-compliant resource list by baseline for the selected compliance | |
| Patch Management | Handle emergency patch installation at tenant level | |
| Process Automation | Add a category filter to the process search API | |
| Process Automation | Implement UI to support dynamic values for REST task | |
| Security | Implemented xssfiterTag in msp tag library to nullify all event listeners | |
| UI | Disable showing SDK based apps in onboarding wizard | |
| UI | To restrict use of master agent, added not recommended text for agent management profiles | |
| UI | Onboarding Wizard | Enforce permissions | |
| UI | ui implement partner role sharing | |
| UI | Add UUID to GET /tenants/{tenantId}/roles/dashboard/{dashboardId} in ITOM | |
| UI | Add UniqueId column in console model | |
| UI | Document set default dashboard endpoint | |
| UI | Document get default dashboard endpoint | |
| UI | Recent searches in Infrastructure search | |
| UI | v2 Infrastructure Page | Recent Queries | |
| Issues Fixed | API Framework | How to get ended and plaining Resource Note using API |
| Alert Management | First Response suppression policy is not working | |
| Alert Management | Ticket with Agent offline generated for correlated alert was not auto-closed | |
| Alert Management | Some alerts are not being suppressed with the First Response policy | |
| Alert Management | FT-Alert Browser 2.0 is not showing any alerts | |
| App Framework | Fix adding account even if mandatory fields are not provided | |
| CS Grid | Alias names for VSP devices are missing during the daily discovery run | |
| Cloud Monitoring | AWS Cloud rescan failed | |
| Cloud Monitoring | Azure info was showing undiscovered resources | |
| Cloud Monitoring | Status is not reflecting immediately when performing a scan from onboarding flow | |
| Core Platform | Error creation of SimpleAPITemplate instance | |
| Dashboard | Fix issue of consoles showing active that have not been active | |
| Evaluation | FT-Issue with Infrastructure >> Resources tab | |
| Evaluation | The FT-Invited By column displays blank when a user is searched | |
| Evaluation | Unable to invite a colleague when a user is on the dashboard | |
| Evaluation | Duplicate Alert Definitions creating in name of GCP Firewall Dropped Packets | |
| Knowledge Base | Search KB Article API getting null data results on response body | |
| Monitoring Management | Fixed the hitachivsp_storage_Cha_Cache_Path_Usage_Rate metric not populating data | |
| Patch Management | Unable to access patch config job | |
| Patch Management | Fix excessive number of patch scan details notifications | |
| Patch Management | Scheduled script job triggers are not scheduling during startup | |
| Patch Management | Script search is not working | |
| Patch Management | Unable to un-manage the devices | |
| Process Automation | Client Admin cannot see process definitions | |
| Process Automation | Issue while trying to view the latest entries under Running process instances or Recently completed | |
| Process Automation | Fixed filters under Start Event Type/Start Event Operation where previously selected checkboxes are not visible | |
| Reports | Audit logs do not show deleted device information | |
| Resource Management | SentinelOne agent not showing in OpsRamp under Installed Software section | |
| Resource Management | Search 2.0 is not working for the new clients | |
| Resource Management | In Attributes>Hardwares>Logical Disks, getting 400 error when clicking monitor button | |
| Security | Fixed Integration > Settings (import) vulnerability | |
| Security | Fixed Monitoring > Events (import) vulnerability | |
| Security | Fixed Monitoring > Events (add) vulnerability | |
| Security | Fixed Monitoring > Metrics (import) vulnerability | |
| Security | Fixed Monitoring > Metrics vulnerability | |
| Security | Fixed Knowledge Base > Upload comments attachment vulnerability | |
| Security | Insecure CORS | |
| Security | VA-Improper access control-Reports-View-details | |
| Service Management | Fixed slow incident API response | |
| Service Management | Fixed UI scrolling issue when trying to attach alerts to incidents | |
| Templates | Unable to edit monitoring template globally: Prod > System Health > Host Resource MIB | |
| Templates | Fixed No SNMP credential set mapped to device template error | |
| UI | UI flickers while running discovery for network devices | |
| UI | Fix cause of synthetics 404 error | |
| UI | Gateway device creation not working | |
| UI | Clicking filters under monitors results in a blank page | |
| UI | Column alignment issue with loading in device group | |
| UI | Alignment issue in Management Profile details page | |
| UI | Fixed edit script input window width | |
| UI | V2 Infra search query appends with $resourceType as other | |
| UI | Fix console dropdown icon alignment in Firefox | |
| UI | In infrastructure maintenance list, add record count and pagination | |
| UI | When opening any incident from the Alert Escalation policy, partner and client dropdowns are missing in the opened Service Desk tab | |
| UI | Fix error loading tile attachment error when importing curated dashboards locally | |
| UI | Fixed inconsistent UI font size | |
| UI | Dropdown chevron missing in navbar on topology screen | |
| UI | Make table page selection UI consistent in dark mode | |
| UI | Add a dropdown component to the Alibaba flow | |
| UI | Fixed UI alignment for Google cloud list display | |
| UI | In Client edit page, enable/disable of Application Discovery and Dependency Mapping is not taking effect immediately | |
| UI | Correct the agent installation instructions for various Linux platforms | |
| Documentation Changes | — | Client ID with UUID format updated added to release notes |
| — | Fixed MSSQL configuration parameter name:description discrepancy | |
| — | Added data collection section to AWS/GCP/Azure/Alibaba documentation | |
| — | Documented SNMP v3 trap processing on the gateway | |
| — | Added SSH login restrictions in gateway and Syslog settings to the classic gateway documentation | |
| — | Patching not supported on a Linux gateway documented | |
| — | Updated platform overview page | |
| — | Alibaba cloud and resources documented | |
| — | automonitoring={automonitoring flag} argument for automonitoring in .msi installtion documented | |
| — | Connecting gateways using daisy chaining documented | |
| — | Document prediction tab in alert detail view | |
| — | Regex-based alert enrichment policy documented | |
| — | Document alert predictions page | |
| — | New UI for custom branding documented | |
| — | Document alert updated time behavior and UI change | |
| Agent | Agent self-heal alerts for applicable monitors documented | |
| Agent | Shell- and Python-based deployment steps documented | |
| Alert Management | Alert Predictions feature documented | |
| Cloud-Native Monitoring | Fixed enhanced Kubernetes cronjob/hob metric support typo | |
| Compute Monitoring | Added additional details to the Cisco Hyperflex integration documentation | |
| Integration Framework | Legacy webhook URIs for alerts and incidents EOL deprecation documented | |
| Integration Framework | Legacy webhook URIs for alerts/incidents removed from integration docs | |
| Recommended Templates | Linux OS performance remote monitoring for gateway (V2) template added to the Recommended Templates document | |
| Recommended Templates | For SNMP, added monitoring template documentation for Cohesity | |
| Recommended Templates | Added VMware-tunnel-server-MIB templates to the recommended templates and support matrix documents | |
| Recommended Templates | MSSQL monitoring templates documented | |
| Recommended Templates | Remove gateway recommended templates, which are no longer supported | |
| Remote Consoles | Java consoles deprecation notices updated | |
| Synthetics | Documented custom error messages in synthetic transactions | |
| Synthetics | HTTP-SCRIPT transaction monitor success and error screenshot documented | |
| Synthetics | Synthetics configuration parameter details documented | |
| core platform | Added alert definition feature to release note |
August 2021
We are excited to announce our Summer 2021 (v10) update!
Discovery and Monitoring
Windows Agent Automonitoring | Host Performance and Application Monitoring
Monitoring Management
Clients with auto-monitoring enabled clients can use the windows agent to automatically monitor Windows-related performance metrics and applications, including Active Directory, MSSQL, and Exchange. This simplifies and accelerates time-to-value for monitoring Windows-based resources.
Limitations:
- Limited to only clients with auto-monitoring enabled
- Application support is limited to Active Directory, MSSQL, and Exchange
Alibaba Cloud Discovery and Monitoring
Cloud Monitoring
Alibaba Cloud discovery and monitoring are now supported. Cloud operators can easily onboard Alibaba Cloud resources and get visibility into key services and resources.
Limitation: Discovery and monitoring are limited to ECS Instances, Autoscaling, RDS, LoadBalancer, EMR, and VPC services.
OpenShift 4 Discovery and Monitoring
Cloud-Native Monitoring
Red Hat OpenShift 4 is now supported. Kubernetes administrators can discover and monitor the OpenShift 4 Kubernetes environment for alerting, visualization, and troubleshooting. After an Openshift 4 environment is onboarded, administrators can leverage Dashboard 2.0, alert correlation policies, service maps, and more to manage their OpenShift 4 environment.
Prometheus Metrics Integration | VM Deployment
Cloud-Native Monitoring
Metric ingestion for Prometheus running on bare metal or virtualized infrastructure is now supported. Prometheus metric data is scraped and store. This functionality enables DevOps teams to centralize metric storage across their Prometheus stack and generate dashboards to showcase application health and performance.
Limitations:
- Limited to only clients with auto-monitoring enabled.
- Alerting on Prometheus metrics is not currently supported.
- Compatible with Dashboard 2.0 only.
- A maximum of 30 metric tags is stored.
Automonitoring | Enhanced Linux Process Monitoring
Cloud-Native Monitoring
For clients with auto-monitoring enabled, the Linux agent now automatically collects key application processes running on the host. Linux administrators can filter, alert, and visualize the running processes to increase insight into the application health and performance indicated by the running processes on a host. Linux administrators can also create regex statements within the agent to include or exclude specified processes.
Limitations:
- Limited to only clients with auto-monitoring enabled.
- A maximum of 30 processes can be visualized.
Availability for Automonitoring | Alert Definition Support
Availability, Monitoring Management
For clients with auto-monitoring enabled, Alert Definitions now support the ability to set resource availability based on a critical alert state. Administrators can more easily get a high-level understanding of monitored infrastructure availability and generate reports to share infrastructure availability with key stakeholders.
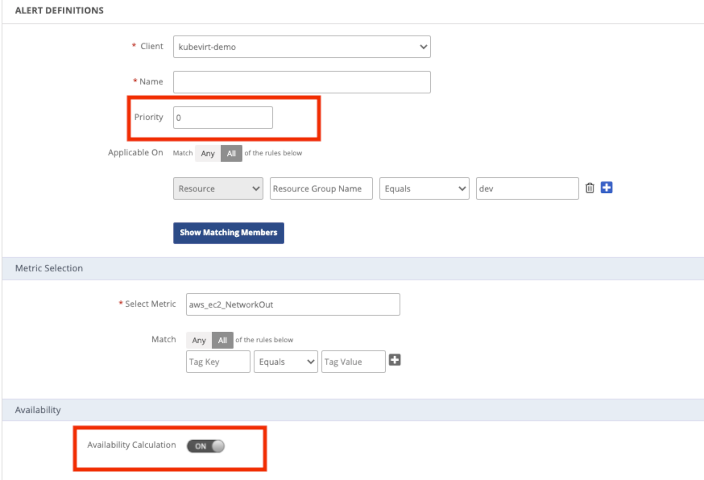
Limitations:
- Limited to only clients with auto-monitoring enabled.
- Alert definitions must be manually edited to include this option.
Dashboard 2.0 | Enhancements
Dashboard
Dashboard 2.0 now has an updated color palette, updated curated dashboards, and improved performance.
Metric Notation Changes for Gateway Resources
Monitoring Management
As a continuation of the new canonical metric formatting, metrics for gateway resources are reformatted using underscore notation. Metric tags are added to enable advanced filtering in Dashboard 2.0 and Alert Definitions. Administrators looking for advanced metric data filtering to create meaningful visualization and aggregations can leverage these tags to aggregate metrics across their hosts, individual processes, and more. For more information, see the Platform > Dashboards > Dashboard 2.0 documentation.
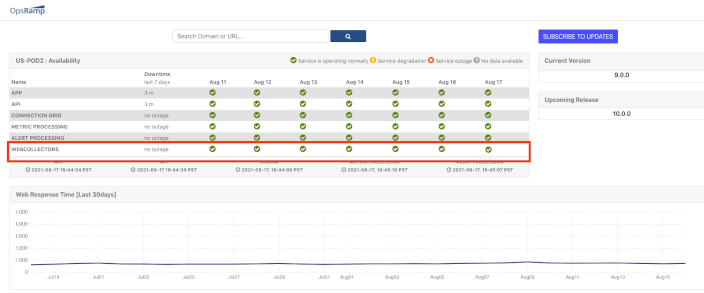
Show Public Synthetic Collector Health in health.opsramp.com
Synthetics
The health and status of the public synthetic collectors can now be viewed in the health.opsramp.com portal. Where a public synthetic monitor is no longer reachable by public collectors, administrators can track the status of the collectors until they are resolved by the OpsRamp engineering team. Administrators can subscribe to the health portal to get updates on any changes or service outages relating to the synthetic collectors within their POD.
Hybrid Cloud Onboarding Wizard | Edit Integrations
User Interface
For clients with auto-monitoring enabled, administrators can now edit cloud-based integrations in the onboarding wizard. This permits easier cloud integrations post-creation management and ensures that integrations are correctly configured.
Limitation: Limited to only clients with auto-monitoring enabled.
Edit and Search for Client / Resource Notes with a Future Date
User Interface
You can search and edit Client and Resource notes set for a future date for easier management and configuration. This ensures that administrators have sufficient visibility into notes with a future date.
Standardize Synthetic Public Locations
Web Services Monitoring
Synthetic locations are standardized across all OpsRamp PODs. This provides a more consistent experience across the PODs when configuring and selecting public locations for synthetic monitors.
Event and Incident Management
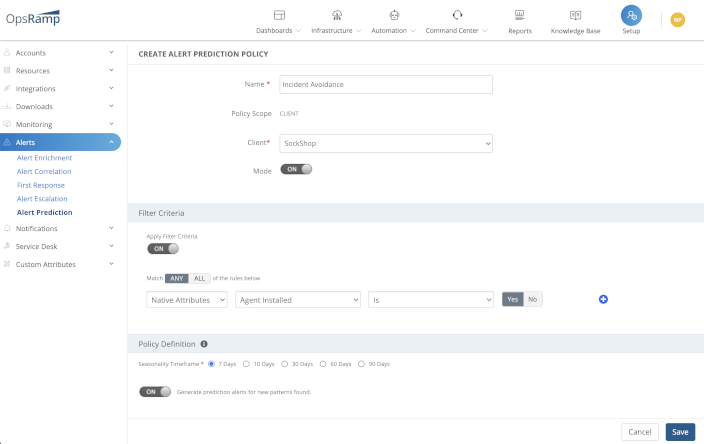
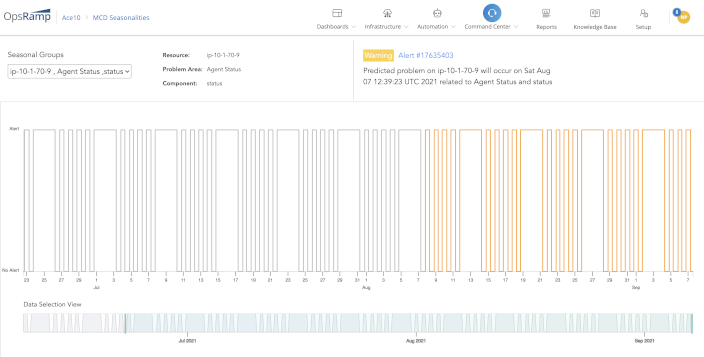
Predicted Alerts
Alert Management
OpsRamp introduces a new machine learning alert management policy, user interface, and alert type that provides the ability to predict and prevent alerts from becoming incidents and therefore avoiding costly outages and impacting the customer experience.
Alert Prediction Policy
Administrators can easily add and configure alert prediction policies in the same way as other ones. Specific options provided are to select the required seasonality timeframe ranging from 7 to 90 days worth of alert data that is analyzed and also the ability to generate predicted alerts that can then be managed using your existing alert management workflows.
Alert Prediction UI
Users and operators can visualize predicted alerts identified by accessing the “Alert Prediction” page under “Command Center” where they can select seasonality groups and required timeframe.
Alert Prediction API
Similar to other types of alert policies, API users can now use the /api/v2/tenants/{tenantId}/policies/alertprediction endpoint to create an alert prediction policy, generating predicted alerts with the required seasonality time-frame.
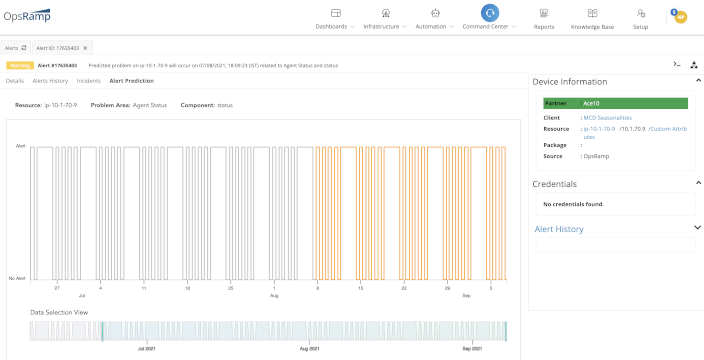
Alert Prediction Tab in Alert Detail View
Users and operators can view the rendered prediction chart by selecting a new “Alert Prediction” tab in the alert detail view. Note: This view is only available when the alert is of the type “Prediction”.
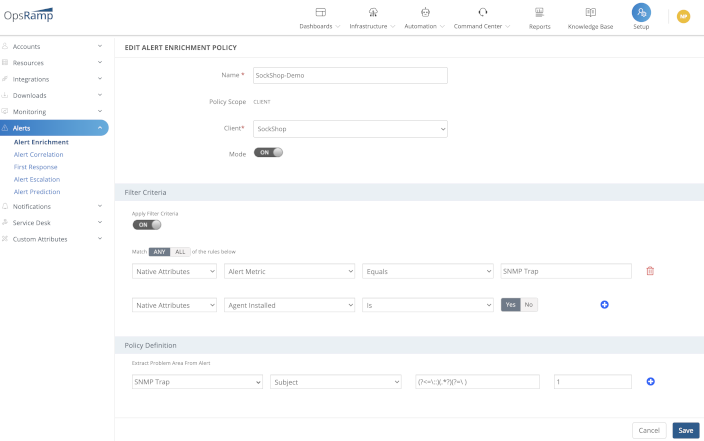
Alert Enrichment
Alert Management
OpsRamp introduces a new alert management policy that provides a convenient way to enrich alerts using regular expressions to identify the problem area from the alert subject or description fields. The default “Problem Area” field is the metric name and by enriching it helps users and operators with troubleshooting.
Various Alert Management Enhancements
Alert Management
The following alert management enhancements are now available in this release:
- The alert detail page “Create Incident” button label is changed to “Take Action”.
- The “Take Action” button in the alert detail page now includes the ability to run a process automation workflow.
Remediation and Automation
Auto Approval of Patches Extended to All Type of Patches
Patch Management
Process automation workflows can now be used to auto-approve all patch categories, including definition updates, feature packs, service packs, updates, and update rollups.
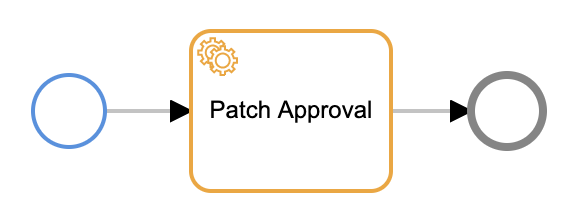
Process Automation | Patch Management
Process Automation
Patching tasks are added to the process automation workflow. These tasks include patch scan, patch installation, and patch approval.
Process Automation | Enhancements
Process Automation
The following process automation enhancements are now available in this release:
- A new platform service task is available to find alerts that can then be used for various housekeeping tasks
- Process definitions can be triggered when an incident is created or updated as the signal start type. This allows users to create end-to-end incident response workflows
- Enhanced process definition and process instance filtering capabilities
Platform
Agent deployment using SHELL and other improvements
Agent
An agent deployment shell script is provided to help deploy the agent on Linux and FreeBSD servers. You can download the shell-base Agent deployment script at Setup > Downloads > Agent. Also, you can choose to download the shell script and Agent MSI using the API.
Constraints: The existing Python-based script needs Python as a prerequisite for agent deployment whereas the shell script runs without Python.
Clean Windows Agent uninstallation
Agent
After uninstallation, the agent usually left traces in the Windows registry. With this release, the agent cleans up the associated registry entries after uninstallation.
Agent log file backup count increased
Agent
Agent logs are rolled out when they reach 2MB in size and are saved in compressed format. The number of log backup files is increased from three to five. This is expected to help with troubleshooting.
SNMP v3 Trap processing with user-specified credentials
Classic Gateway
The gateway now processes SNMP v3 Traps with user-specified credentials. Previously, the gateway only processed traps from end devices with predefined credentials provided by OpsRamp.
You can now define your own SNMP v3 credentials on the gateway to process v3 Traps.
ClamAV antivirus definition updates using proxy
Classic Gateway
The gateway ClamAV antivirus utility periodically checks for antivirus definition updates. When the gateway communicates using an external proxy, the request from the gateway to the ClamAV database uses a customer-configured external proxy. Previously, ClamAV made a direct connection for definition updates.
API to enable/disable SIP and Synthetics
Classic Gateway, UI
The gateway management profile has a provision to enable SIP and Synthetics services on the gateway. With this release, you have the option to enable or disable the services using the API.
Restrict unsupported Gateway updates
Classic Gateway, UI
As part of the N-2 support policy, gateway versions N-1 and N-2 can be updated to the latest version (N) from the Setup > Management profile. Any gateway below version N-2 is not supported for the update.
Gateway Syslog forwarding configuration APIs
Classic Gateway
The gateway Web User interface has an option to configure an external Syslog server as a receiver. This functionality permits the gateway to push gateway-generated Syslog messages to the external receiver.
With this release, you have the option to configure this feature using the API.
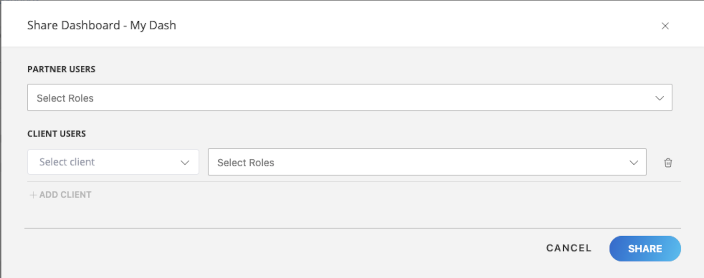
Dashboard 2.0 | Client-level Sharing
Dashboard
Partner and Client users can now share dashboards with other client users based on role. This facilitates dashboard templatization and replication.
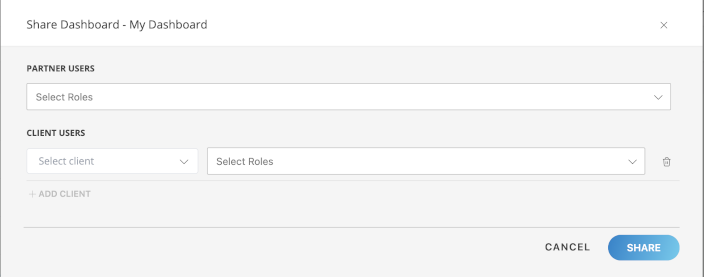
Limitation: Can only share with client users
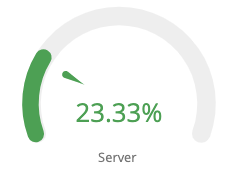
Dashboard 2.0 | Metric Tile Gauge Visualization
Dashboard
The metric tile in Dashboard 2.0 now supports a gauge visualization. Gauge charts provide a convenient way to visualize metric values that can arbitrarily increase or decrease within a fixed range.
Browser-based Remote Console | General Enhancements
Remote Consoles
Browser consoles are now optimized for better performance.
Suspension of Inactive Reports
Reports
Reports that have not been downloaded for an extended interval are now placed in the suspended state. Reporting schedules can be resumed at any time. This helps improve the performance of reporting schedules that are currently in use.
Dashboards 2.0 | Dark Mode
Dashboard
Dashboard 2.0 and the Infrastructure > Search page now support dark mode. Dark mode can be enabled in Profile Details. This provides administrators who are accustomed to a Dark UI/UX a darkened UI/UX with a stark contrast using darkened tones and palettes.
Limitation: Dashboard 2.0 and Infrastructure > Search are the only pages that currently support Dark Mode.
Browser Consoles
Logging and downloading standard console outputs
Remote Consoles
An option is now available to capture and download the standard output from browser-based SSH and Telnet consoles for better incident analysis and faster problem resolution.
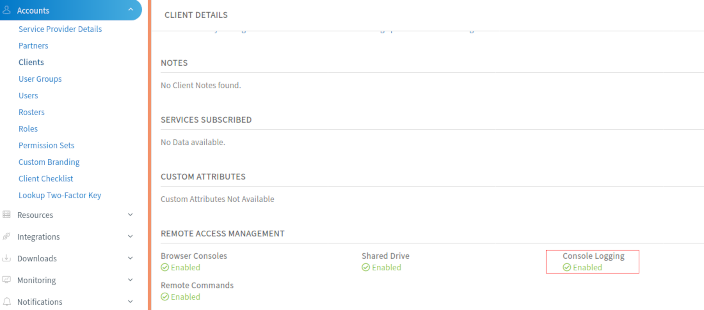
Limitations:
- Console Logging at the client level must be enabled.
- Awareness of scriptreplay utility.
APIs
Product API updates
APIs
New Alert prediction APIs and Resource query endpoints are updated to get resource dnsName attributes.
A new client ID UUID format is now effective when using the API. Client IDs for new clients have a 36-character format. For example: 486k5032-g13a-47b8-a068-bc37e0e7ffee. Refer to the /api/v2/tenants/{orgId}/clients create client endpoint example response. Existing clients are unaffected and continue to use the legacy format: client_xxxx.
Process Automation
APIs
You can now automate workflows using process automation APIs. See the API > Automation endpoints documentation.
Updated Gateway API’s
APIs
Gateway APIs are optimized with fewer endpoints for querying classic Gateway configurations. See the API > Resource Management endpoint: /api/v2/tenants/{tenantId}/resources/{resourceId}/remoteConsoles documentation.
Browser console APIs
APIs
The Browser Console API enables users to configure, identify configured consoles, and query managed resource audit recording data. See the API > Resource Management endpoint: /api/v2/tenants/{tenantId}/resources/{resourceId}/remoteConsoles documentation.
Week of July 13, 2021
| Update Type | Issue No. | Zendesk ID | Category | Change Description |
|---|---|---|---|---|
| Enhancements | CON-1213 | 52747 | SNMP | Support monitoring for Dell iDRAC devices through SNMP templates |
| CON-1350 | VMware | VMware integration is certified and supports monitoring vCenter 7.x versions | ||
| CON-1374 | 51599 53946 | Network Backups | Configuration backup support for VOSS switches | |
| CON-1729 | Custom Monitors | NFS mount point monitoring on Linux and Windows | ||
| CON-2138 | SNMP | SNMP definitions for Cisco Catalyst 9300 | ||
| CON-2163 | SNMP | Add SNMP device type definition for sysObjId:1.3.6.1.4.1.9.1.2367 | ||
| CON-2186 | SNMP | Add Varbindings to Existing OIDs and support new OID | ||
| CON-2187 | SNMP | EMC Data Domain: SNMP trap support | ||
| CON-2293 | Compute Monitoring | Generate alert notifications for NSXT | ||
| ITOM-35254 | Security | Web application scanning 2020 | ||
| ITOM-40280 | Remote Consoles | Console logging in browser consoles | ||
| ITOM-47699 | 53226 | Resource Management | Some resource attributes unavailable through the API | |
| ITOM-52632 | Resource Management | New resource types for NSX-V and NSX-T | ||
| ITOM-52636 | Cloud-Native Monitoring | Metric stream custom container application monitoring | ||
| ITOM-52951 | Remote Consoles | Web consoles not working when TLS 1.0 and TLS 1.1 are disabled | ||
| ITOM-53316 | Remote Consoles | Apache Guacamole upgrade to 1.3.0 | ||
| ITOM-53774 | Remote Consoles | Loggers to print connection ID in Catalina logs | ||
| ITOM-53824 | Classic Gateway | Gateway version 9.0.1 patch to address network configuration and other issues | ||
| ITOM-53845 | UI | Add vSAN disks UI support for host and cluster | ||
| ITOM-53926 | UI | Support the service maps search query with ID and name in query string | ||
| PI-20291 | 54941 | Resource Management | VMWare integration hardware update not in sync | |
| Issues Fixed | ITOM-26486 | Resource Management | Device discovery issues in prodmon | |
| ITOM-52084 | UI | Device availability changes for Elasticsearch | ||
| ITOM-52238 | Alert Management | While suppressing an alert from advanced search, incorrect success message is displayed | ||
| ITOM-52738 | UI | Blank screen when pagination is changed from 10-50 in advanced search | ||
| ITOM-52754 | UI | Pagination is not working for widgets | ||
| ITOM-53163 | Synthetics | Select All checkbox is not working in monitor configuration parameters | ||
| ITOM-53564 | Resource Management | Unassigned cloud provider accounts in Resource Tree menu | ||
| ITOM-53713 | Alert Management | Resource group does not work in alert ML correlation | ||
| ITOM-54027 | Service Management | Displays "we are sorry" error page for service desk ticket creation | ||
| ITOM-54210 | Service Management | Service desk create/update all ticketType APIs have invalid Json payload and response structure | ||
| ITOM-54277 | UI | While enabling the console logging option in client, that client is not showing in some places | ||
| ITOM-54292 | UI | Listing page error when disk name length exceeds 50 character | ||
| PI-20294 | 55045 | Reports | Monitor Details Report: OpsRamp Template Assignment Report not running to completion | |
| PI-20795 | 55977 | Cloud Monitoring | AWS integration discovery not completing and resources are missing | |
| PI-20953 | Monitoring Management | Jobs are not completed and are long running as observed in activity tab | ||
| PI-21013 | 56375 56620 | Process Automation | Process automation fails | |
| PI-21164 | 56916 57452 | Network Automation | Unable to export Custom Script data | |
| PI-21180 | 56940 | Monitoring Management | Audio video device monitoring memory leak | |
| PI-21207 | Resource Management | RAM details are in GB units but values are in MB units | ||
| PI-21224 | Classic Gateway | Not showing correct number of volumes and Luns on NetApp integration discovery | ||
| PI-21236 | 57065 | Synthetics | Webservice monitoring: *Down location count* metrics and alerts not triggered after 14 June 2021 | |
| PI-21242 | 57086 | Cloud Monitoring | ECS service containers not discovered through resource filter | |
| PI-21274 | 57144 | Alert Management | Maintenance added to all resources instead of a single device as intended | |
| PI-21284 | 55217 | Patch Management | Patch summary email is not sent | |
| PI-21304 | 57031 | Dashboard | Unable to save dashboard widgets | |
| PI-21307 | 56983 | SNMP | Same OID can be added multiple times | |
| PI-21310 | 57207 | Alert Management | Description format not preserved when alert escalated to email | |
| PI-21313 | 57245 | Integration Framework | Configuration export/import is not working for the E2-VSP Hitachi VSP integration | |
| PI-21336 | 57189 | Alert Management | Triggered alerts notify at random after the initial notification | |
| PI-21375 | 56409 | UI | Metric graph data is not displaying in the alert browser | |
| PI-21388 | Cloud Monitoring | Discover VPN Service in AWS | ||
| PI-21403 | Classic Gateway | SNMP V3 device discovery failing | ||
| PI-21410 | Tenancy and RBAC | Duplicate roles with same name | ||
| PI-21426 | Tenancy and RBAC | Role assignments not immediately effective | ||
| PI-21451 | Alert Management | Scheduled maintenance does not work in specific conditions | ||
| PI-21453 | Clustered Gateway | Network device alerts incorrectly mapped | ||
| PI-21468 | UI | Process automation link sometimes missing | ||
| API Endpoint Changes | PI-21156 | 56885 | OpenAPI Specification | Missing payload attributes : OAS |
| ITOM-51572 | OpenAPI Specification | OpenAPI specs : Updates in Service Desk Create/Update all ticketType payload examples | ||
| ITOM-51760 | OpenAPI Specification | First response policy creation extended to partner level | ||
| ITOM-51766 | Alert Management | Update Alert correlation APIs | ||
| ITOM-53297 | OpenAPI Specification | OpsRamp authorization endpoint documentation | ||
| ITOM-53456 | 56989 | OpenAPI Specification | OpenAPI Specs update : phoneNumberExt as the correct schema attribute | |
| ITOM-53929 | OpenAPI Specification | Search Resource APIs : dnsName attribute in the resources | ||
| ITOM-53955 | OpenAPI Specification | SDK 1.0 installed 1.0 API specifications | ||
| Documentation Changes | DOC-2808 | — | Add network topology best practice | |
| DOC-2820 | — | Document suspended reports |
Week of June 29, 2021
| Update Type | Issue No. | Zendesk ID | Category | Change Description |
|---|---|---|---|---|
| Enhancements | ||||
| CON-1729 | Custom Monitors | NFS mount point monitoring on Linux and Windows | ||
| CON-2070 | Storage Templates | Discovery and Monitoring for Cisco ACI | ||
| CON-2085 | Integrations | Extend support with default values in the template | ||
| ITOM-35254 | Security | Web application scanning 2020 | ||
| ITOM-49600 | Security | WAPT-February-21_NE | ||
| ITOM-53774 | Remote Consoles | Loggers to print connection ID in catalina logs | ||
| ITOM-53921 | Integration Framework | For adapter installed integration, show the management profile UUID and Name on the installed integration page and the beta tag in available integration | ||
| PI-21164 | 56916 | Network Automation | Unable to export the custom script data in OpsRamp | |
| PI-21242 | 57086 | Cloud Monitoring | ECS Service containers not discovered using resource filter | |
| Issues Fixed | ITOM-52238 | Alert Management | While suppressing an alert from Advanced Search, the incorrect success message is displayed | |
| ITOM-52281 | Device Management Policies | Device Management Policies are not applied | ||
| ITOM-52778 | Evaluation | Firefox login error | ||
| ITOM-53713 | Alert Management | Resource group similarity does not work in alert ML correlation | ||
| ITOM-53782 | Evaluation | Bcc email address not notified when the client is deactivated | ||
| ITOM-53831 | UI | Selecting roles under dashboard sharing results in persistent Loading dialog | ||
| ITOM-53930 | OpenAPI Specification | OpenAPI Specs update: KB APIs, duplicate specs for share KB article | ||
| PI-20294 | 55045 | Reports | Monitor Details Report: Template Assignment Report not running to completion | |
| PI-20567 | 55589 | Cloud Monitoring | Unknown and Undefined resources found | |
| PI-20604 | 55753 | Integration Framework | Integration issue with ServiceNow | |
| PI-20795 | 55977 | Cloud Monitoring | AWS integration discovery is not completing and resources are missing | |
| PI-21013 | 56375 56620 | Process Automation | Process automation fails | |
| PI-21268 | 51371 | UI | Discovery cannot see storage pools, disks, volumes, DP pools, and array groups | |
| PI-21274 | 57144 | Alert Management | One-time maintenance issue | |
| PI-21307 | 56983 | SNMP | The same OID can be added multiple times | |
| PI-21313 | 57245 | Integration Framework | Configuration export/import is not working for the Hitachi VSP integration | |
| PI-21336 | 57189 | Alert Management | Triggered alerts notify at random after the initial notification | |
| API Endpoint Changes | ITOM-53929 | OpenAPI Specification | OpenAPI Specs update: search resource APIs |
Week of June 22, 2021
| Update Type | Issue No. | Zendesk ID | Category | Change Description |
|---|---|---|---|---|
| Enhancements | CON-1502 | SNMP | Korenix Switches Monitoring support | |
| CON-2120 | SNMP | Show same type (OID) of traps as alert after receipt by gateway within 30 minutes | ||
| ITOM-41268 | Integration Framework | Integrate with Atrium Orchestrator for Automation | ||
| ITOM-44361 | UI | Add ability to save a view | ||
| ITOM-53253 | UI | Support safari dashboard | ||
| PI-20969 | UI | Management Profiles selections disabled and firmware upgrade showing blank | ||
| PI-21220 | 57011 57030 | Patch Management | Servers not patched and scheduled as expected | |
| PI-21242 | 57086 | Cloud Monitoring | ECS Service containers not discovered through resource filter | |
| PI-21260 | 57090 | Agent | Third Party Server Patch Report | |
| Issues Fixed | ITOM-52054 | Service Management | SLA Email notifications sent to users even with SLA managament module deselected for the partner | |
| ITOM-52955 | Core Platform | Some ACL Roles not being deleted | ||
| ITOM-53266 | Monitoring Management | Template creation page loads indefinitely after selecting **Scope** from the drop-down menu | ||
| ITOM-53514 | Monitoring Management | VMware vSan Attributes are not in the monitoring request | ||
| ITOM-53631 | UI | RAM info is incorrect on the Infrastructure > Device Attribute page | ||
| ITOM-53727 | Cloud Monitoring | A Blank Column is added for Azure Resource Groups | ||
| ITOM-53728 | Cloud Monitoring | Custom Attributes added for non-monitoring cloud resources are not discovered | ||
| ITOM-53737 | OpenAPI Specification | Password change using Update user API is successful but unable to log in to the UI | ||
| PI-20310 | 55081 | Classic Gateway | SRM appliance monitoring | |
| PI-20567 | 55589 | Cloud Monitoring | Unknown and undefined Resources in OpsRamp Tool | |
| PI-21010 | 56631 | Integration Framework | API for Email Integrations: specifying default value in parsing rules does not work | |
| PI-21048 | 56712 | UI | 504 Error while exporting users | |
| PI-21095 | Tenancy and RBAC | Cloud accounts not assigned to a user are visible | ||
| PI-21118 | 56721 56827 | Alert Management | Alerts are not cleared after the outage | |
| PI-21141 | Integration Framework | User with the view integration permission set is able to edit the integration | ||
| PI-21195 | 56972 | Dashboard | Azure curated dashboard throws an error and does not populate | |
| PI-21205 | 56973 | Patch Management | Patch installation job is not triggered | |
| PI-21206 | Resource Management | Vmware discovery: virtual machines are not ported to ESXi but are shown in the servers category | ||
| PI-21223 | 57026 | Tenancy and RBAC | Users with View Devices permission can move devices from one site to another | |
| PI-21224 | Classic Gateway | Not showing correct number of volumes and Luns on NetApp integration discovery | ||
| PI-21226 | 56923 | Patch Management | Patch job not triggered for servers | |
| PI-21232 | 57055 | UI | Metric graphs from custom monitor show as Undefined | |
| PI-21287 | 57195 | Alert Management | Open alerts are not moved from QA-NOC to Allcovered NOC | |
| Documentation Changes | DOC-2644 | Cloud Monitoring | Document admission control for agent I-installed resources in public clouds | |
| DOC-2785 | Recommended Templates | Document Dell EMC Isilon PowerScale templates | ||
| DOC-2787 | Recommended Templates | Update Korenix JetNet templates to recommended template |
Week of June 15, 2021
| Update Type | Issue No. | Category | Change Description |
|---|---|---|---|
| Enhancements | CON-1502 | SNMP | Korenix Switches Monitoring support |
| CON-1561 | SNMP | Memory calculation formula | |
| CON-1606 | App Templates | Polycom Trio 8800 device - Discovery Implementation | |
| CON-1733 | App Templates | Develop MSSQL monitoring metrics | |
| CON-1890 | App Templates | FCEE MSSQL Monitoring metrics | |
| CON-1977 | Compute Monitoring | Identify and Update API calls in required format | |
| CON-2004 | App Templates | Delete resource implementation for BNA App | |
| CON-2026 | Compute Monitoring | Velocloud-Discovery Implementation | |
| CON-2065 | Compute Monitoring | vSAN Response Changes for Capacity and Performance Metrics | |
| ITOM-45667 | Clustered Gateway | Gateway Cluster - Beta: Deployment | |
| ITOM-49179 | UI | Update new_ui proxy config | |
| ITOM-51458 | Alert Management | Expose ML model turning parameters to the ML correlation policy | |
| ITOM-51557 | Alert Management | Ability to heal non-metric based alerts | |
| ITOM-52154 | UI | Update profile popover in nav-bar to match new design | |
| ITOM-53098 | Cloud-Native Monitoring | Add support for ContainerID in agent custom monitoring | |
| ITOM-53253 | UI | Support safari dashboard | |
| ITOM-53272 | Monitoring Management | Monitoring Changes for vSAN at Cloud End | |
| ITOM-53356 | Clustered Gateway | Integrations to support new Gateway HA model along with version | |
| ITOM-53385 | Monitoring Management | Add New Configuration Parameter for VMware vSAN | |
| PI-19867 | Custom Monitors | Auto self-heal alert for services | |
| PI-20778 | IMLINK | Change the auto decline time | |
| PI-20916 | Clustered Gateway | HCI Metric Improvements | |
| Issues Fixed | ITOM-35450 | Service Management | Search by Request ID drop-down menu is showing blank in user login |
| ITOM-37665 | Monitoring Management | createMonTemplates API returning an HTTP status code 200 (OK) even if the POST operation was unsuccessful | |
| ITOM-47699 | Resource Management | Some resource attributes are not available through the API | |
| ITOM-49514 | UI | Provide a validation message in Forget Password screen when the 'User name' field is empty/wrong | |
| ITOM-52103 | Alert Management | Send message to agent device on manual delete of scheduled maintenance from Pending State | |
| ITOM-52535 | Remote Consoles | Console security issues: kill session option for users in browser consoles | |
| ITOM-52737 | Dashboard | Text/Image Tile Fails to Save after Copy and Pasting | |
| ITOM-53206 | Resource Management | In Infra Resources Tab, after resource open, left-side panel is not displayed | |
| ITOM-53225 | Core Platform | Change log level to debug for delete metrics | |
| ITOM-53236 | UI | Alert page graph widget UI is not loading properly | |
| ITOM-53389 | Exports | Alert updated time not getting in Stream Export Alert Payload | |
| PI-20378 | Remote Consoles | Browser console issue | |
| PI-20419 | Cloud Monitoring | Scan stuck in Executing status | |
| PI-20542 | Alert Management | Alerts got generated under scheduled maintenance | |
| PI-20603 | Security | Deprecate TLS protocols | |
| PI-20731 | Agent | Install error Latest deployAgent.py script on RHEL 8 and CentOS Stream 8 systems | |
| PI-20736 | Service Management | SLA breach reminder issue | |
| PI-20756 | IMLINK | Unable to view tickets in Accepted bucket | |
| PI-20833 | Patch Management | Patches installed out of the scheduled window | |
| PI-20917 | Synthetics | Over 160 synthetics using private collectors stopped populating data | |
| PI-20970 | Alert Management | Schedule maintenance window fault | |
| PI-20988 | Reports | Standard daily "Schedule Maintenance Report" is not completing within 24 hours | |
| PI-21011 | API Framework | Device Management Policy API: Ability to accept special characters for custom attributes | |
| PI-21014 | Service Management | Jp character garbled in incident page | |
| PI-21026 | Reports | Fix offset values not displayed in the Patch Report | |
| PI-21030 | Cloud Monitoring | Device list not populating | |
| PI-21037 | Monitoring Management | Data loss observed for multiple resources belonging to different clients | |
| PI-21052 | Alert Management | Forecast metric issue | |
| PI-21098 | Cloud Monitoring | Problem with Command | |
| PI-21127 | Integration Framework | RHEL SSO Integration | |
| PI-21135 | Resource Management | Resource update API for "extResourceId" | |
| PI-21206 | Resource Management | Vmware discovery: virtual machines not ported to ESXi but are shown in servers category | |
| PI-21224 | Classic Gateway | Not showing correct no of volumes and Luns on NetApp integration discovery | |
| API Endpoint Changes | ITOM-51769 | OpenAPI Specification | Change in Create metric type API response output and response status code |
| ITOM-53319 | OpenAPI Specification | API for bulk approval / disapproval of patches documentation | |
| Documentation Changes | DOC-2785 | Recommended Templates | Document Dell EMC Isilon PowerScale templates |
Week of June 8, 2021
| Update Type | Issue No. | Category | Change Description |
|---|---|---|---|
| Enhancements | ITOM-42939 | Classic Gateway | Display SNMP firmware, hardware, and software revisions in UI. |
| ITOM-48962 | Integration Framework | Extend the sending events to slow process queue mechanism for read/connection time-outs. | |
| ITOM-51203 | Core Platform | Add Msp-level migration functionality for RSA migration. | |
| ITOM-52157 | Remote Consoles | Map browser consoles resolutions with errors. | |
| ITOM-52490 | Patch Management | Improve patch jobs scheduling. | |
| ITOM-53098 | Cloud-Native Monitoring | Add support for ContainerID in agent custom monitoring. | |
| PI-20855 | Patch Management | Fix patch jobs not triggered | |
| PI-20922 | Patch Management | Handle prefix or suffix space char in patch configuration name. | |
| Issues Fixed | ITOM-47407 | Integration Framework | For SSO users, do not set password flag on initial login. |
| ITOM-49955 | Dashboard | Fix device metric data display issue. | |
| ITOM-50532 | Agent | UI instructions changes, dynamic changes in deployagent.sh for API server, key, secret, and proxy details. | |
| ITOM-52267 | API Framework | Fix API endpoint to get the list of service maps returning wrong information. | |
| ITOM-52566 | Resource Management | Fix defaultRole attribute on role creation. | |
| ITOM-52692 | API Framework | Csgrid node detection with the context in active-active environment for gateways. | |
| ITOM-52860 | Cloud Monitoring | Fix resource properties collection issue for generic resources. | |
| ITOM-52863 | UI | Fix 24hrs time format update in My Profile edit page. | |
| PI-19499 | Integrations | Fix missing integration alerts. | |
| PI-20169 | Process Automation | Process definitions improvements. | |
| PI-20222 | API Framework | Fix an issue regarding failing API requests for the agent download API. | |
| PI-20258 | Alert Management | Fix Email delivery of notifications triggered from OpsRamp to customer inbox. | |
| PI-20510 | Monitoring Management | Fix SNMP discovery. | |
| PI-20555 | Templates | Ensure template in sync. | |
| PI-20615 | Reports | Fix an issue causing blank custom metric reports. | |
| PI-20652 | API Framework | Fix API scheduled maintenance search returning same results for different pages. | |
| PI-20806 | Dashboard | Fix graphing of gateway collected metric and agent collected metrics from the alert browser. | |
| PI-20872 | Integrations | Fix a VMware discovery issue. | |
| PI-20925 | Core Platform | Fix an issue causing the Assign Credentials popup window to be empty. | |
| PI-20999 | Resource Management | Fix an issue regarding lost filters in infrastructure groups. | |
| API Endpoint Changes | ITOM-51749 | API Framework | Update alert actions to suppress alert with snoozeTime. |
| ITOM-52531 | Remote Consoles | Remote console managment APIs. | |
| ITOM-52532 | Remote Consoles | Remote audit recording. | |
| ITOM-52533 | Remote Consoles | Remote console managment APIs. | |
| ITOM-52635 | Agent | Update agent endpoint to download scripts. | |
| ITOM-52697 | OpenAPI Specification | Manage site resources. | |
| ITOM-52698 | OpenAPI Specification | Manage site resources. | |
| Documentation Changes | DOC-2072 | — | Update alert lifecycle overview. |
| DOC-2427 | — | Add Netflow and Unified Communication monitor documentation. | |
| DOC-2742 | — | Provide documentation to clarify gateway chaining. |
Week of May 25, 2021
| Update Type | Issue No. | Category | Change Description |
|---|---|---|---|
| New Features | ITOM-46045 | Device Management Policy | Filter Gateway-managed resources from **Setup -> Resources -> Device Management policies**. This feature helps to identify all gateway managed devices within the client or devices managed by a specific gateway based on the selection criteria. |
| CON-1620 | Content | Added a template for Veritas Cluster Monitoring. | |
| CON-1619 | Content | Added a template for Windows Cluster Monitoring. | |
| Enhancements | ITOM-47777 | Reports | The patch report is enhanced to support custom attributes. |
| ITOM-49889 | Reports | The reports status bar is enhanced to provide more context about the report generation stage. | |
| Issues Fixed | — | Performance | Fixed issues that caused slow load times on certain pages. |
| — | Metrics | Fixed an issue that displayed incorrect metric values on certain pages. | |
| — | Search | Fixed an issue that displayed incorrect search results. | |
| API Changes | ITOM-48228 | Resource Management | OS architecture details are added to the Get Resource API. |
| Documentation Changes | — | Reference | Updated OpsRamp public IP address. |
| — | Admin Guide | Added advanced query language (search) quick start and reference. | |
| ITOM-52456 | Alert Correlation | Updated alert correlation training file description. | |
| DOC-2770 DOC-2774 | Synthetic Monitors | Updated Synthetic monitoring template content with additional configuration values. | |
| DOC-2772 | Synthetic Monitors | Updated the whitelisted IP addresses for Synthetic monitors. | |
| DOC-2773 | Synthetic Monitors | Updated Synthetic monitoring troubleshooting topic. | |
| DOC-2761 | Monitoring | Added table of G1 agent monitors. | |
| — | Database Monitors | Added CONNECT privilege for oracledb. |
Week of May 11, 2021
| Update Type | Category | Change Description |
|---|---|---|
| New Features | Infrastructure | v2 Infrastructure search provides partner-level advanced search which supports easier access to resource data across clients. |
| Agents and gateways | A client-level critical alert is generated every Monday for agent and gateway-based resources that are at the N-2 version. This alert identifies the number of agents and gateways that is not supported in the next major release. |
Week of April 27, 2021
| Update Type | Category | Change Description |
|---|---|---|
| New Features | Dashboards | v2 Dashboards are available for non-automonitoring clients. To gain access, reach out to Support. |
| Dashboards | v2 Dashboard supports Honeycomb visualization for the metric tile. | |
| Custom Authentication | An authentication model (Custom Authentication) is available in outbound configurations which integrates tools that support secured keys in headers or URLs. | |
| Enhancements | Infrastructure | v2 Infrastructure search displays alerts from their respective resources within the slideout. |
| NetApp Monitoring | The following NetApp resources support additional metrics:
| |
| Process Automation | Workflow developers and users now have the ability to do searches in the following task types:
| |
| Issues Fixed | General | Improved UI/UX performance and consistency. |
| Service Maps | Fixed an issue that resulted in imported services notes not carrying details on their associated resources. | |
| API | Patch compliance | The API gets patch compliance details of resources against a chosen baseline in the patch compliance configuration. |
| Resource Management | The Get Resource API provides identity and zone/region details. This is important for cloud-based resources. | |
| Resource Management | The Get Resource API, Search Resources API, AdvancedSearch API now also enter the OS architecture attribute in the response payload. |
Week of April 20, 2021
| Update Type | Category | Change Description |
|---|---|---|
| New Features | Agent | Agent self-monitoring for monitoring failures. This feature generates an alert when agent-monitored metrics are interrupted. Also, the generated alert lists the metrics that are not collecting data. |
| Azure Services | The following new Azure services are provided:
| |
| Reports | Added a new standard Alert Escalation Policy Report, which provides a summary of alert escalation policies for selected Partner or Client. | |
| Enhancements | Gateway | Added domain name support for NTP servers. You can configure the NTP server with an IP or a DNS address. |
| Gateway | SNMP read community name is shown in the gateway Web UI Administrative Menu > Setup > SNMP. The community name helps to discover and monitor the gateway using SNMP. | |
| Knowledge Base | Knowledge base articles can be sorted by subject, alphabetically. | |
| Reports | Enhanced the Device Report to include additional device attributes. | |
| Standard reports | Standard reports are enhanced to allow editing after a schedule is created. | |
| Issues Fixed | Agent | Improved UI/UX performance and consistency. |
| Agent | Fixed by completely showing the Windows OS build number in the OS attributes section. | |
| SNMP Definitions | Fixed an issue where SNMP definitions were not visible for partner and client users. Users at all levels can view existing SNMP definitions. Also, because users can only submit new SNMP definitions for OpsRamp review, the add button is renamed to Submit. All user submitted SNMP definitions is reviewed for approval by OpsRamp. | |
| Reports | Fixed an issue related to the Custom Metric Report where the metric was graphed in bps rather than mbps. | |
| Windows | Fixed an issue that caused windows EC2 hosts running on AWS to report an incorrect operating system. This was due to an outdated SDK that has since been updated to reflect correct operation systems names. | |
| Logs | Fixed an issue that prevented the event log monitor from picking up the event. This issue was due to the use of special characters [, ], {, }, (, ), $, +, *, /. To resolve, use the escape character `\` for special characters with expressions used to capture event logs. |
March 2021
We are excited to announce our Spring 2021 (v9) update!
This release focuses heavily on our Discovery and Monitoring solution. Our goal is to provide a streamlined monitoring experience for teams that want visibility into Public Cloud and Kubernetes-based applications and workloads.
Note
The features and products discussed below are subject to change between now and the release date.Discovery and monitoring
Auto-monitoring
Seamless onboarding and monitoring of public cloud, cloud-native, and Linux agent resources
Newly-created clients have the option to set discovered resources to be automatically monitored. This enhancement greatly simplifies the setup process for getting resources onboarded and monitored.
Resources that qualify for auto-monitoring include:
- AWS, Azure, and Google Cloud resources
- Kubernetes resources, including Openshift and K3s
- Linux agent-based resources (RHEL, SUSE, Oracle Linux, Amazon Linux)
Limitation
Only available for newly created clients.Hybrid cloud onboarding guide
The hybrid cloud onboarding guide focuses on moving administrators from setup and configuration to visualizing performance metrics as quickly as possible.
After the onboarding guide completes, a new dashboard model and a set of curated dashboards are presented. The dashboard model and set of curated dashboards are based on the onboarded integrations and technology.
The resources supported in the onboarding wizard include:
- AWS, Azure, and Google Cloud
- Kubernetes
- Linux agent-based systems (RHEL, SUSE, Oracle Linux, and Amazon Linux)
Note
The onboarding wizard is only operable with resources compatible with the new auto-monitoring model. This setting is only available for newly-created clients.Alert definition model
Accompanying the new auto-monitoring model, a new alert definition construct is available that allows administrators to streamline threshold settings on metric data. The new model provides enhanced flexibility for setting alerts and a centralized repository of all alert definitions that users set on metric data.
Limitations
- The new alert definition model is only compatible with the new auto-monitoring model and with auto-monitoring resources.
- This setting is only available for newly created clients.
- Availability settings are not currently available.
Dashboards 2.0
The new dashboards allow you to create and customize visualizations for your cloud and cloud-native infrastructures. Dashboards 2.0 has a built-in query builder that allows you to write complex queries using Prometheus Query Language. These dashboards currently support the following tile types: rich text, image, line graph, and bar graph. Dashboard 2.0 also offers a robust color palette to format and style your charts and graphs to fit your needs.
Note
Dashboards 2.0 are only compatible with the new auto-monitoring model. This setting is only available for newly created clients.Curated dashboards
Curated Dashboards are out-of-the-box dashboards that are configured to give you instant visibility into the status/health of popular cloud/cloud-native services such as AWS, Azure, GCP, and Kubernetes. Curated dashboards can be copied and used as a starting point to create custom dashboards.
Note
Curated Dashboards are only compatible with the new auto-monitoring model. This setting is only available for newly created clients.Container and cloud-native monitoring
Container-based application detection
With the focus on providing visibility into containerized workloads, native container monitoring is extended to support the discovering and monitoring of containerized applications. Users can visualize application metrics and alert on key performance indicators to ensure that applications are available and running.
Providing visibility into the applications running in containers gives administrators the next level of insight into the services supporting their business applications. Over 25 applications are auto-detectable, including Cassandra, MongoDB, MySQL, and Kafka.
Note
Container-based application detection is only compatible with the new auto-monitoring model. This setting is only available for newly created clients.Prometheus metrics integration
The ingestion of Prometheus metrics into the platform is available. Metric ingestion provides data federation across their Prometheus instances and long-term storage of Prometheus metric data.
Limitations
- The Prometheus metrics integration is only compatible with the new auto-monitoring model.
- This setting is only available for newly created clients.
- Alert definitions cannot be set for prometheus metrics for the initial 9.0.0.
- You can still leverage dashboards 2.0 for metric visualization but need to use the Prometheus Alert Manager integration for alerts.
Enhanced Kubernetes cronjob/job metric support
The Kubernetes agent implementation now collects cronjob and job metrics from kube-state.This enhancement permits visibility into the active jobs running within the kube cluster and enables kube admins to more easily troubleshoot job failures and errors that occur.
CRI-O Runtime Support
The container runtime support is extended to include CRI-O. CRI-O is the default container runtime for RedHat OpenShift. The discovery and monitoring of CRI-O containers is supported. CRI-O provides administrators with additional context about the health and performance of their applications running on the CRI-O container engine.
Filter discovered containers in agent configuration
OpsRamp has extended its container filtering capabilities to allow for administrators to include and exclude containers being discovered and monitored by OpsRamp. You can filter the discovered containers in both the kubernetes and linux agent. This flexibility allows for administrators to only onboard containers that are relevant for their business, and ensure they are only paying for what is important for them.
Public cloud resource support
The public cloud monitoring is now extended to support several key services within AWS and Azure.
AWS
- AWS Connect
Azure
- Azure Blob Storage
- Azure Table Storage
- Azure File Storage
- Azure BatchAI Workspaces
- Azure BlockChain
- Azure Databox Edge
- Azure Logic Integration Service Environment
- Azure Kusto Clusters
Updated Azure Metric Support:
- Azure CDN
- Azure ExpressRoute
Azure monitor event ingestion
Events that are generated by Azure Monitor can now be ingested.
Administrators can post events from the Azure monitor into OpsRamp to federate their event management and reduce event fatigue. Native alert correlation and escalation policies ensure that events are de-duplicated, correlated, and escalated to the appropriate team members.
Block agent installed cloud resources without an integration
Previously, agents installed on cloud resources (AWS, Google Cloud, Azure) without an installed cloud integration automatically connected to OpsRamp. For auto-scaling resources, this often meant that stale resources persisted after the resource was deleted in the cloud provider because agent installed resources are not deleted automatically.
Administrators can configure the option to block cloud resources with an agent installed if there is no matching cloud account ID. This permits administrators to reduce stale resources and ensure that only the resources they care about are onboarded.
Notification and blocking of duplicate cloud account installations across clients
In large organizations, it is not uncommon for many administrators to have access to the same cloud account. Unfortunately, administrators that integrate cloud accounts with OpsRamp might not be able to determine if the account is onboarded previously, and might reinstall it in a separate client. This creates duplicate resources across clients and increases cloud-watch spend. Now, administrators can set configuration to block duplicate cloud accounts across multiple clients.
Datacenter monitoring
Cisco Hyperflex
Discovery and monitoring of the Cisco leading Hyper-converged infrastructure solution, Hyperflex HCI systems, is supported.
Integration covers discovery of Hyperflex components, including clusters, nodes, storage disks, and VMs, monitoring them for performance and availability. Integration also supports event ingestion from Hyperflex into OpsRamp.
Event and incident management
Partner-level first response policy
Users who manage multiple clients on behalf of customers can now create a first response policy at the partner level to significantly reduce the time needed to create and manage alert policies. A single machine learning training file is provided for ease of use and convenience.
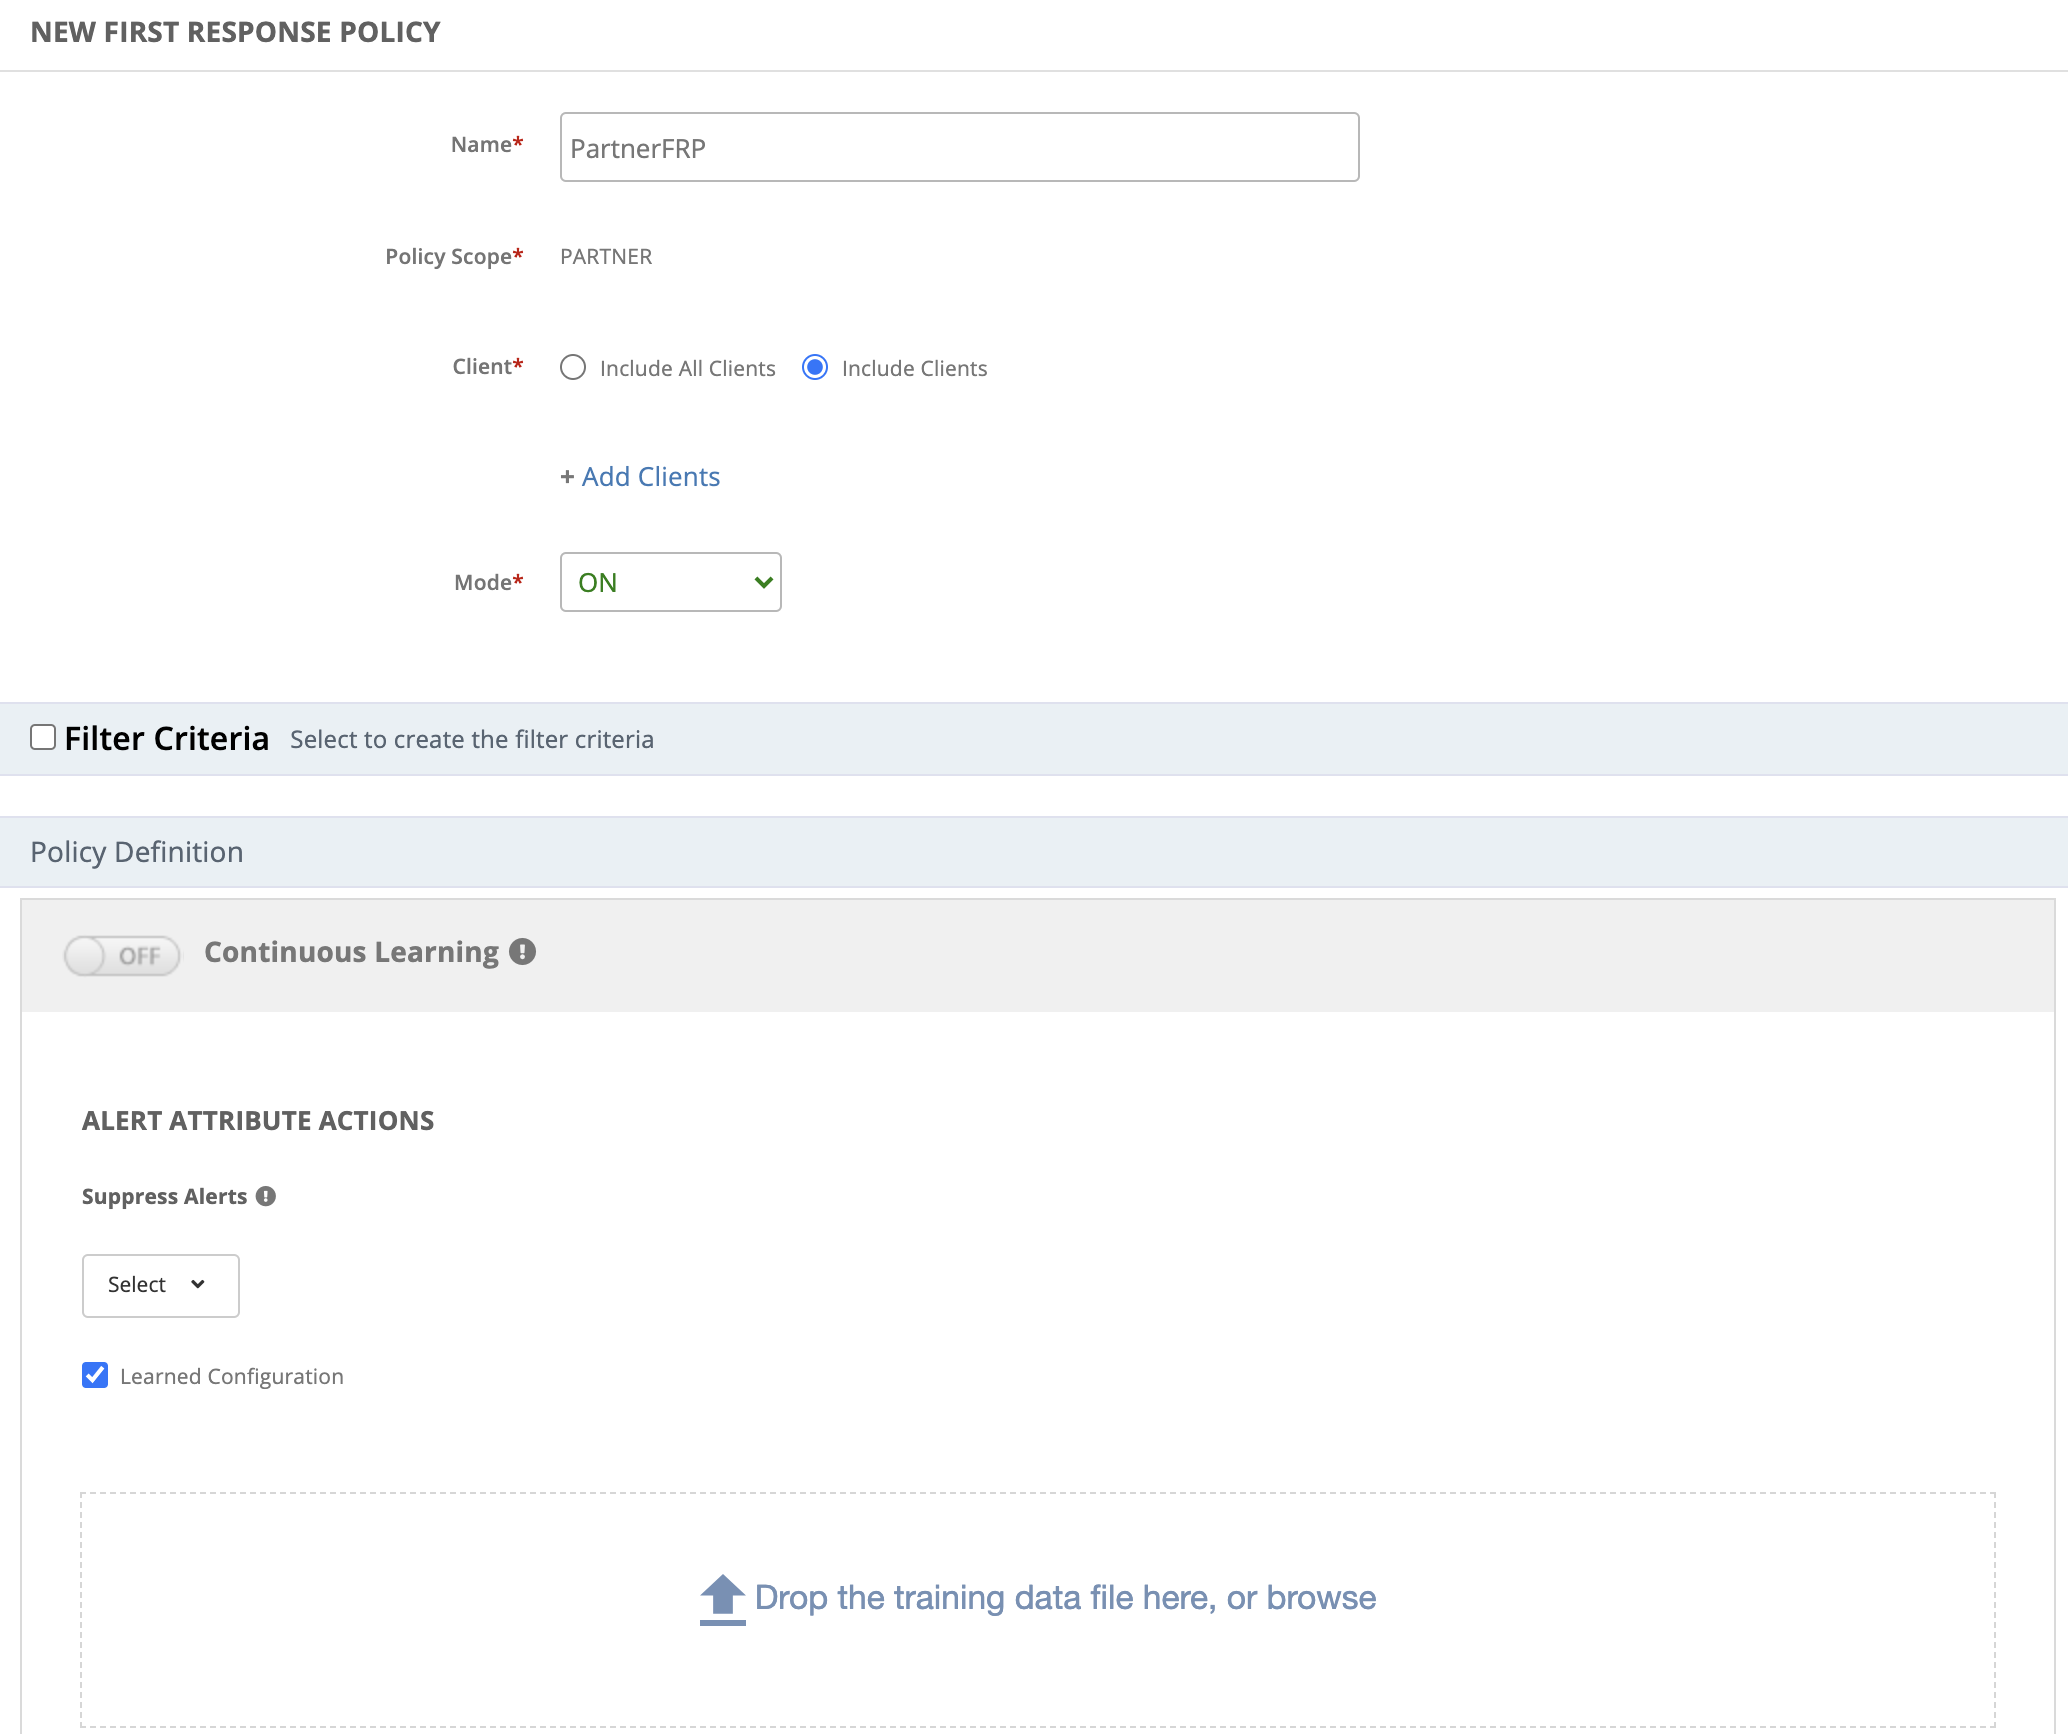
Limitation
Running of process automation workflows.Seasonality time frame selector
To further reduce alert noise and fatigue, the client level first response policy now includes the option of selecting a time frame of up to three months to identify alert seasonality patterns and suppress them. Previously the default was three months of alert data.
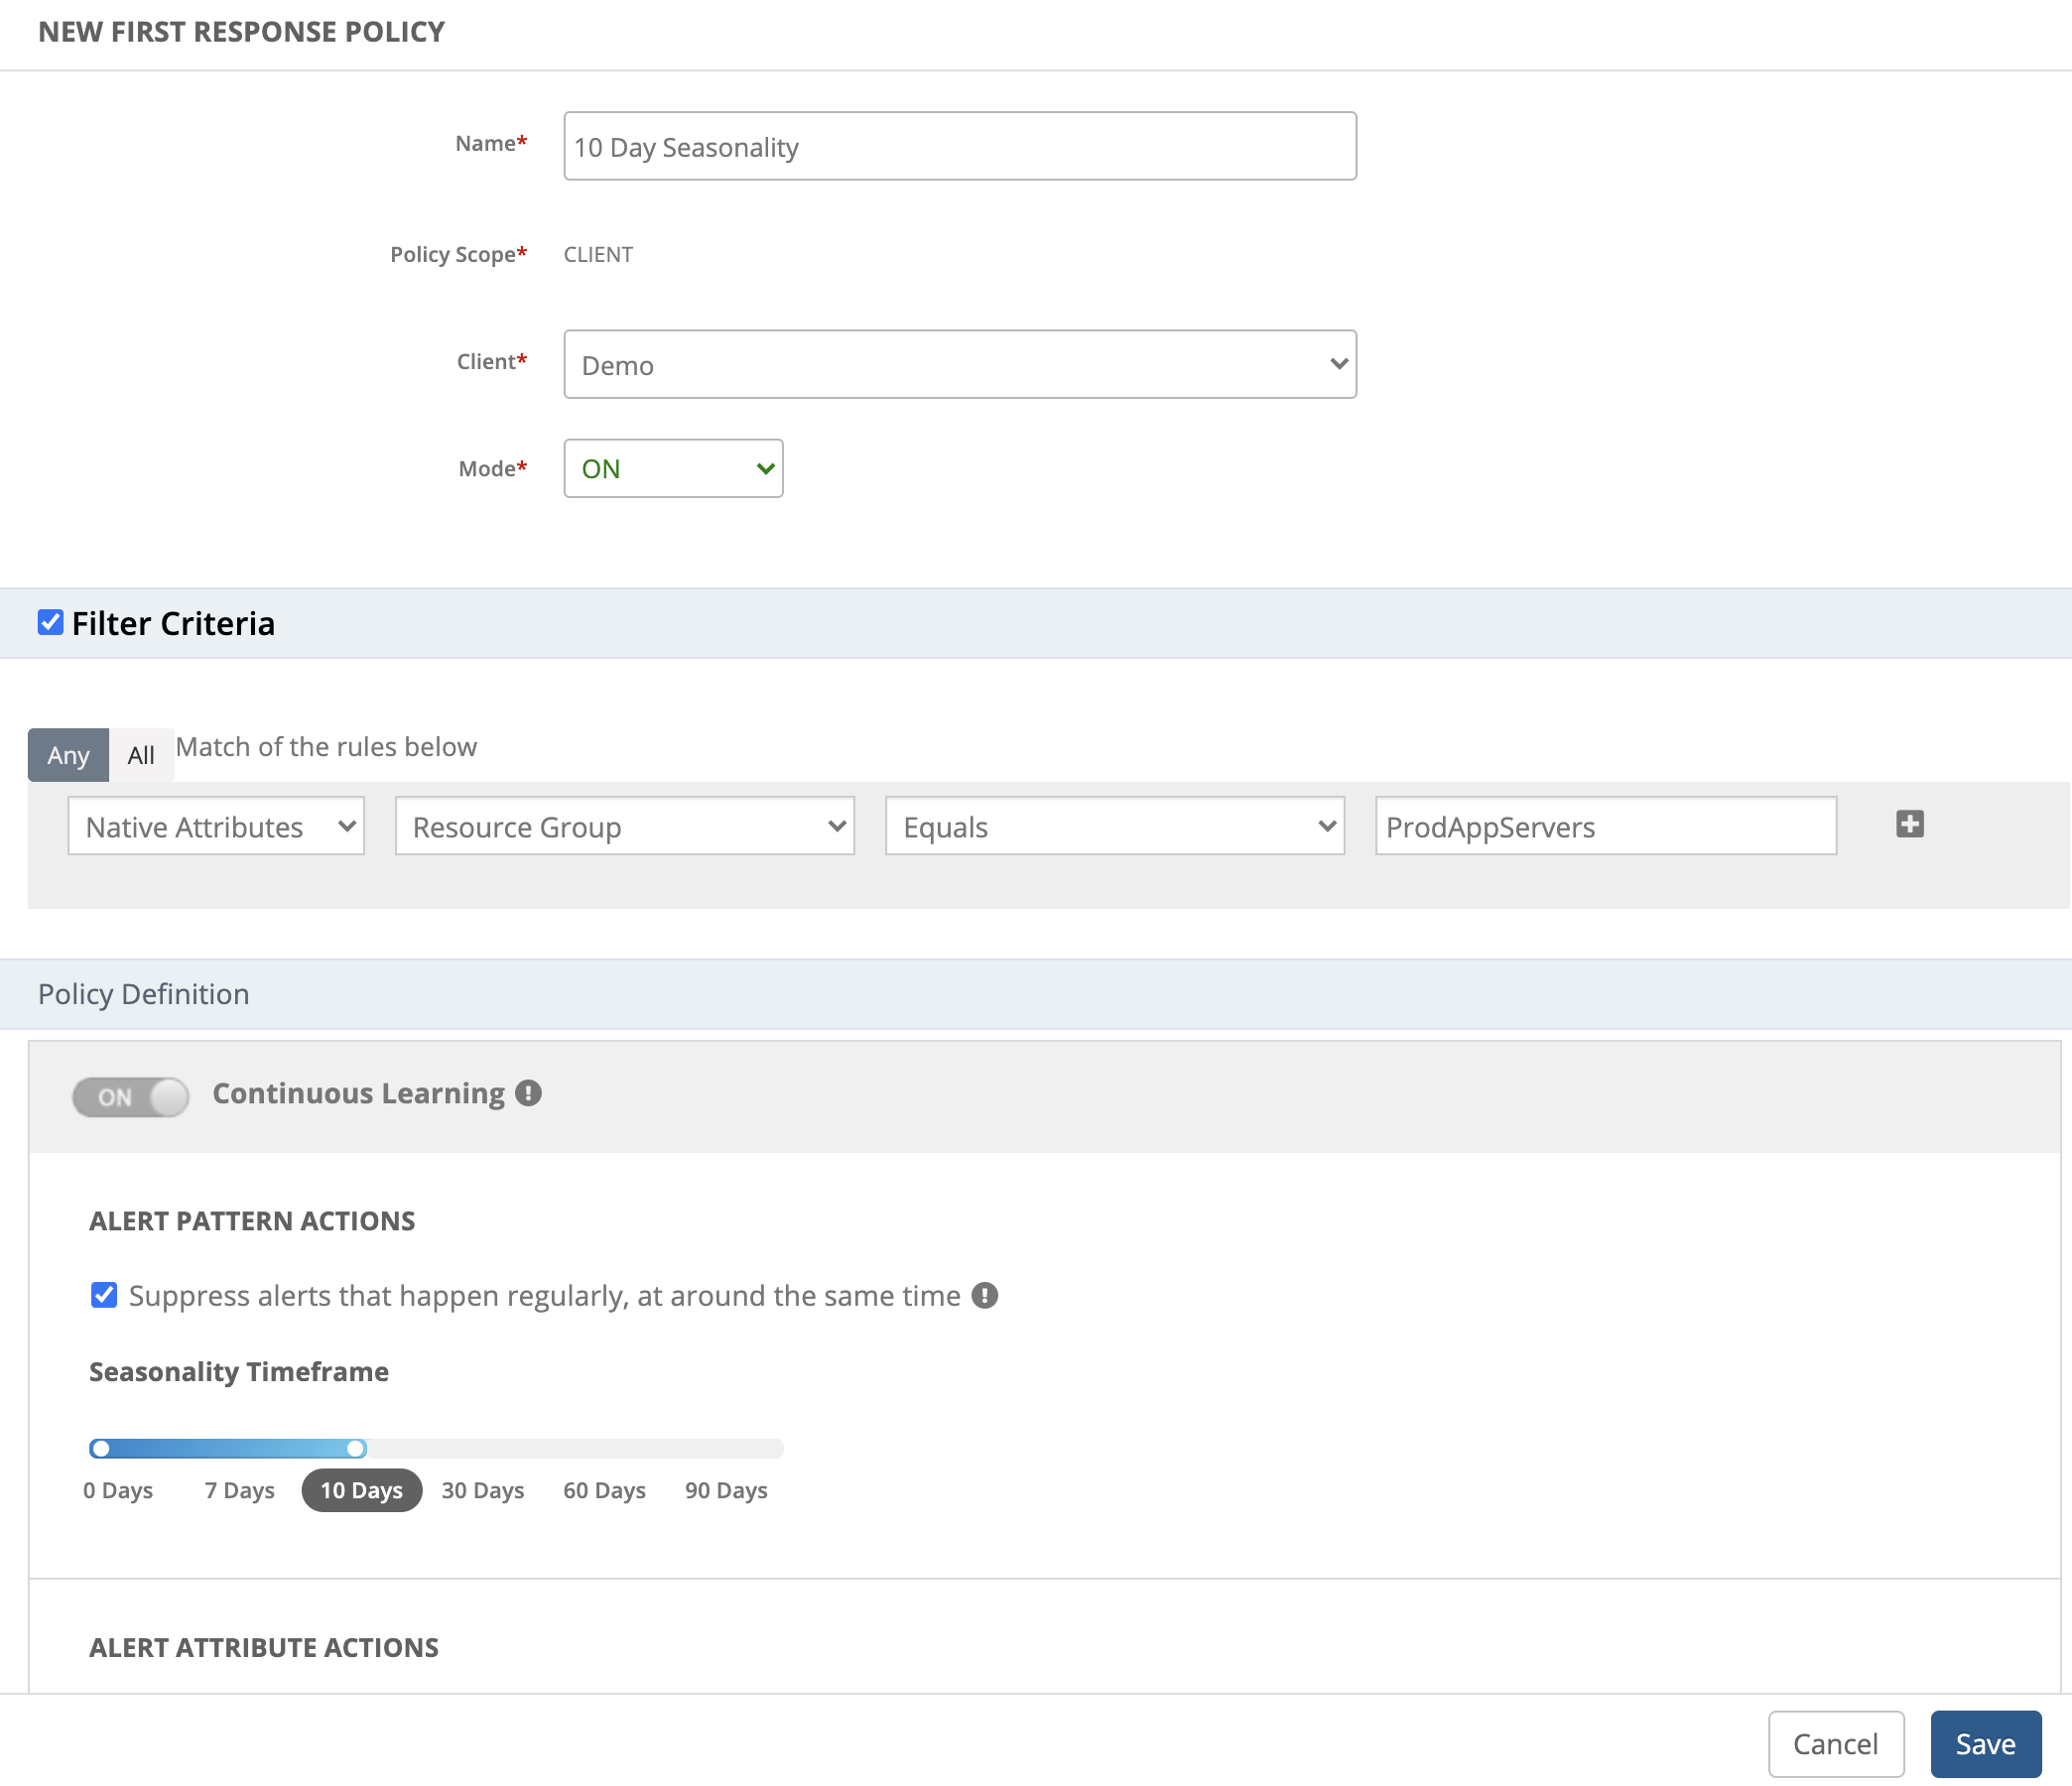
Custom attribute alert escalation support
Users who have defined custom attributes for their resources and services can now select them during the configuration of alert escalation policies when defining alert conditions.
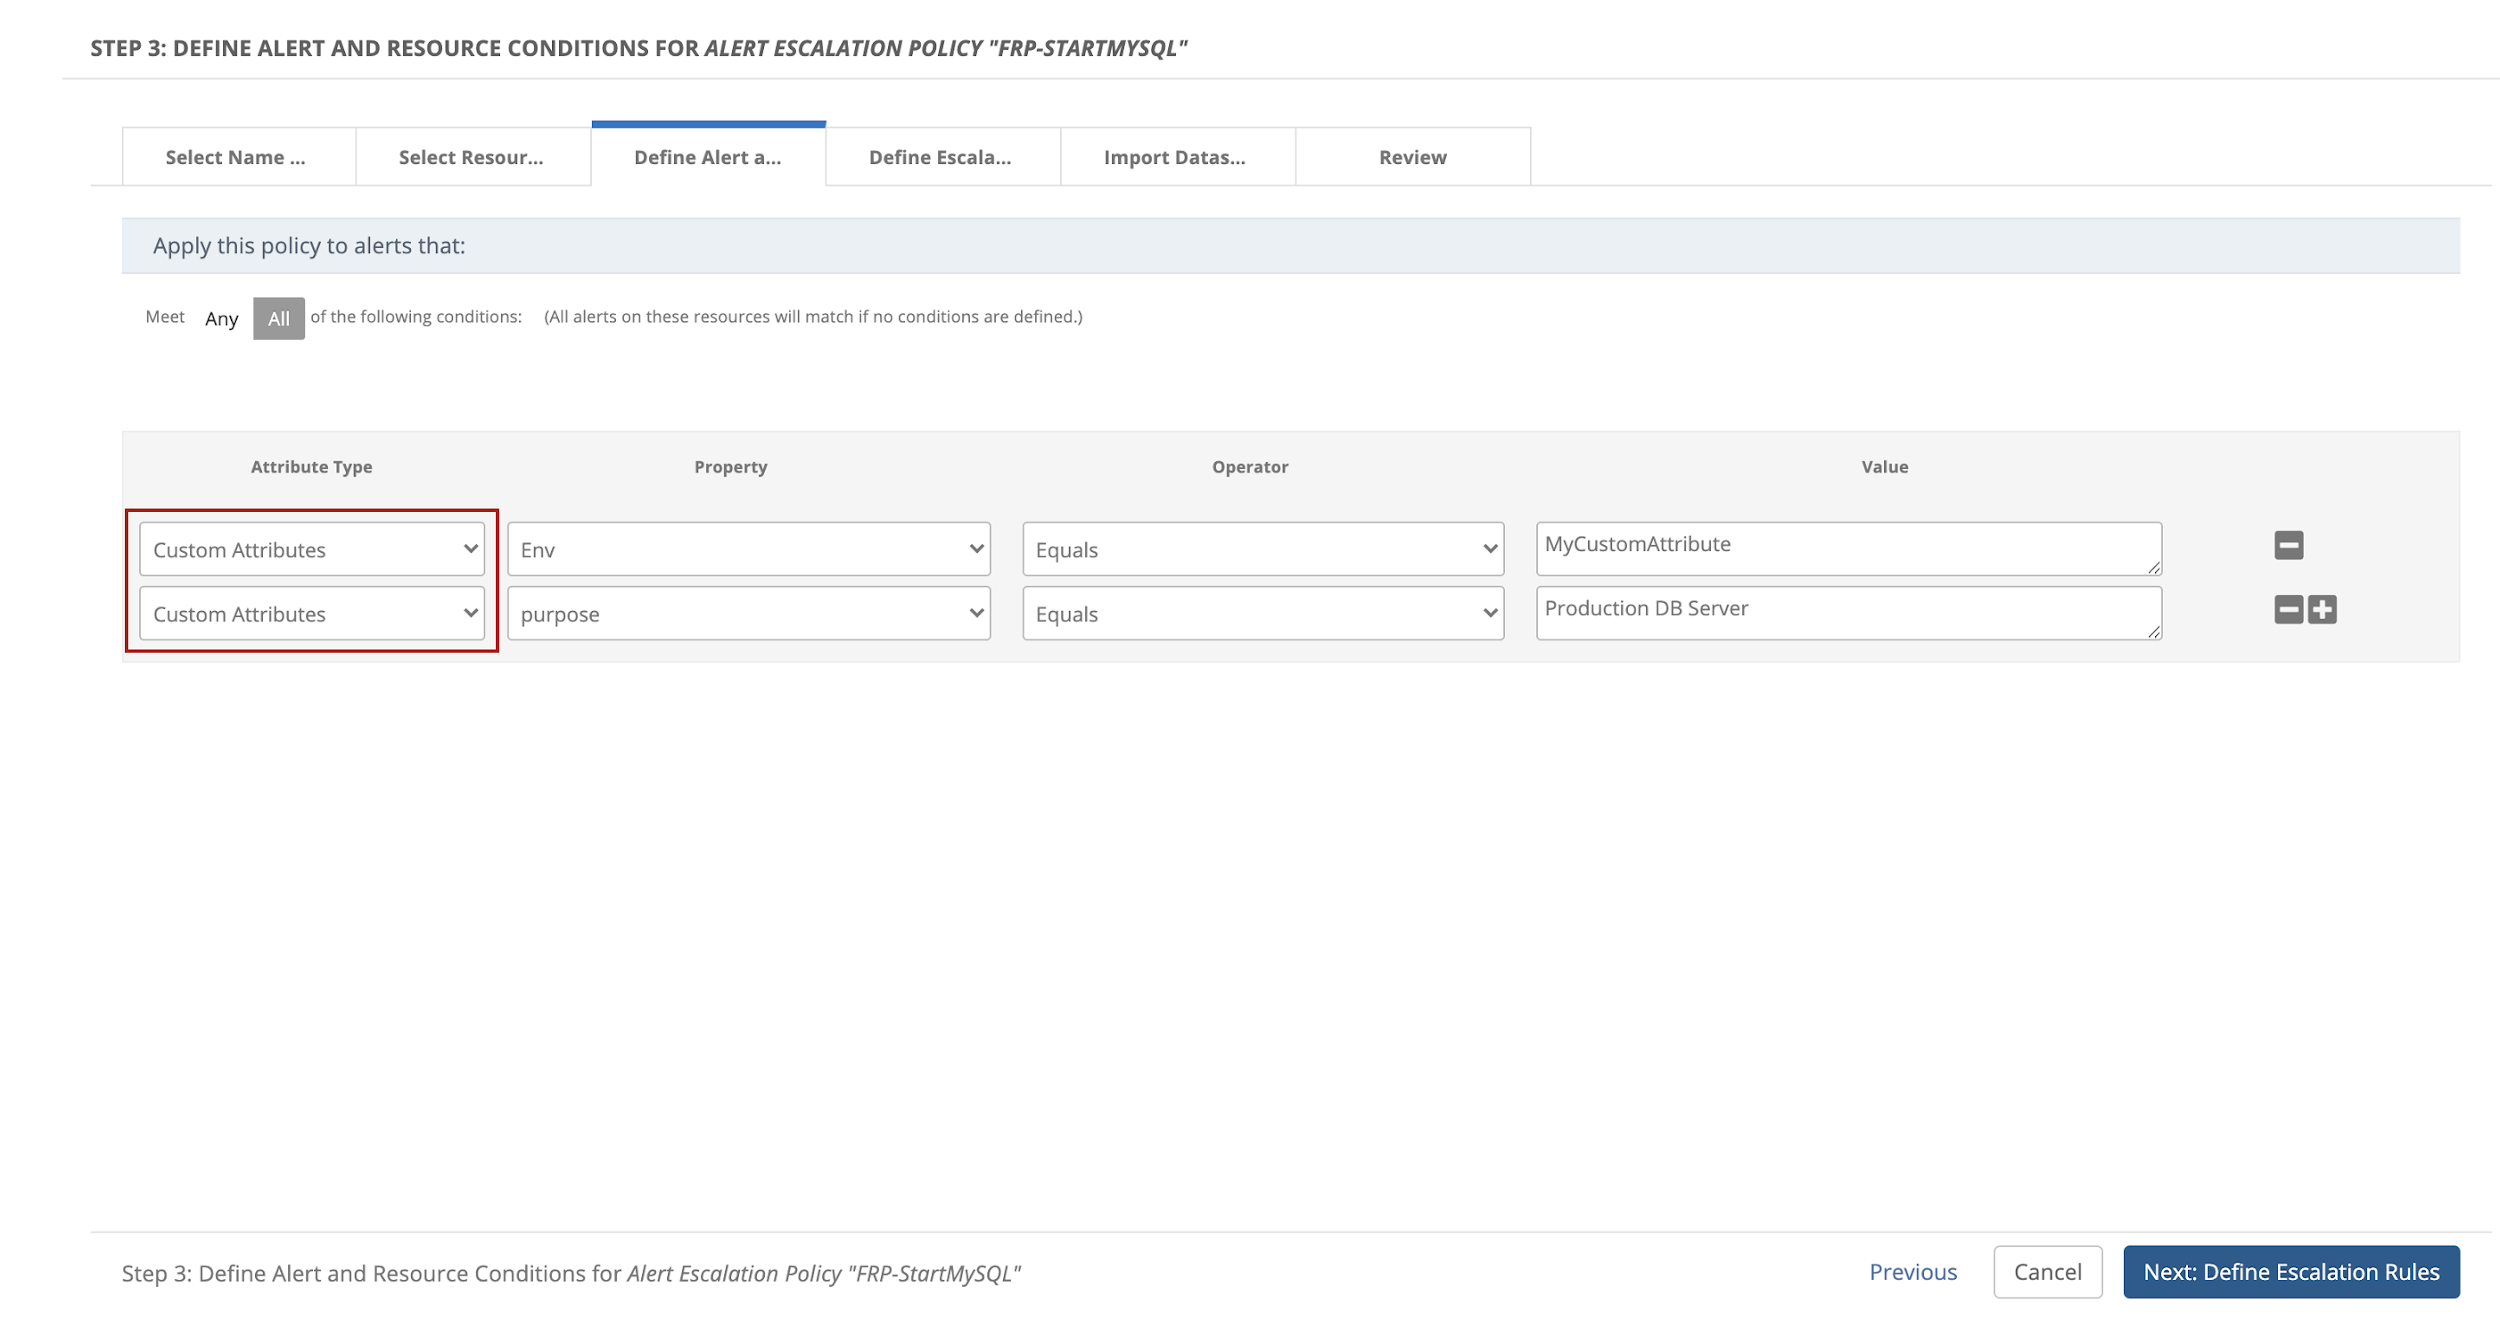
Enhanced webhook-based inbound service management entities
Collaboration integration inbound configurations are extended to support service Requests, problem records, and change record, with incident management. This enhances the capability for integration with webhook-based service management entities.
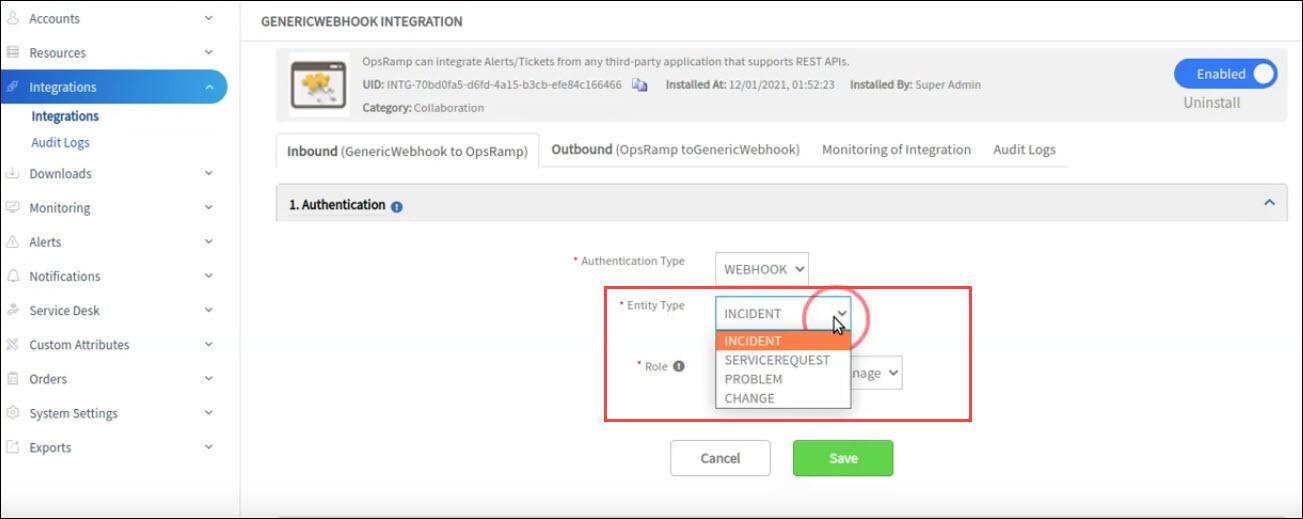
Remediation and automation
Timer boundary event
Often, during the runtime execution of a process automation workflow, there is a need to pause for a specific time interval before continuing to the next task in a sequence flow. The timer boundary event now adds this flexibility when creating workflows.
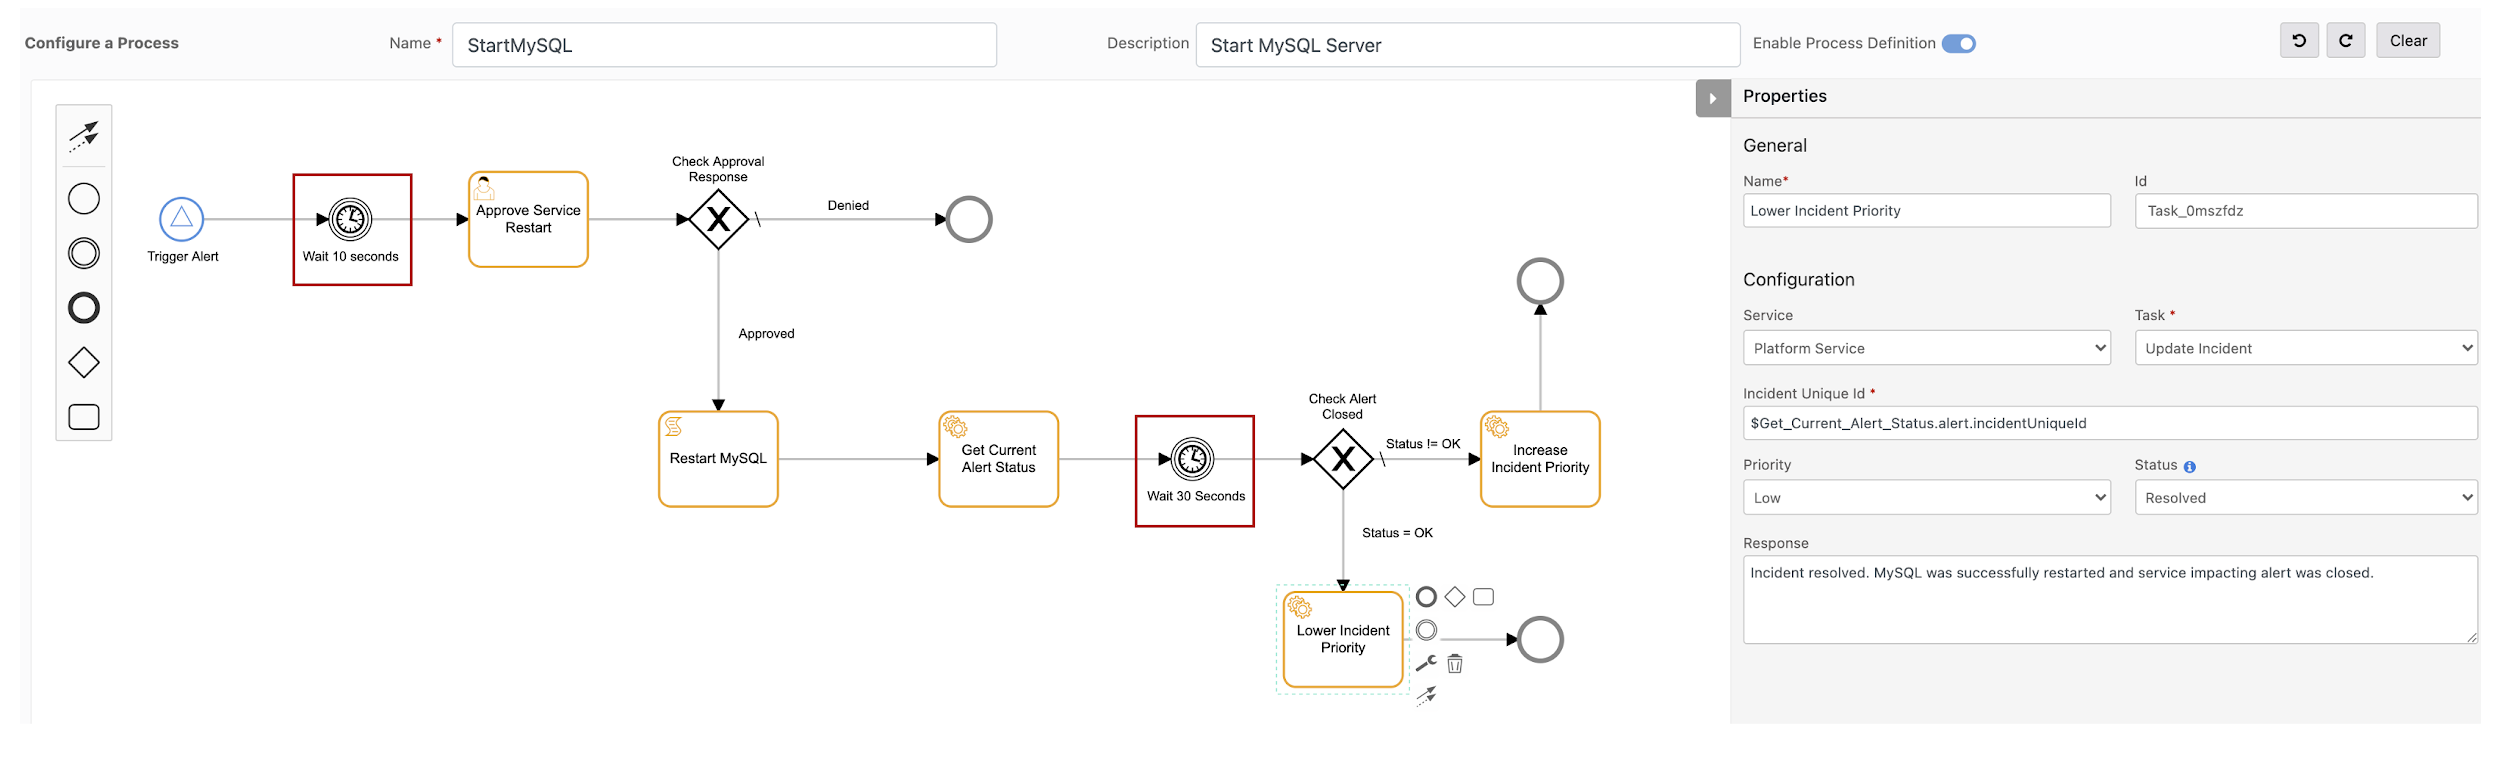
Permission set
Administrators can now provide secure access to process automation features within the platform to only those users who are required to view or manage workflows.
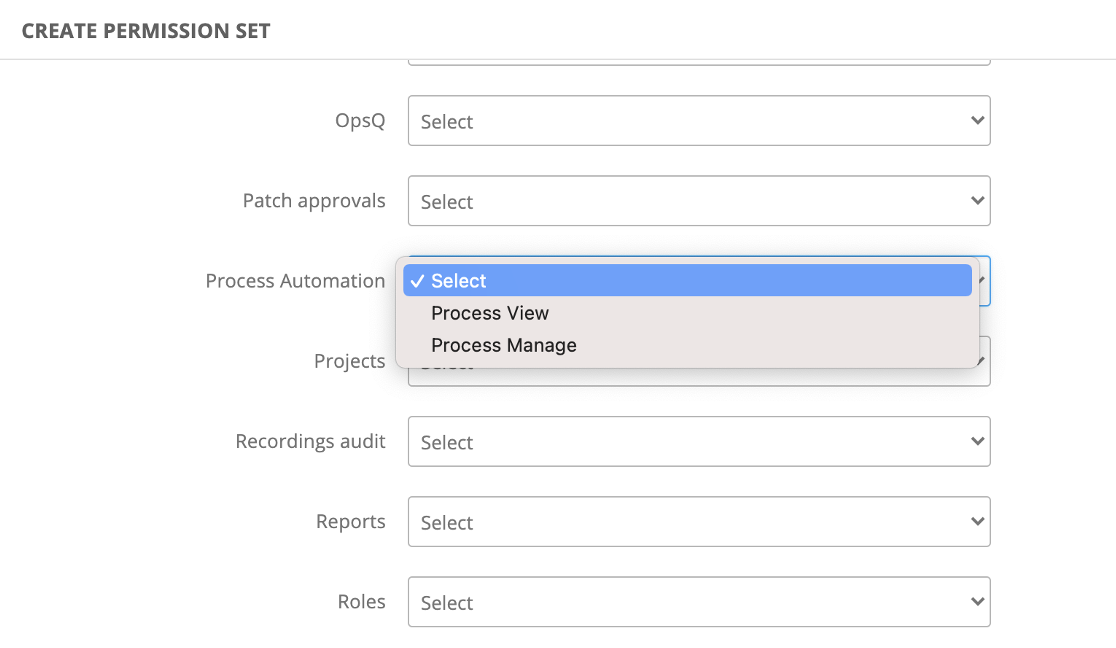
Process definition and instance search bar
A new search bar is provided to enable automation users to rapidly search for process definitions or process instances that are available to manage and view.
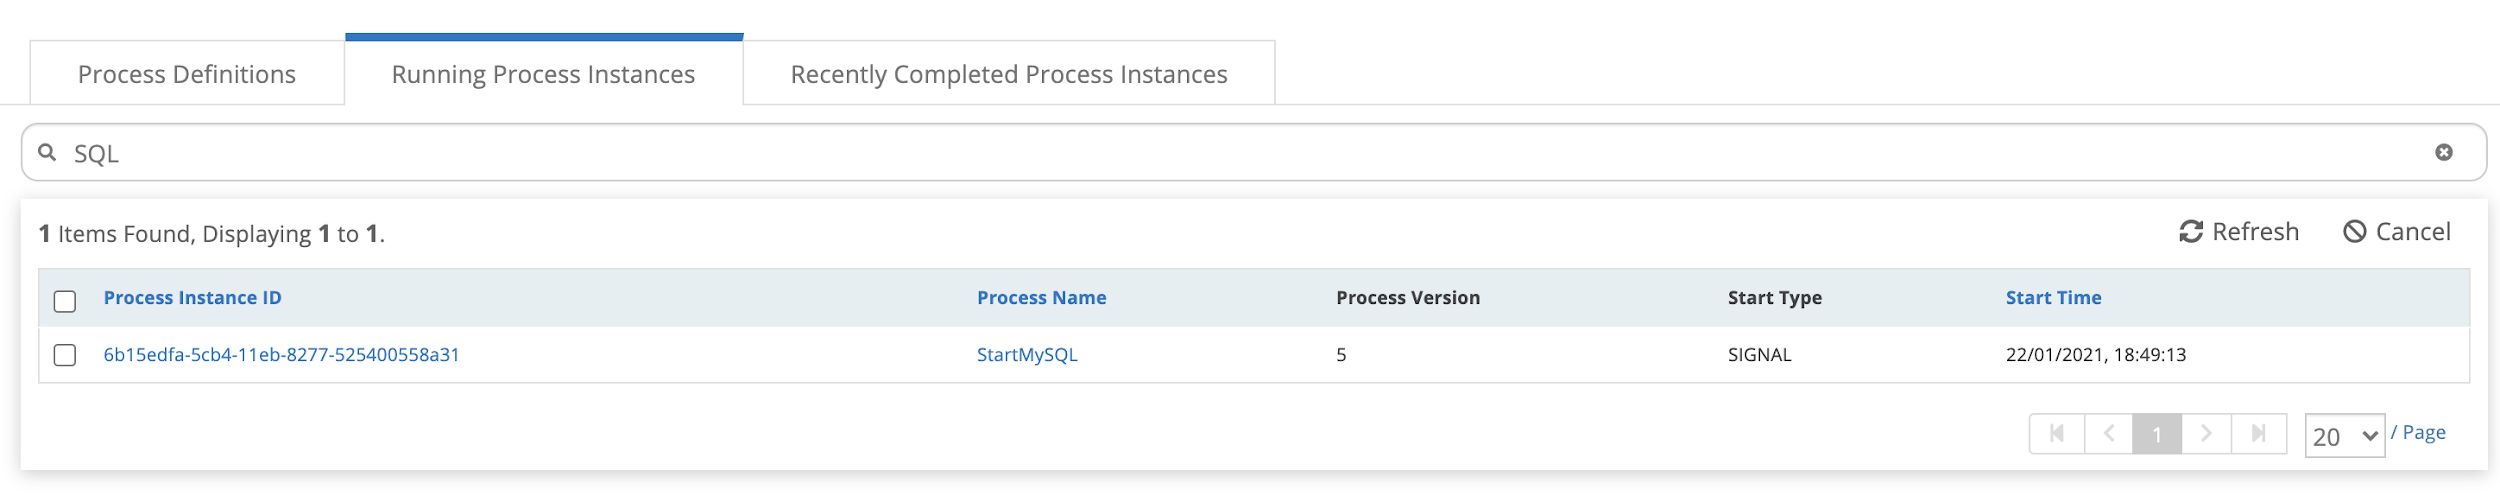
Patch management and antivirus
Patch installation progress tracker
Users can now track patch installation progress right from the patch configuration page. You can see the approved, installed and failed patches in the patch configuration in quasi-real-time. This allows the patch administrators to take corrective action on failed devices within the patch window.
Notification for superseded patches
Users can now choose to be notified every time a superseded patch is un-approved. Users subscribing to the patch scan notification email get a summary of all approved patches that have since been unapproved because they are superseded.
Bitdefender antivirus support
Bitdefender antivirus is supported. Users can configure an antivirus update job to update Bitdefender definitions to the latest versions.
Reports and exports
Agent connectivity details in inventory report
The Inventory Report now includes an attribute for the agent connectivity method, for agent-managed devices. This attribute provides information on whether the agent is installed to connect directly or through a proxy.
Include only specific hours of week in reporting period
The customizability of reporting periods is improved by allowing users to report on specific hours for each day of the week. Common usage for this feature is to schedule reports for business operating hours. This change is now available for the Alert Report, Availability Report, and Network Statistics Report.
Metered usage export
A new batch export type is available for exporting resource usage over a time interval. The usage export provides both a breakdown of metered usage by resource type and a breakdown of usage by tenant. This export provides insight into how resource consumption is metered.
UI enhancements and enablement
New infrastructure search
The new infrastructure search allows you to more easily access resources within a certain client. You can do advanced search queries to find resources and access their recent queries at a later time.
New platform navigation
The new navigation allows users to more easily access platform areas from anywhere on the platform. By moving the core interaction to the top header, users have more horizontal space to do tasks.
Modernized login screen
The default login screen now features a modernized look and feel.
New in-app feature request support
You can now submit feedback within the application by clicking on the top right of your user profile icon to access the Resource Center and clicking Share Your Feedback.
The submitted feedback is reviewed by the OpsRamp team and is used to make future product decisions.
In-app guides
The UI now includes feature guides that educate you about new features. These guides highlight a feature with a short descripton or steps you through the process of using a feature.
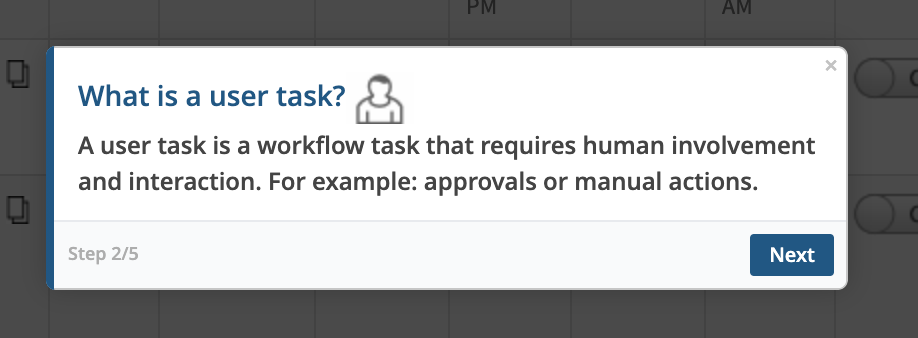
APIs
The OpsRamp API documentation site is improved and provides the details about the schema and payloads for API endpoints.
Alert management
- First response policy APIs is extended to the partner level and at tenancy scope. This feature allows the administrator to efficiently manage all client policies.
- First response policy APIs support a seasonalitytimeframe property. This feature defines the training window and is used to detect patterns. Default: Three (3) months of learning data.
- Correlation policy APIs are updated to handle Machine Learning attributes using filtering criteria and uploading the training file.
- Alert API is available to retrieve correlated alerts for a given Inference alert.
- Alert APIs are available to enable automated uploading of training data and automated learning of machine learning-based policies.
Integrations
- Cloud API for K8 defines a default parameter.
- Collaboration APIs are extended to support change records, service requests, and problem records configurations for webhook-based inbound integrations. This is done by accepting ITSM tools that support webhook-based entities.
- APIs for outbound configurations are updated to also support multipart attachments.
- Integration API for VMware supports resource discovery configurations for VMware Compute integrations.
Process automation
Automation APIs are available for designing and managing process workflows.
Deprecated features no longer available
Legacy Java consoles
As announced in an earlier deprecation notice, legacy Java consoles are now end-of-life and the listed features are no longer available.
- Console launch using VNC
- File transfer option using FTRANSFER
- Terminal access using RMSHELL option
- Teamviewer Integrations
Users can now launch consoles within a browser.
Impacted resource tab
As announced in an earlier deprecation notice, the impacted resources tab and corresponding APIs are removed from the infrastructure page. To gain insight into resource relationships, leverage the native topology explorer and related Topology APIs
Stopped agent support for EOL operating systems
As announced in an earlier deprecation notice, Linux Agent is not supported on CentOS 5.x, Ubuntu 10.x, 11.x, 12.x, and 13.x operating systems because support for the OS has ended.
Week of February 16, 2021
Enhancement
- Stability: The Resource page is optimized to reduce page load time for several critical user flows. This includes the rendering of the resources page, navigating from resources to resource groups, and loading the resources within a resource group.
Issues fixed
- Resource Groups: Fixed an issue associated with creating a resource group while using the
Add using Queryoption. - Stability: Fixed an issue associated with navigating resources.
Week of January 26, 2021
Issues fixed
- Service Management: Fixed an issue that caused unexpected email subjects in Incident Notification emails.
- Notification: Fixed an issue that blocked approval requests from being sent to email from OpsRamp service desk.
- Agent: Fixed an issue incorrectly handling external parameters for app monitors
- Agent: Fixed an issue that blocked the older version of agents from updating to the 8.0.0 version.
- Agent: Fixed an issue causing an incorrect mapping of free disk values.
- Report: Fixed an issue in inventory reports causing confusion as to what resource attributes were being filtered against.
Week of January 5, 2021
Enhancement
Templates: Added SNMP-based monitoring support for NetApp SolidFire storage infrastructure.
Issues fixed
- Synthetic Monitoring: Fixed an issue causing alignment issue for metrics on recorded script-based synthetics.
- Process Monitoring: Fixed an issue blocking editing of Linux agent process monitors within a template.
- Monitoring Management: Fixed an issue allowing for the creation of duplicate client-level metrics.
- Availability: Fixed an issue causing agent-installed resources to display the status as Down even though the application represented those as being Up.
- Service Desk: Fixed an issue preventing editing of My Views within the Service Desk module.
- Metric Report: Fixed an issue wherein the the Metric report appeared blank despite a successful run.
- Alert Management: Fixed an issue causing alerts to be generated during the scheduled maintenance period.
- CPU Information: Fixed an issue causing discrepancies in the listing of CPU information on the Linux installed hosts.