Week of January 11, 2023 (2022_W52)
Log management
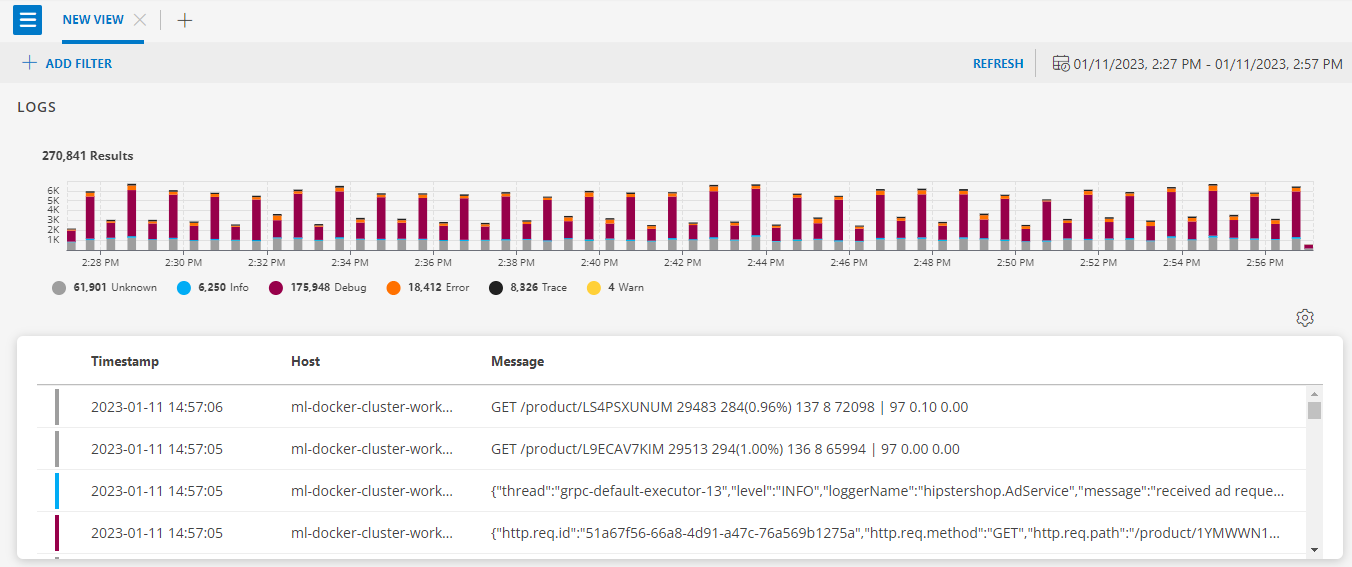
Logging is the important parts of your system’s operations and logs contain valuable information about the health of your applications. OpsRamp Log Management offers you a solution where you can gather all your logs at one place and get instant value from real time analytics. You can have a real-time view of how your applications and systems are being used and provide deeper insights to improve the quality, increase efficiency, and mitigate risks.
Users can see the Logs under Infrastructure tab.
The following are the key functionalities of Logs:
- Centralized Log Ingestion from all on-premises and cloud infrastructure resources (such as Windows Host, Linux Host, vCenter, Network, Kubernetes, AWS, Azure, GCP, etc.) and Applications (such as Apache, HAProxy, Cassandra, custom applications, etc.).
- Search, Filter, and Save Log Views based on select pre-built and custom attributes (for example, application type, timeframes, and severity).
- Automated Log Parsing using Regex based on prebuilt and custom attributes.
- Time Graph and Colour-Code Logs for severity (frequency and duration) as they are ingested and drill-down for contextual insight.
- Create Log Alerts based on application types, timeframes, severity, etc.
- View Usage detail in real-time of the log data consumed over the last 30-days or any specified time-period.
- This solution also supports log Archiving.
See Log Management for more details.
UI enhancements
Password fields with view option icon
We have added a view option while entering passwords across the OpsRamp portal. This option is not available on the login page.
See Remote Consoles for more details.
See Linux OS Agentless Discovery for more details.
See WMI Discovery for more details.
Service maps enhancements
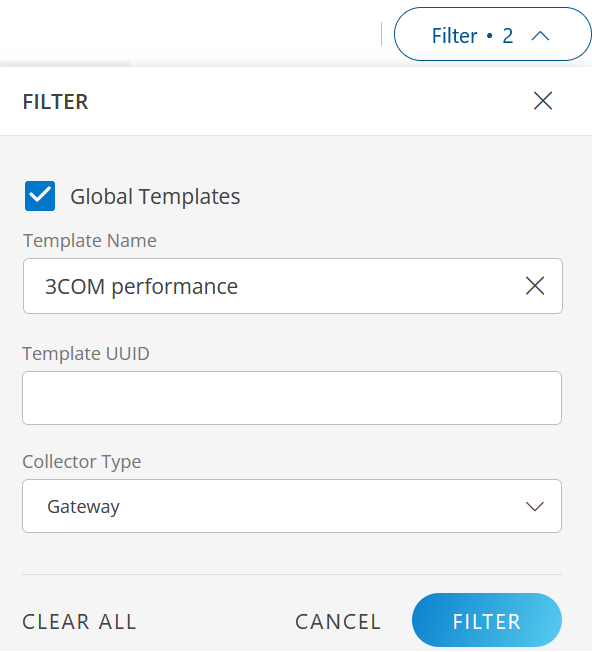
Added new filter options
The following new filters have been added to service maps listing:
Service Map Type
- Standalone
- Linked
Service Map Availability
- Up
- Down
- Degraded
See Service Maps for more details.
Core platform enhancements
Support for NotificationOnly access type
Providing support for NotificationOnly type user creation to create the user API.
Cloud monitoring enhancements
Supports of discovery policy
OpsRamp now supports discovery policy support for SaaS Applications such as: Zoom, Office365, Velocloud, Citrix, Apigee Edge, and Megaport.
Support for Azure BackupVaults resource
Opsramp now supports the discovery and monitoring of BackupVaults resources in Azure.
Support for Azure Recovery Services Vaults Monitoring
Opsramp now supports the discovery and monitoring of Recovery Services Vaults resources in Azure.
Resource management enhancements
Added client level flag
Added client level flag to enable/disable the Global DMPs for non-SDK2.0 integration apps.
See Create a Client for more details.
Monitoring management enhancements
Fixed DMP not to apply unnecessary configuration parameters
Earlier, DMP was used to apply configuration parameters of irrelevant templates. We have now fixed the DMP so that it does not apply unnecessary configuration parameters and only applies configuration parameters of relevant templates.
Provided “update resource-level parameters” flag in the device management policy
The user can protect the customized resource-level parameters by enabling and disabling the flag (update resource-level parameters):
- When the flag is enabled: Even if the resource matches the DMP filter criteria, customized resource-level parameters will be updated from the device management policy run at any time.
- When the flag is disabled: Even if the resource matches the DMP filter criteria, customized resource-level parameters should not be updated from the device management policy run at any time.
See Create Device Management Policies for more details.
View and edit option on custom script page
Agent-based G1 Custom Monitors enhanced with the ability to View and Edit the script from the relevant templates and devices.
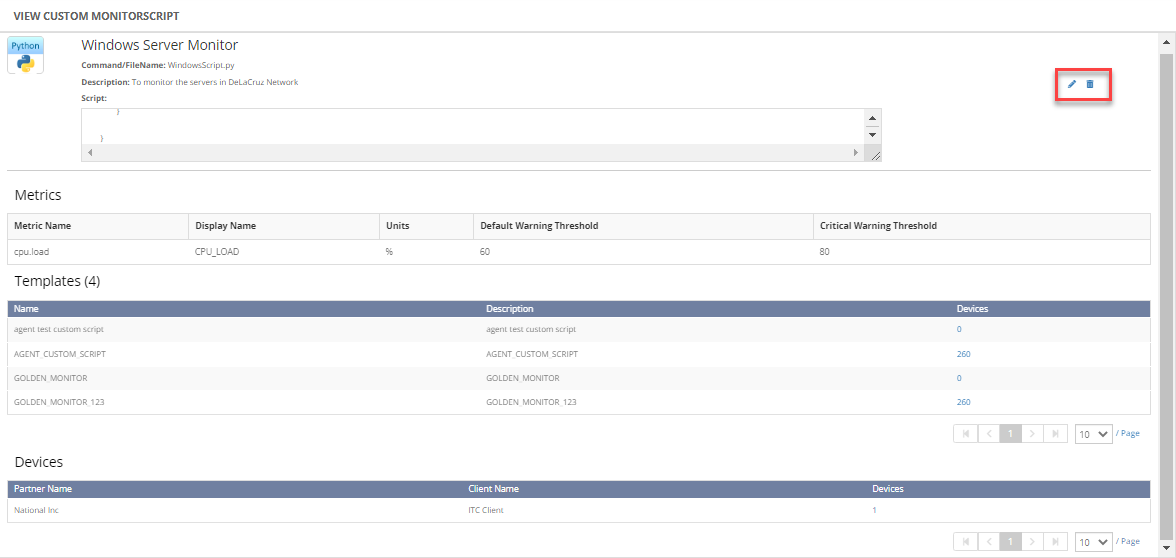
See Manage Agent Custom Monitors for more details.
G2 monitoring template precedence
If two or more templates contain the same metrics with different frequency and scopes and are assigned to the same device, we collect monitoring data for both metrics that generate the same result. This will lead to duplicate alerts generation, metric data collection, and graphs.
To overcome this, OpsRamp has implemented “Template Precedence”.
Monitoring data and alert generation are processed according to the priority. Low level priority metrics will be striked off and only active metrics are sent to the collector (agent/gateway).

See Template Precedence for more details.
Knowledge base enhancements
Ability to edit/delete the comments for KB articles
Users can now edit the comment they made in the knowledge base article, and also that comment could be deleted by the same user or the user with KB Manage permissions.
Service management enhancements
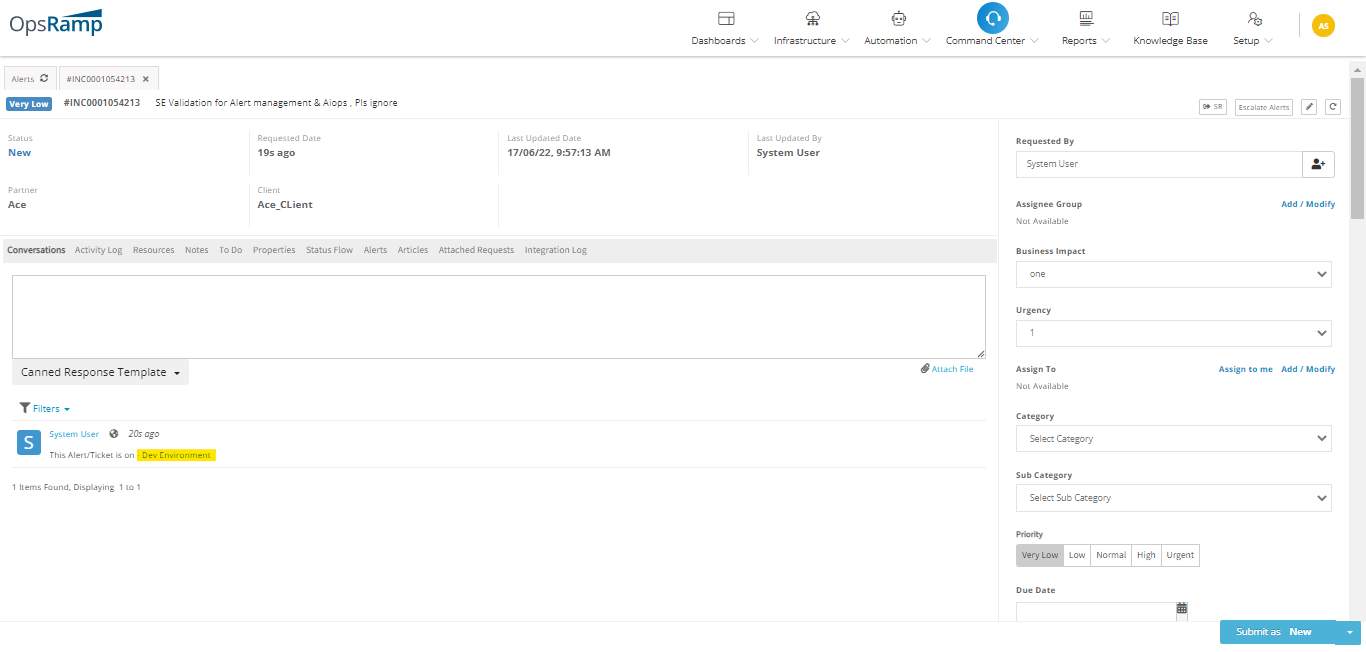
Canned response templates
While creating the incident from the alert manually, customers can use canned response templates to auto populate description in the incident.
Dashboard 2.0 enhancements
Custom attribute support in metric tiles
Custom attributes on your resources can now be used when querying metrics.
Filter metrics based on resource groups and sites
Metrics can now be filtered based on OpsRamp grouping structures (Resource Groups and Sites).
See Create a Metric Tile for more details.
Use Labels instead of numeric values for resource and service availability metrics
For the 2 metrics below, the user has the option to show them as labels instead of their numeric values. The mapping is:
- system_resource_availability_state: This metric tracks the availability of resources and represents the current state with an integer value. 1 = Unknown, 3 = Down, 4 = Up.
- system_service_map_availability_state: This metric tracks the availability of service maps and represents the current state with an integer value. 2 = degraded, 3 = Down, 4 = Up.
Improved RBAC for Dashboard 2.0
Providing role based access for dashboard with three different permission sets.
- Dashboard View-Only
- Dashboard Edit
- Dashboard Access Only
See Permission Sets for more details.
Patch management enhancements
Priority based resource assign for patch configuration
We have added Precedence under view patch configuration. Now, the resources allocation will be done based on the precedence order for dynamic query based configurations.
Least value will get high precedence for resource allocation.
System will recompute the resources automatically for every 4 hours to assign the match criteria or you can recompute on demand.
See Patch Configuration for more details.
Included Gateway device category in automation
We have added Gateway as a device category and now it will be part of script execution.
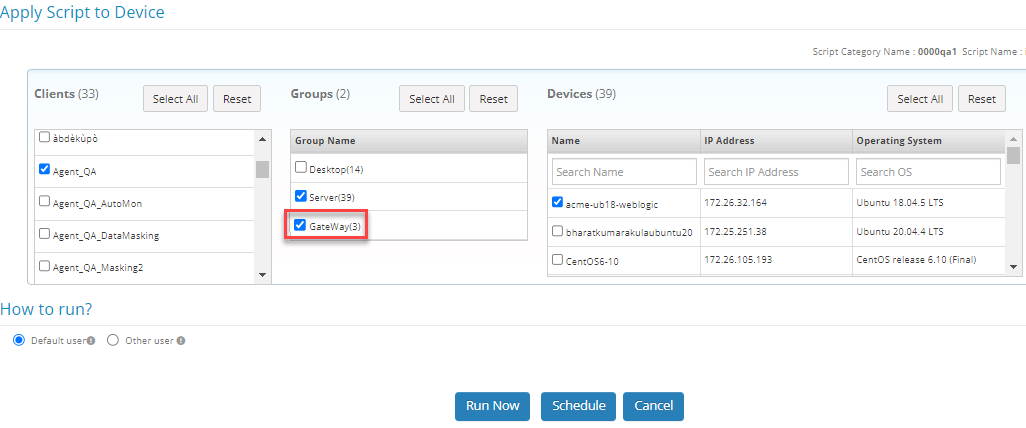
See Create Scripts for more details.
Process automation enhancements
Monitoring and simulation of process definition loops
Now we are enabling following features in the process automation:
- If the process automation fails, there is another option that would “Notify and Cancel” the work for execution.
- A task loop will be provided where we can specify how many times a specific task can be executed.
See Limitations of Process Definition for more details.
Process definition provided an option of execution timeout
If any Process Definition is non-responsive for some time or encounters an error, we can notify the user via email once uses enabling the Notify option during the creation of Process Definition.
Instead of just notifying, we have added other option that is Notify and Cancel. If the user chooses this action, he will receive a notification and the respective process instance will be cancelled.
See Enable Notify Toggle for more details.
API updates
The following are the updates from the API.
New APIs
Additional v2 endpoints:
- Permission Set APIs: Users can automate the user permissions with a new permission set of APIs.
For more details, click here. - Custom Fields APIs: Users can automate the custom fields for tickets using new APIs.
For more details, click here. - Custom Metric APIs: Users can use the new API to automate the creation of custom metrics.
For Create a custom metric APIs, click here.
For Manage a metric APIs, click here.
New v3 endpoints:
- OpsQL APIs: OpsRamp OpsQL functionality is now available via APIs.
For more details, click here. - Installed Apps APIs: Users can automate the discovery and monitoring apps installation and update their configurations via new APIs.
For more details, click here. - Template APIs: Using the new template APIs, users can now manage the template configuration by creating and updating templates.
For more details, click here.
Updated APIs
- User creation APIs: API users can now create users who only receive OpsRamp notifications via the API.
For more details, click here. - Search Remote access Audit logs: The updated payload would have the specifications attributes. The Remote Console report now includes the following additional fields for improved console auditing.
- hostName
- hostIP
- userName
- external IP of the GW handling the request
For more details, click here.
End of Life API endpoints
The following APIs attributes will be deprecated:
- Legacy Metric APIs: The Legacy Metric and Get Metric endpoint has been deprecated from this update. It is recommended to use the new v2 metric APIs to create custom metrics as referred above.
See: API Documentation for more details.
Week of December 16, 2022 (2022_W48)
UI enhancements
Service maps enhancements
The following new filter options has been added to the Service Maps:
- Standalone Services
- Linked Services
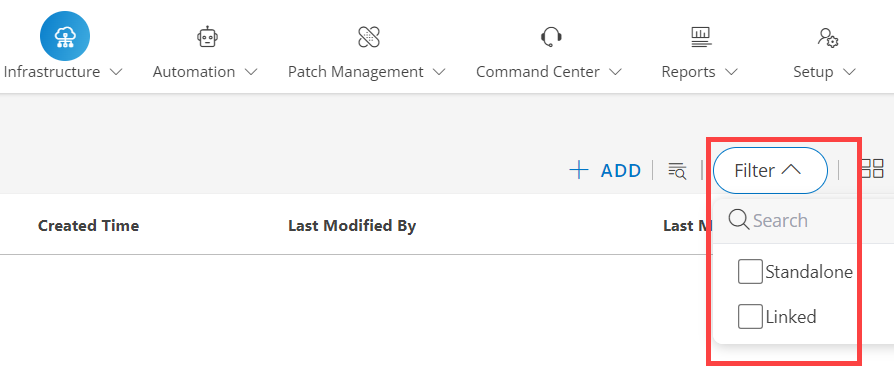
See Filters for more details.
The following options and their count can be now viewed in the Service Maps slide-out screen:
- Alerts
- Incidents
- Resources
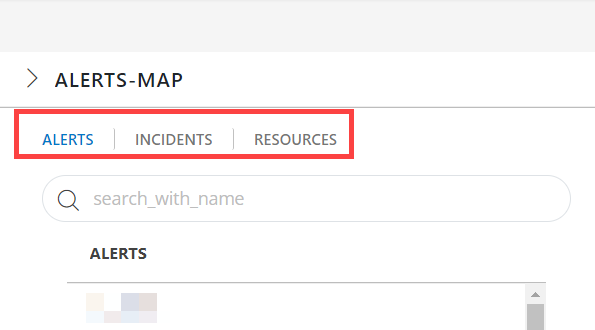
See View Alerts, Incidents, and Resources for more details.
Integration flow update
The sequence of steps for installing integrations in the wizard is changed for the following integrations:
- SDK 2.0 Applications
- SNMP
- SSH
- VMware
- WMI
New sequence
The following is the new sequence to install the configuration:
Step 1 - Configuration
Step 2 - Installation
Status columns
The following options that indicate the state of application and gateway status have been added to the Status column for the below integrations:
- SDK 2.0 Applications
- SNMP
- SSH
- VMware
- WMI
New status columns
- Configured
- Running
- Updating
- Stopped
Core platform enhancements
You can no longer select the Business User as the Account Type option when adding a user at Setup > Accounts > Users.
Update - 12/16/2022: This change has been reverted and the Business User feature will be deprecated in a future release.
Resource management enhancements
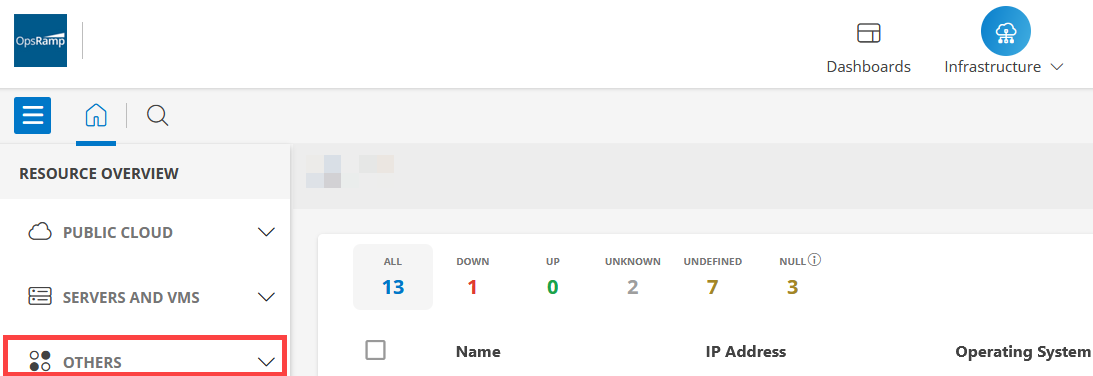
New category in Resource Overview pane
A new category called OTHERS has been added to the RESOURCE OVERVIEW page in the Infrastructure > Resource tab. This category groups resources (by their type) that have not been discovered through an app.
Support for deviceGroups.name
OpsRamp now supports filtering resources by resource group name in the Add Using Query in Device Management Policy.
Cloud monitoring enhancements
Azure firewall support
Opsramp now supports the discovery and monitoring of Firewall resources in Azure.
See Azure Firewall for more details.
Fixed the gap of Aggregation Type between OpsRamp and CloudWatch integration
We are now using the AWS recommended statistics for metrics collection. Previously, OpsRamp was not using the statistics for some of the metrics that AWS recommended to show the graph data. The gap in Aggregation Type between OpsRamp and AWS CloudWatch integration has now been fixed.
Patch management enhancements
A new setting called the AUTO PATCH SCAN is now available to scan the devices under a particular Partner or Client. This setting, if enabled, scans all the devices at a fixed time (12:00 AM UTC) every day. The users no longer have to select the Patch Scan Schedules option to scan the devices individually.
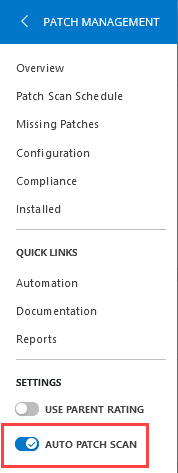
See Auto Patch Scan for more details.
Service management enhancements
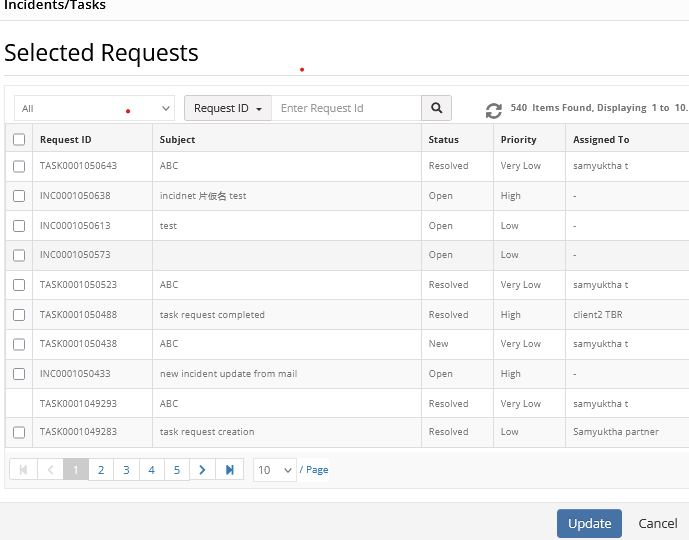
You can now attach the following information while creating a Change Request form:
- Incidents
- Service Requests
- Problem Requests
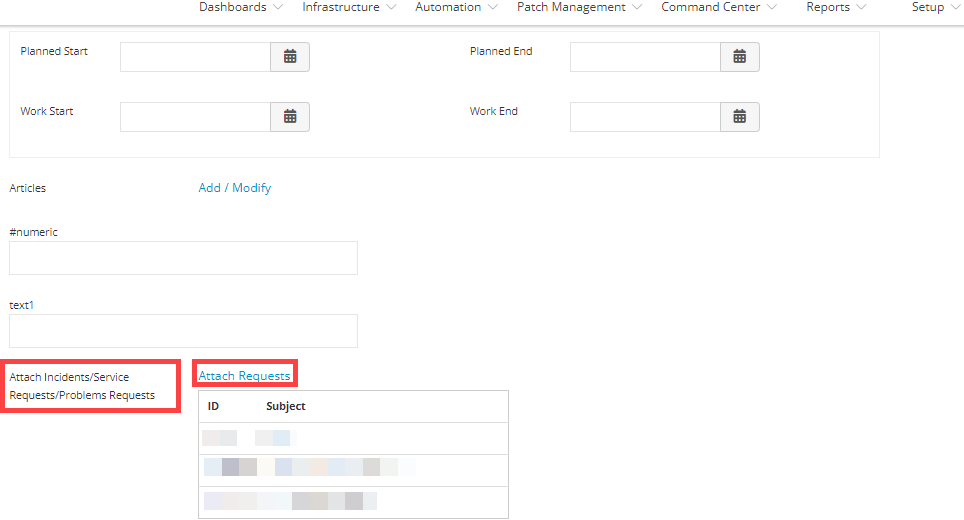
See Create a change request with Service Desk for more details.
Week of November 20, 2022 (2022_W44)
UI enhancements
Changes to the top level navigation
The following changes have been made to the top navigation structure:
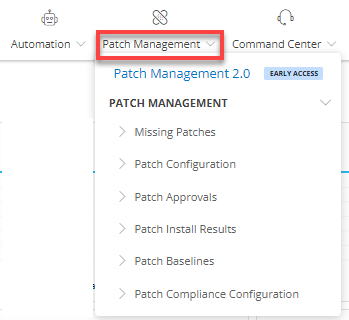
- Patch Management is now available on the top level menu. Earlier, it was under the Automation tab. The Patch Management menu now allows you to navigate to both the Classic Patch Management and the Patch Management 2.0.
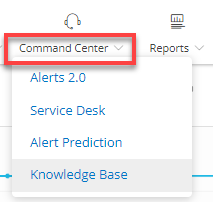
- The Knowledge Base tab has been relocated from the top level navigation to the Command Center menu. You can now access the Knowledge Base tab by navigating to Command Center > Knowledge Base.
Service maps list view and other UI improvements
The new service map UI enhances the usability to view the details of service maps at a glance. With the new service map detailed view toggle button, the users can:
- View all your services maps in the list view.
- Provides visibility of the users who created and modified the maps.
- Import and export the maps from the APIs and the UI.
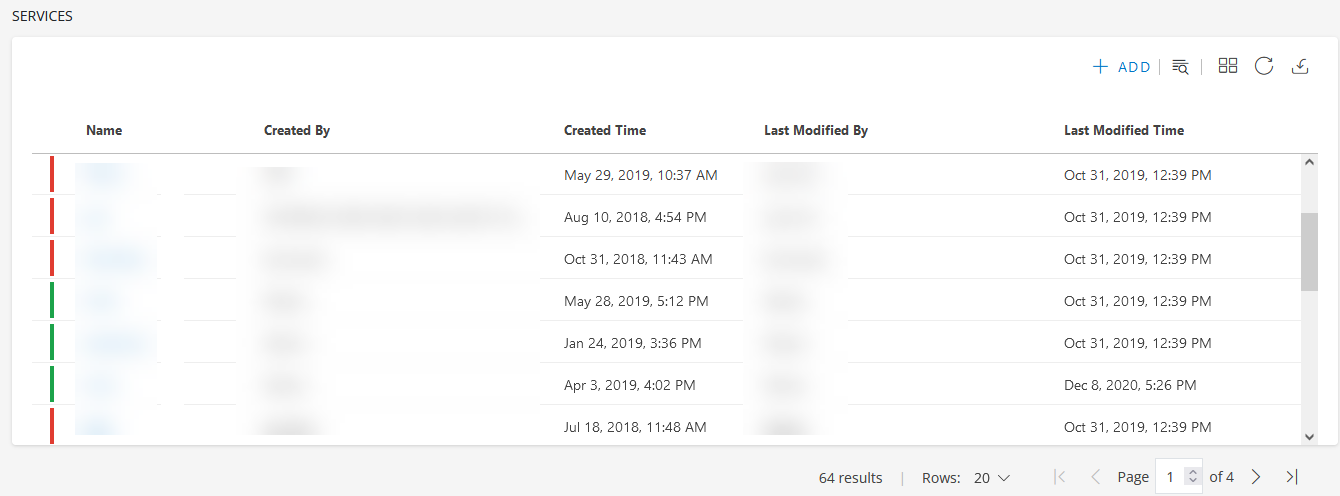
See: Service Maps for more details.
Default Password Policies
- The number of password attempts have been updated to three from six. The Tenants can still customize the number of password attempts in the password policies section.
- The password - Two-Factor authentication needs to be entered correctly; otherwise, the user will be locked out after three unsuccessful attempts.
- The Captcha will appear after one wrong attempt of login credentials.
See: Password reset for more details.
Resource management enhancements
Support Website URL in Custom Attribute
You can now add a website URL, prefixed either with http or https as a custom attribute. When you click the website URL, it will redirect you to the specific website in a new tab.
See: Custom Attributes for more details.
Availability rule (ANY) option calculation corrected
The following enhancements in availability calculation for ANY condition are now available:
Resource availability is calculated on two conditions:
- First Condition: The resource is UP, if ALL availability monitors are OK. Otherwise, it is Down.
- Second Condition: The resource is UP, if ANY availability monitor is OK. Otherwise, it is Down.
For the second condition, OpsRamp considers the resource as UNKNOWN, if any of the Availability metric data samples are not available, even though the other Availability metrics are OK on the resource.
From now on, the resource will be considered UP, if at least one of the Availability metrics is OK.
Integration Framework enhancements
VMware, Nutanix, NetApp Cluster, CiscoUcs, and Xenserver Integrations to new UI form model
UI changes have been made to VMware, Nutanix, NetApp Cluster, Cisco UCS and Xenserver Integrations install flow.
See:
- VMware
- Nutanix
- Netapp Cluster
- Cisco UCS
- Xenserver for more details.
Cloud monitoring enhancements
SaaS applications templates creation
Monitoring Templates are available for resources discovered by SaaS Applications.
- Customize the thresholds, alert, and availability settings on the monitoring template itself.
- Apply these resources as resources discovered through any other integrations in OpsRamp.
OpsRamp is now using the AWS recommended statistics for metric collection
Previously, OpsRamp was not using the recommended statistics to display the graph data for AWS metrics. However, the gap in the Aggregation Type between OpsRamp and AWS CloudWatch integration is now fixed.
Alert management enhancements
Enrich and Create Alert feature for Webhook alert integration
Under Process Definitions > Service Task > Platform Service Tasks, a new field Alert Source is added.
This will help when you enter a value in Alert Source field to create a Process Definition and if the given value is an invalid source, then an alert is created with the default source value as OpsRamp.
See: Platform service tasks for more details.
Roster based alert escalation management
You can now assign a roster to an assignee group in the escalation policy. While creating the ticket based on the shift defined in the roster, the corresponding assignee group will be assigned to the Incident.
See: Alert Escalation for more details.
Option to update the incident with repeat alerts
An option has now been added to update incidents for every repeat alert in the escalation policies.
See: Create an Alert Escalation Policy for more details.
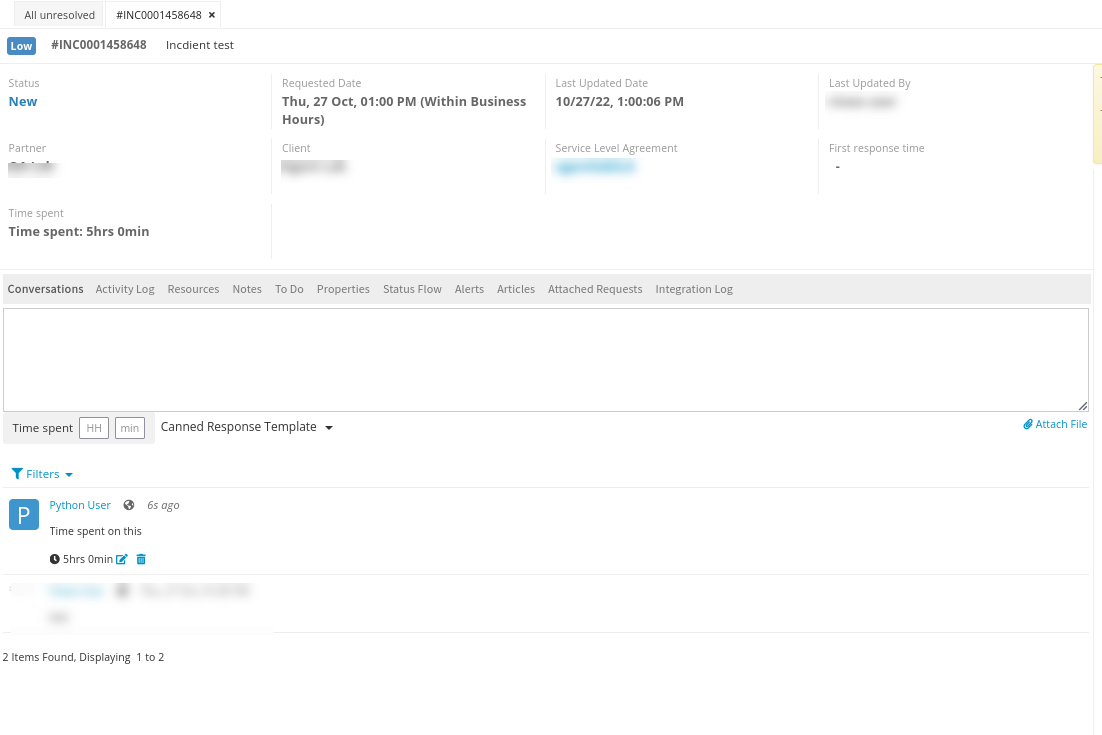
Record of Time Spent on ticket
A new Time Spent (field) on an incident has been introduced where the user/client can view the time spent on an incident.
Monitoring Management enhancements
Integration failure events error messages
The alert description for integration failure events now includes a timestamp and an error message.
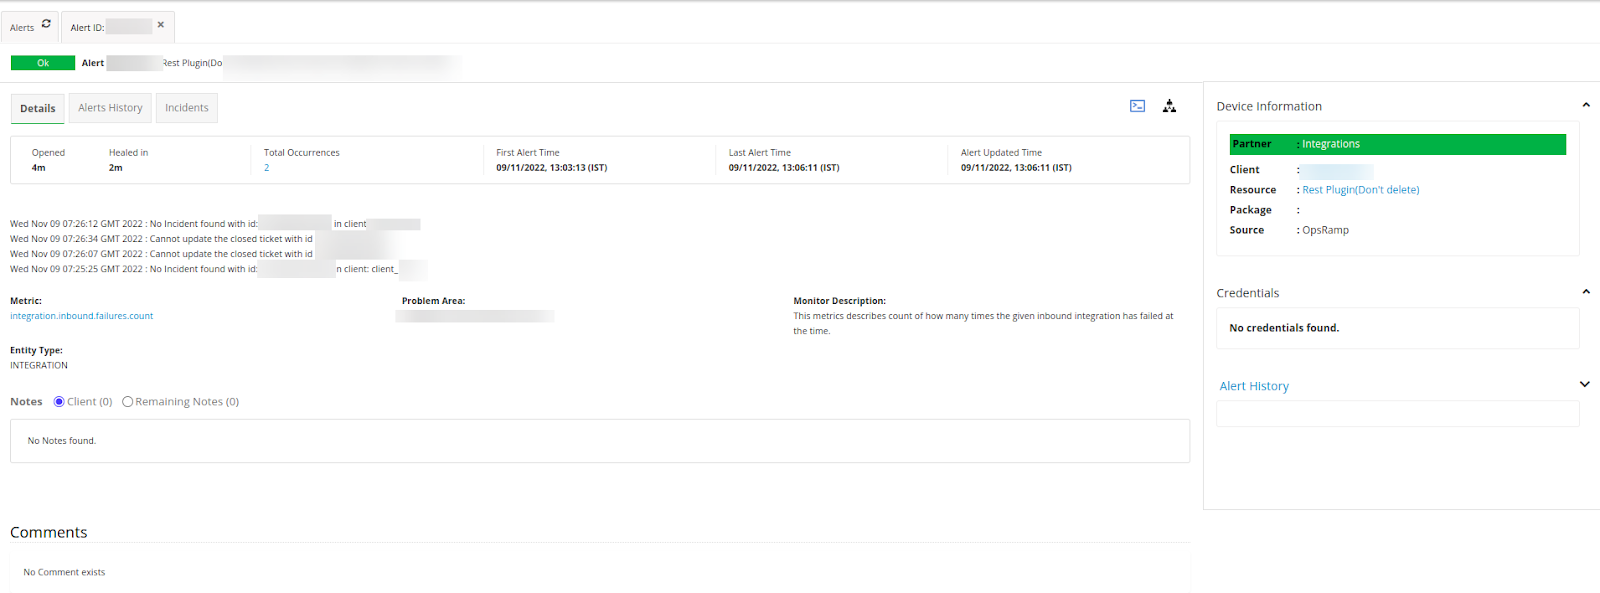
See: Monitoring Integration Failures for more details.
Patch Management enhancements
Enhancements in missing patches
The missing patches are now available with the resources view along with the OpsQL query support.
You can now view the missing patches using the following filters:
- BY PATCH
- BY DEVICE
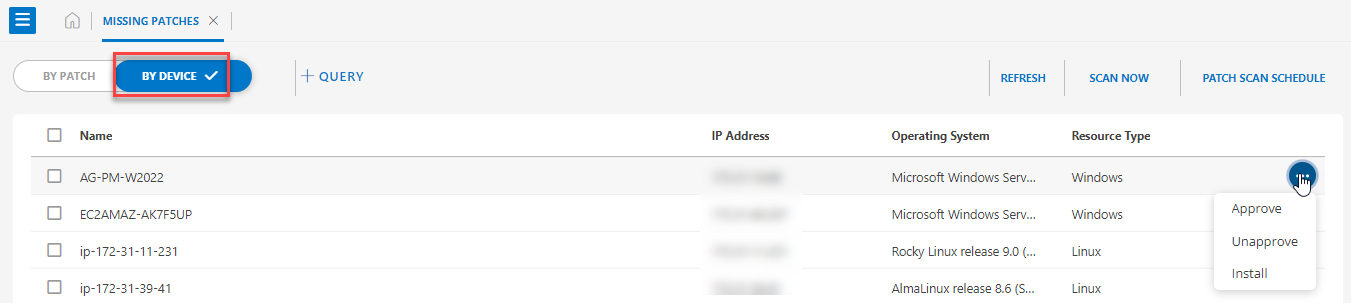
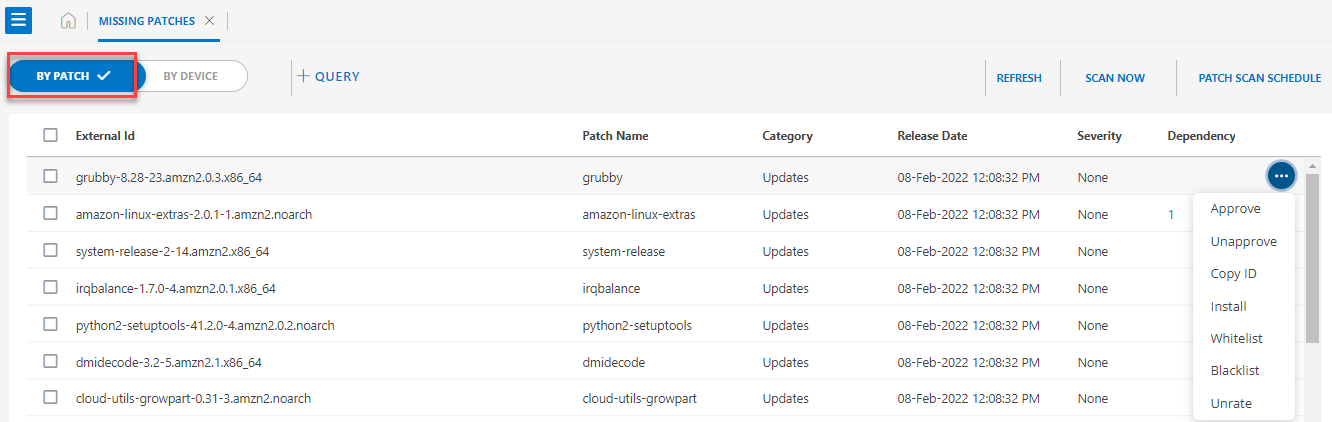
See: Missing Patches for more details.
Partner Level Changes
All the Patch Management 2.0 capabilities are now enabled at the partner level.
See:
- Patch Scan Schedule
- Patch Configurations
- Patch Compliance for more details.
Patch progress information
Users can now view the patch progress along with the status, at the patch configuration level. You can now see the current status of a resource patch installation, such as whether it has started, completed, failed, and so on.
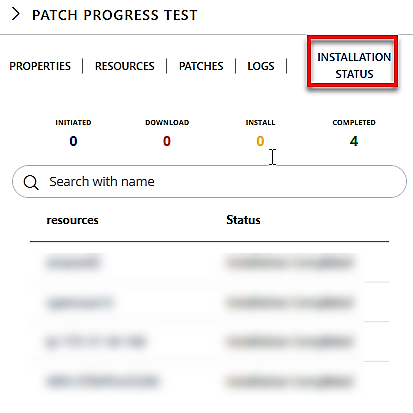
See: Patch Configurations for more details.
Exports enhancements
Metric batch export
Metric batch export changes have been enhanced such that:
- After the schedule creation, for the first upload to Cloud storage:
- The Metric batch export files will contain the metric values starting from the schedule creation time only.
- The files will not contain the complete hour details or previous hour metric details.
- The following is a sample file format of the schedule batch export and can be explained as follows:
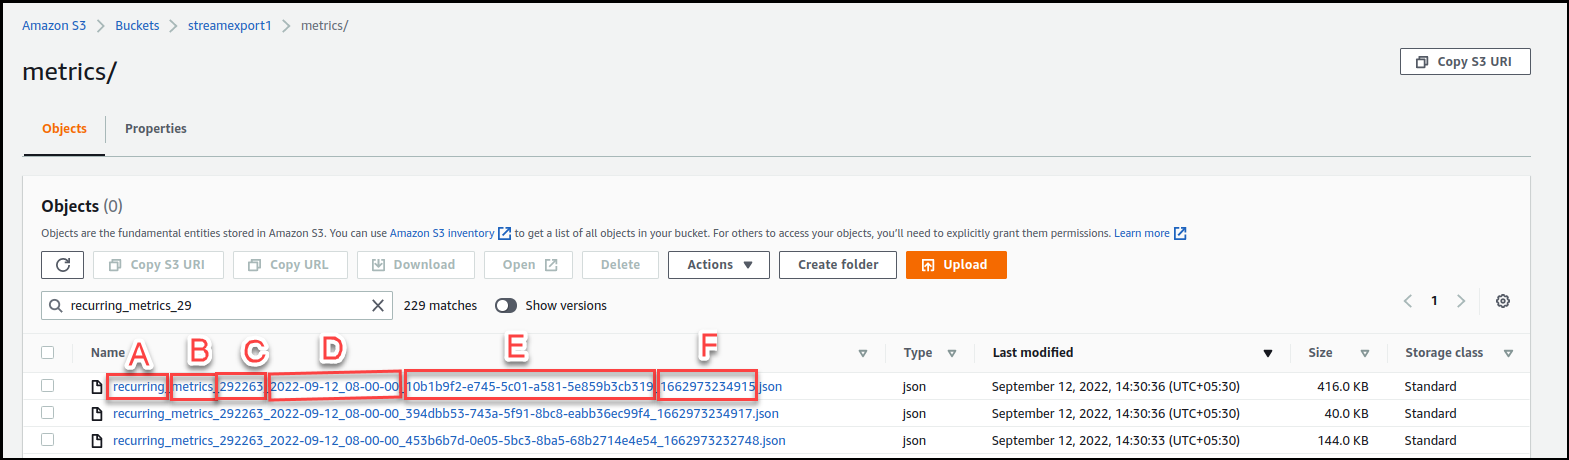
- (A) schedule of batch export, recurring or on-demand
- (B) batch export type
- (C) unique client ID
- (D) schedule starting timestamp
- (E) unique ID of the file
- (F) unique timestamp of the file
See: View batch exports on AWS S3 for more details.
Configuration to enable metric streaming
OpsRamp now provides the CloudWatch Metric Streams, a cost optimization solution. This solution cuts down the cost incurred due to the AWS monitoring via OpsRamp using the Cloudwatch API calls.
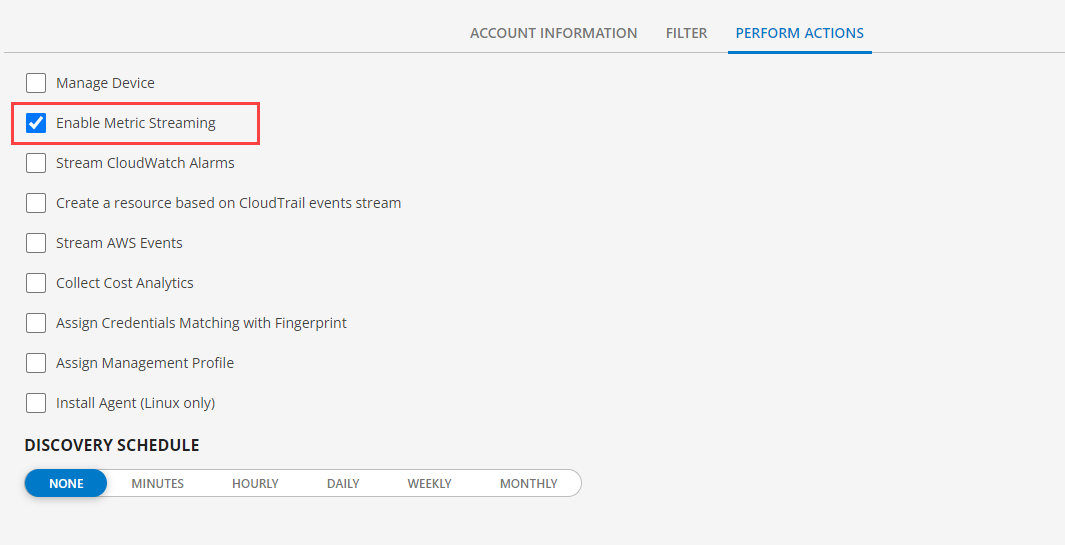
See: AWS Metric Streaming Configuration for more details.
Batch export Integrations configuration data
The users can now perform a batch export to their installed integrations for configuration data.
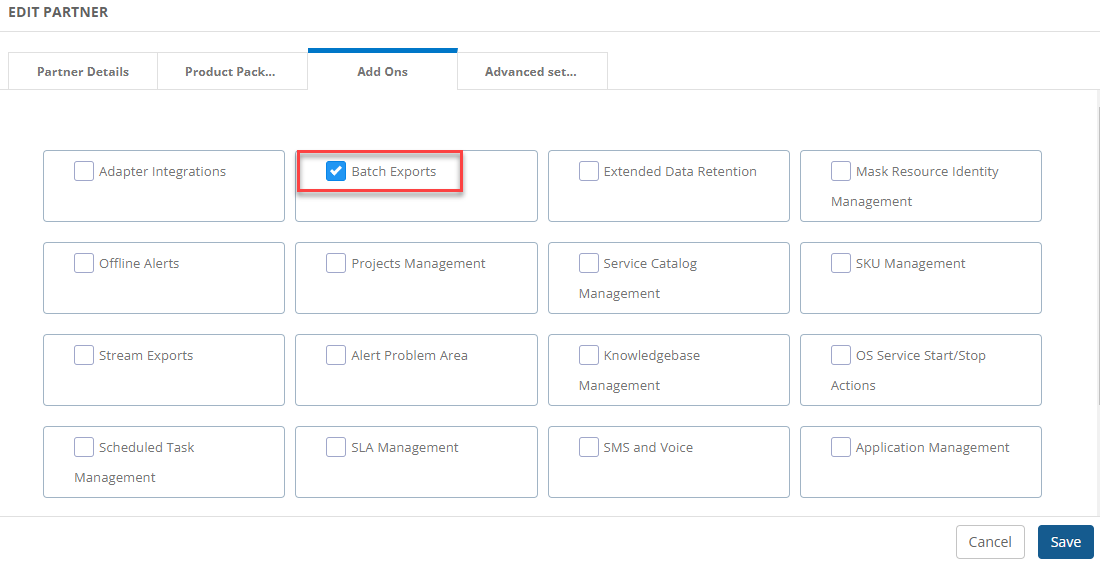
See: Setup Batch Export for more details.
Batch export to Dell ECS
The batch exports can now be enabled for any S3 compatible cloud storage.
Note: Dell ECS is a S3 compatible cloud storage.
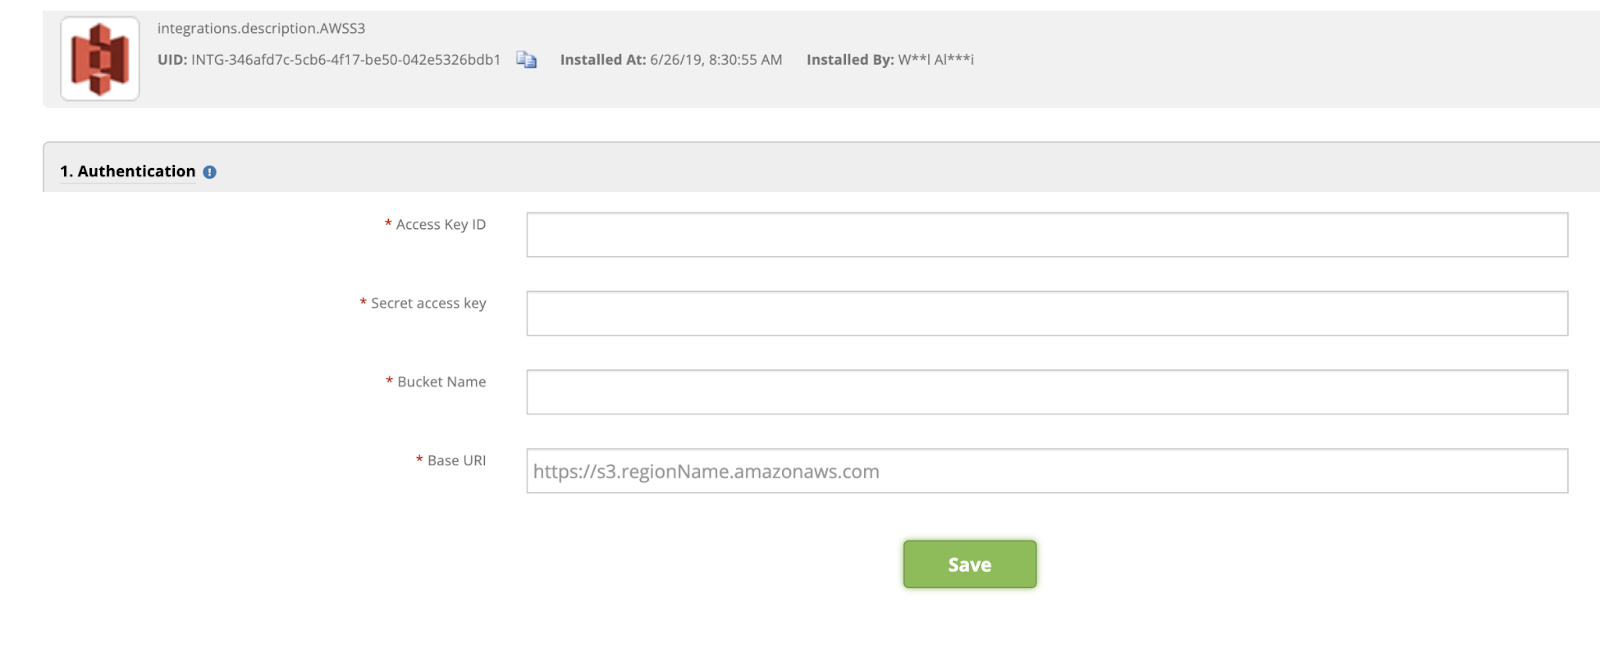
See: AWS S3 and Setup Batch Export for details
Service Management enhancements
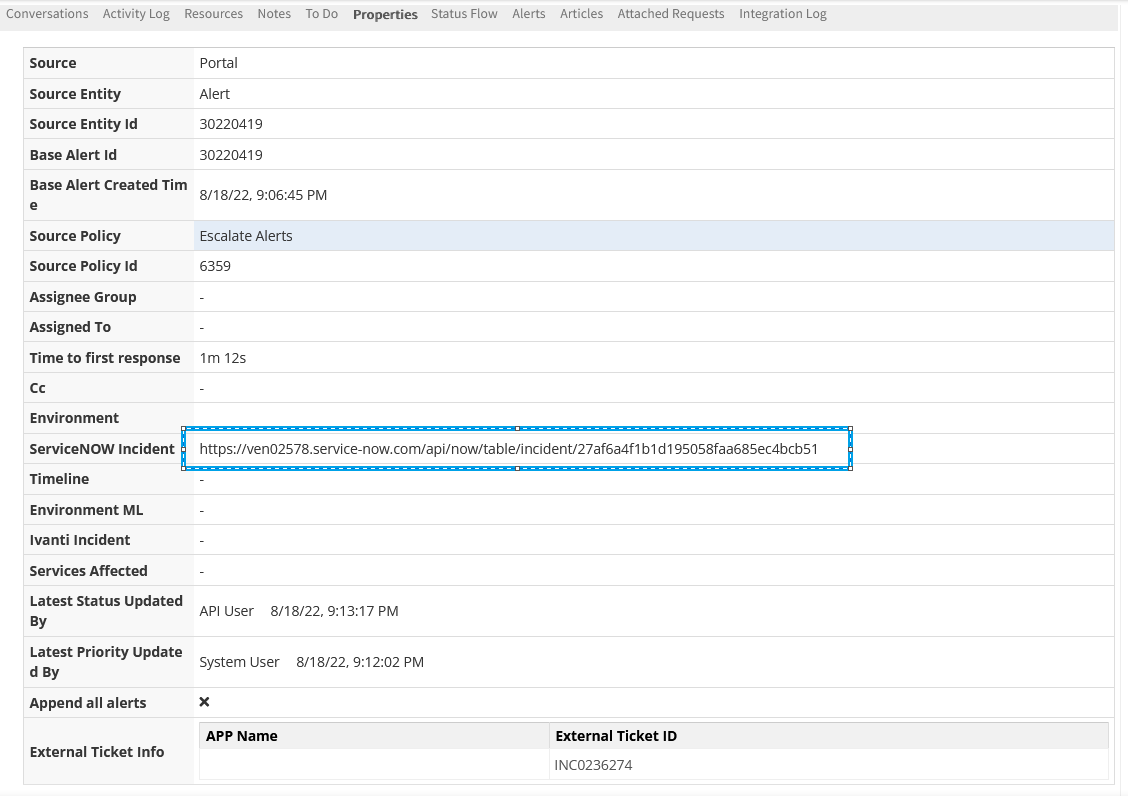
Support Website URL of ITSM ticket in OpsRamp Incident Properties
- The support website URL of the ITSM ticket is now provided as a hyperlink in the OpsRamp Incident Properties section. Earlier, it was displayed as a plain text instead of a clickable link.
- Users can access the third party tickets (for example, ServiceNow) using the hyperlink provided in the External Ticket Info under the Properties section.
API updates
New APIs
Service maps APIs
Users can now import and get the details of a Service Map as JSON payloads using APIs.
Service Maps as JSON Payload
The user can now get an existing service map (root node and its child nodes) using the API. The detailed service map format is captured as a response JSON payload.
Importing a Service Map
The user can now import to update or import the existing service map (root node and its child nodes) using the API.
The user needs to provide the captured JSON payload of the existing service map. Users can only use the existing service map in the prescribed schema as a payload to create a service map into another tenant or update itself.
Note
Users cannot create a new service map using this prescribed payload.Updated APIs
- The old attribute of New Escalation API has been updated with new attributes.
| Old Attribute | New Attribute |
|---|---|
| `updateWhenAlertStateChange` | `none` |
| `autoResolveIncident` | `withAlertState` |
See: Create Alert Escalation Policy for more details.
User lock status is now available in user search and GET endpoint by the attribute ‘locked’.
locked: true/false.See: Search Tenant Users for more details.
Alert escalation supports category and subCategory attributes related to incident.
See: Create Alert Escalation Policy for more details.
End of Life Attributes
The following attributes in the Alert Escalation APIs will be deprecated:
- withAlertState
- none
Week of October 10, 2022 (2022_W40)
UI enhancements
Query builder updated to include the basic option
In the Infrastructure Search page (Infrastructure 2.0) and the Alerts listing page (Alerts 2.0), the basic query builder has been introduced to build queries. This eliminates the need to know a query language to search for resources.
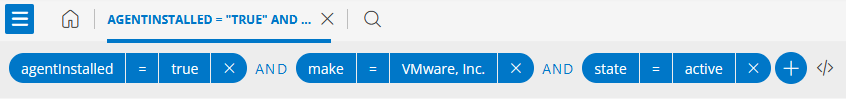
For more information, click here.
Resource Metrics page improvements
A new pagination has been added in the Metrics page to limit the number of metrics shown in a single page. Also, performance has been enhanced by reducing the loading time and providing visibility to metrics.
Resource management enhancements
Filter resources with integration configuration
The new Resource Overview page now lets you filter the resources by the application configurations.
For more information, click here.
Topology map shows broken link status
Topology map now supports to show the broken links information along with availability status (up/down).For all monitored links, the discovered link status will be updated at the monitoring time as needed.
Below are the possible scenarios for the broken link status:
Link detected as broken at discovery time will be updated at monitoring time if it becomes Up.Limitation: If a link is monitored in OpsRamp and if there are no alerts on the monitor, then it will still show as “Up”.
Link detected as broken at discovery time will be updated at monitoring time, if it becomes Administratively Down.
The broken link is not corrected during monitoring time when monitoring is not enabled.
See Link Status on Topology Map for more details.
Integration Framework enhancements
Introduced SNMP, SSH, WMI in Integration section
The integrations have been enhanced to include SNMP, SSH and WMI discovery profiles. You can find the existing SNMP, SSH and WMI discovery profiles in the “Discovery and Deployment” section.
Effective January 2023, the SNMP, SSH and WMI discovery profiles will be deprecated from the “Discovery and Deployment” section. See Deprecation Notices for more details.


See SNMP Discovery, Linux OS Agentless Discovery, and WMI Discovery for more details.
Encoded strings within Process Definitions
A functionality has been provided for URL encoding in order to escape offending strings such as <, >, ‘, …. To do this, Escape Xml Char function feature is provided on the Add Integration Event page within the Functions category.
Cloud monitoring enhancements
Additional Metric support added for Zoom Room health
OpsRamp now supports Zoom Room discovery and monitoring as a part of Zoom integration.
See Zoom for more details.
Apigee Edge discovery and monitoring
OpsRamp now supports the Apigee Edge application. Also, provides the support for Organization, Environment, and API proxies as part of the discovery and monitoring of Apigee Edge integration.
See Google Apigee Edge for more details.
Store Kubernetes labels
The Kubernetes Node labels are captured and stored into OpsRamp as custom attributes.
Monitoring Management enhancements
User selected encoding type in Windows service configuration
The Windows service configuration introduced two encoding types UTF-8 and Shift-JIS, in order to avoid service names having junk characters.
Process Automation enhancements
Deprecated decision table
The Decision table and all the corresponding references have been deprecated and are no longer available.
Bulk delete failed Process Instances
Users can now delete the pending Process Instances with the bulk delete option available in the Process Definition page.
API updates
API to configure SNMP Trap settings
The Simple Network Management Protocol (SNMP) profile APIs are now available at client level to create, update, and delete profiles to filter the Trap OIDs. You can also reconfigure the SNMP monitoring of the required resources and its interfaces.
Week of September 12, 2022 (13.0_2022_W36)
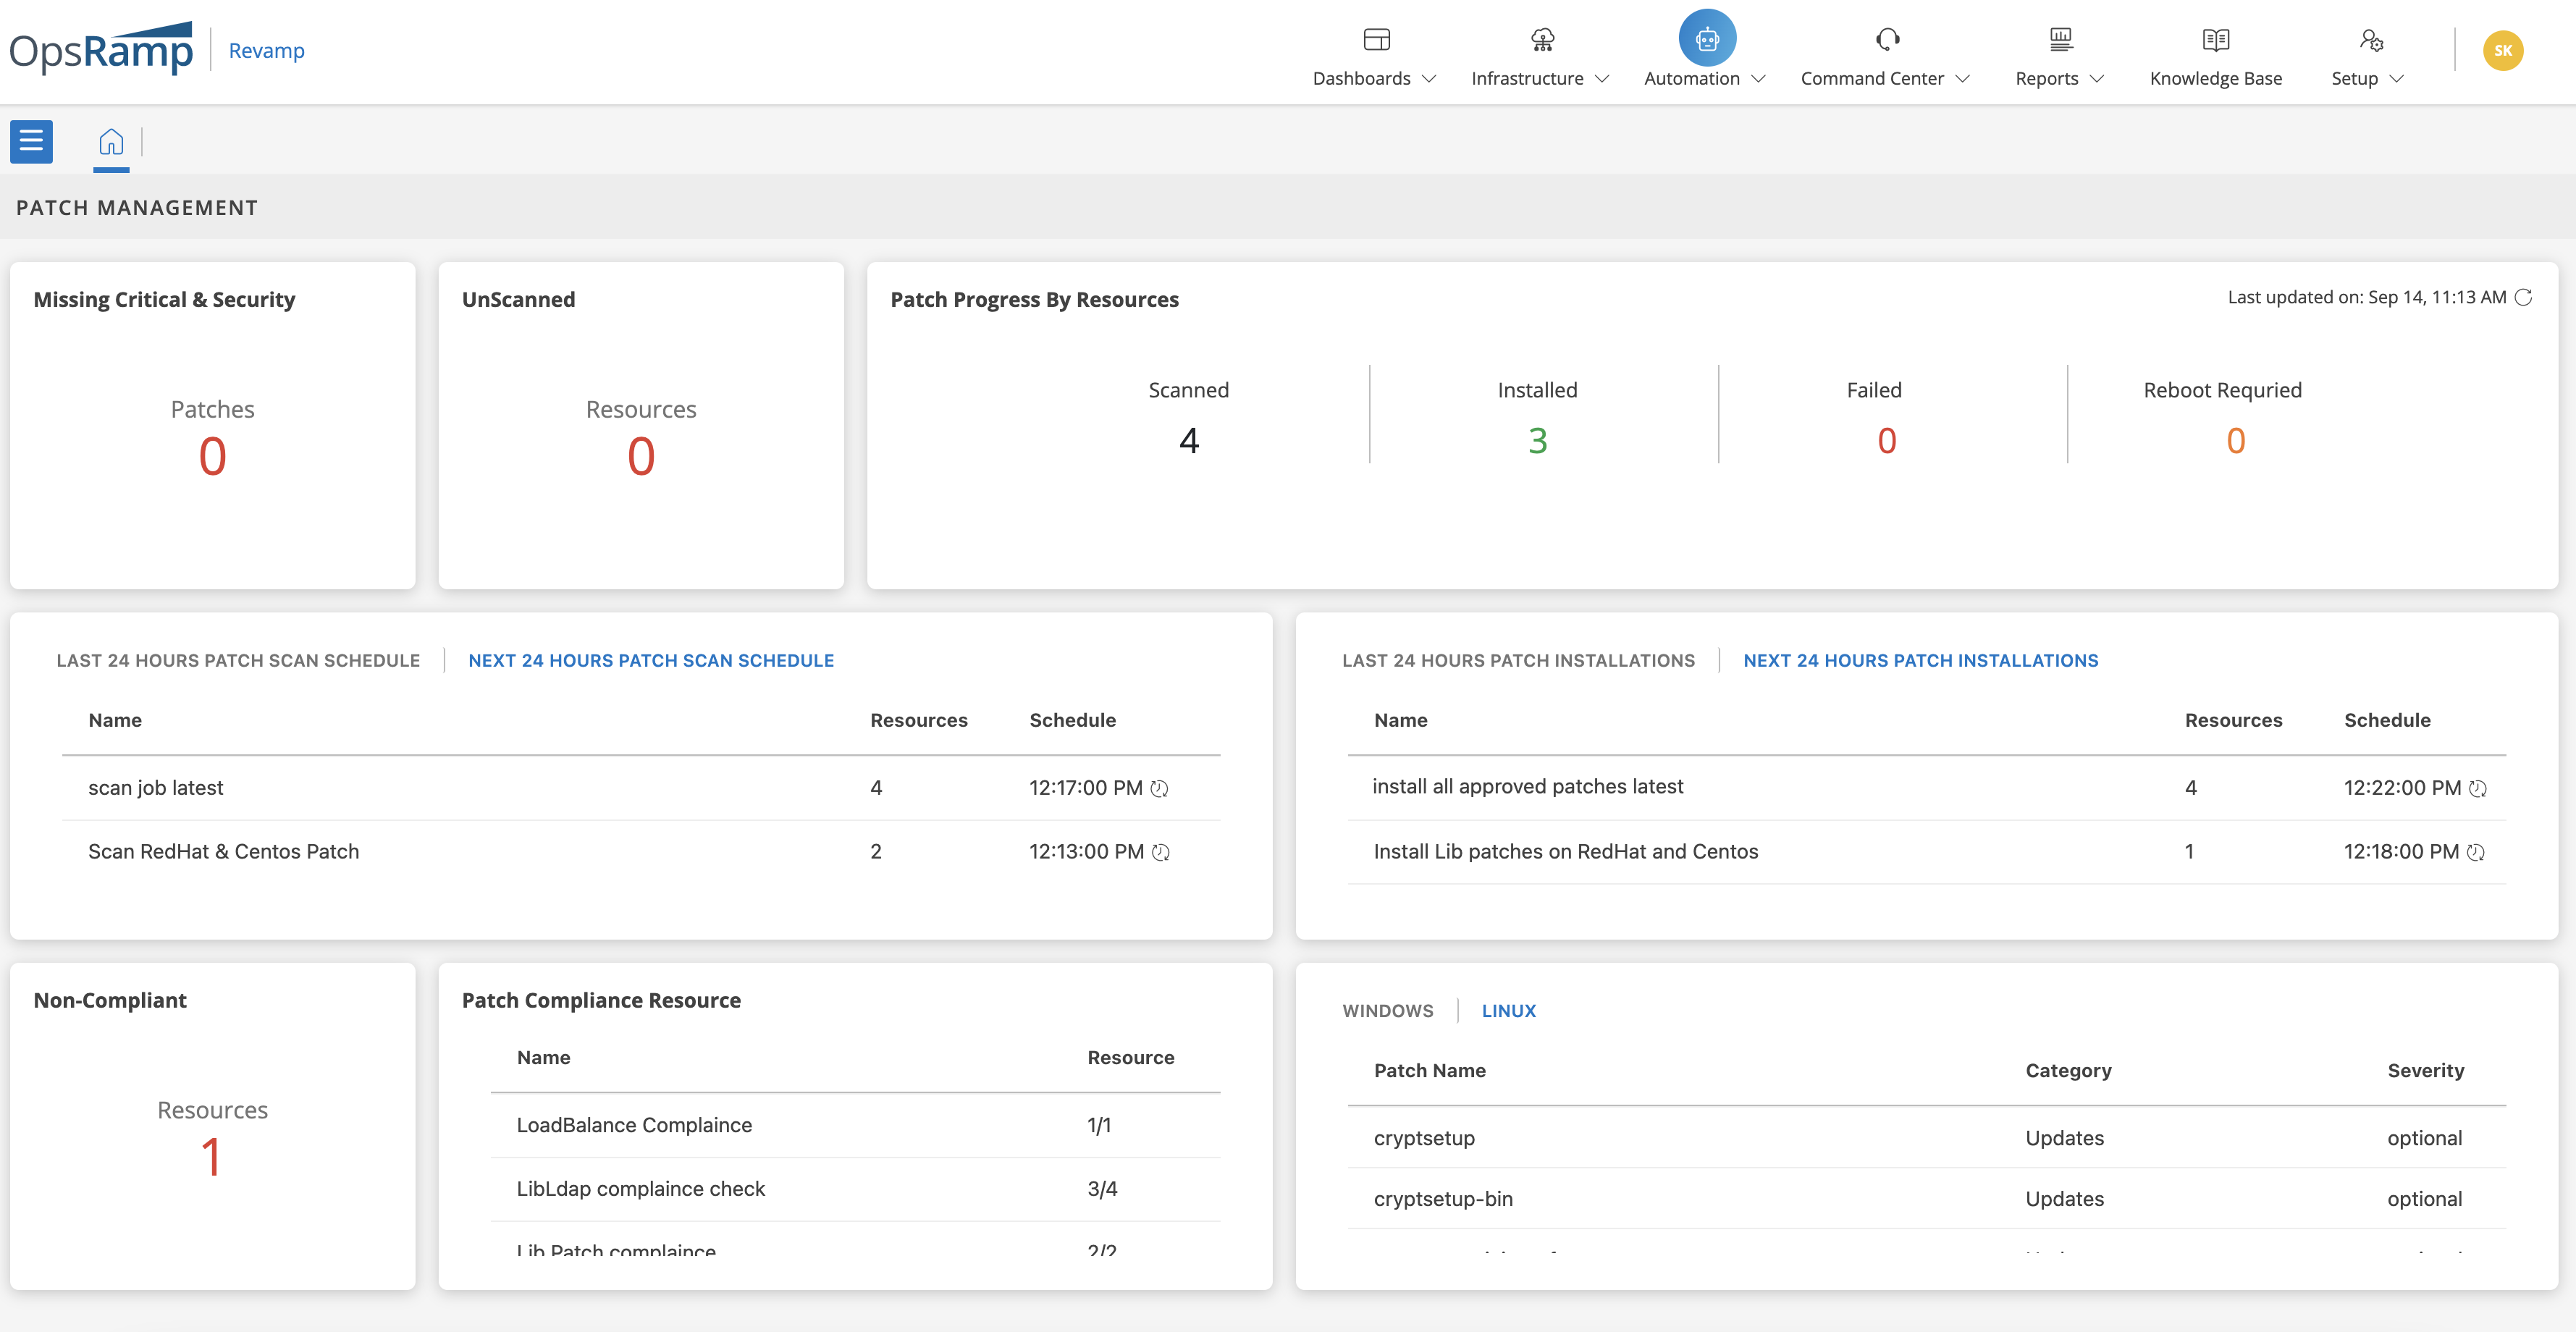
Patch Management 2.0 (Early Access)
Why are we doing this?
Our Patch Management module is a flexible, yet strong capability provided as a part of Automation solution on the platform. Based on our customer inputs, we are enhancing the Usability, Visibility and Scalability of the existing Patch Management with the 2.0 release.
What’s going to change?
The entire Patch Management module under Automation section, going to get a new, enhanced UI with few enhanced functionalities. But the Patch activity concept and capability remains the same. This would be the first enhancements release with more pipelined Patch capability enhancements.
Major enhancements:
- Advanced and Dynamic patching capabilities with simple and strong OpsQL.
- One stop solution added for Patching related configurations.
- Patch Overview Status page and New UI.
- Enhanced Scheduling and Installation options.
To explore the features of Patch Management 2.0, navigate to Automation > Patch Management 2.0 in the OpsRamp portal.
The following table demonstrates the differences between existing Patch Management and Patch Management 2.0 in order to understand the major enhancements in terms of all features.
| Features | Patch Management | Patch Management 2.0 |
|---|---|---|
| Patch Overview Page | Not available | Added an Overview page which contains pre-built widgets to provide status details and easy access to patch configuration creation. |
| Patch Scan Schedule |
|
|
| Missing Patches |
|
|
| Patch Configuration |
|
|
| Patch Compliance |
|
|
| Quick Links Option | Not Available | On the Patch Management 2.0 UI page, added quick links to Automation, Documentation, and Reports so that users can access related information from the same page. |
Early access to Patch Management 2.0
Patch Management 2.0 is available for the selected customers with the “Early Access” label. The Early Access label indicates that there are no known limitations and that the product is fully functional. Patch Management 2.0 features are available for use and exploration for all users. However, because we are not fully prepared for support, we will not be able to give full support at the moment.
Note
Patch Management 2.0 features would be compatible with OpsRamp Agent version 13.0.0 and above. Some of the 2.0 features would not be compatible with the older agent versions.See Patch Management 2.0 for more details.
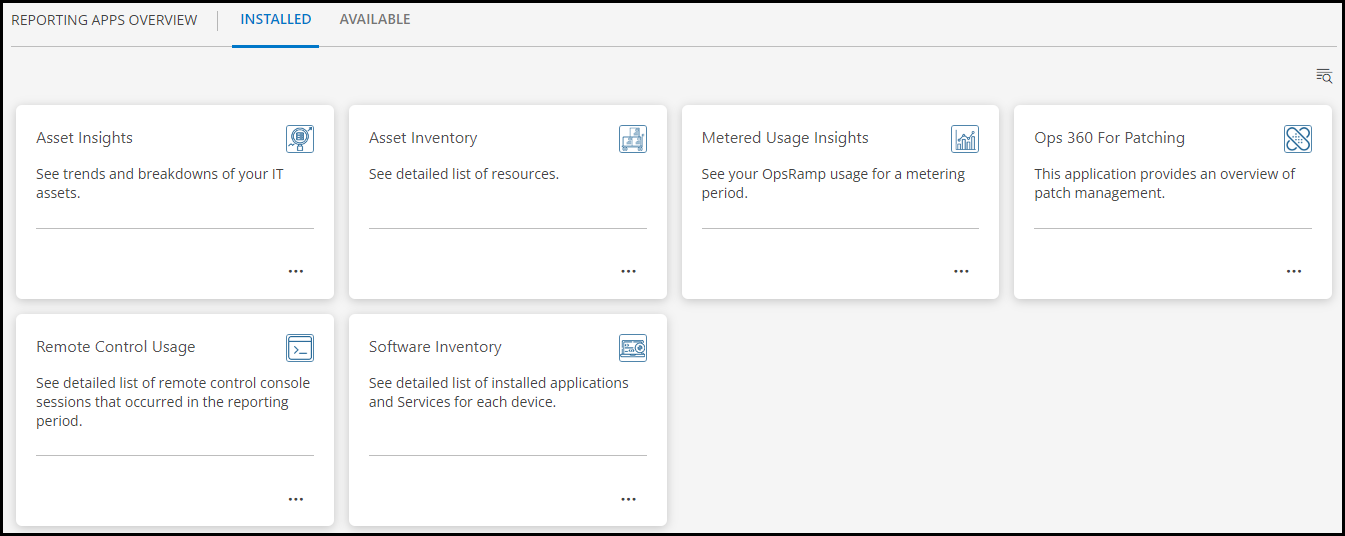
Reporting Apps (Early Access)
Reporting Apps are the next-generation custom report framework. It has the same purpose as a custom report, but it offers more flexibility. Users can see the “Reporting Apps” feature under the Reports tab. The following applications are currently listed under the Reporting Apps:
- Asset Insights
- Metered usage Insights
- Software Inventory
- Asset Inventory
- Remote Control Usage
- OPS 360 for Patching
The following are the key features of Reporting Apps:
- Reporting Apps give users the ability to run analytics on their IT environment.
- Users can see a breakdown of their IT assets by resource type and a server distribution based on utilization.
- Reports from Analytics: Apps are now available in PDF and XLSX formats.
- When installed, you can perform one or more analysis on each app and perform one or more analysis. That means one or more runs are associated with that analysis.
- Each analysis can apply a set of parameters and analyze the data.
Early access to Reporting Apps
Reporting Apps is available for the selected customers with the “Early Access” label. The Early Access label indicates that there are no known limitations and that the product is fully functional. Reporting Apps features are available for use and exploration for all users. However, because we are not fully prepared for support, we will not be able to give full support at the moment.
Core platform enhancements
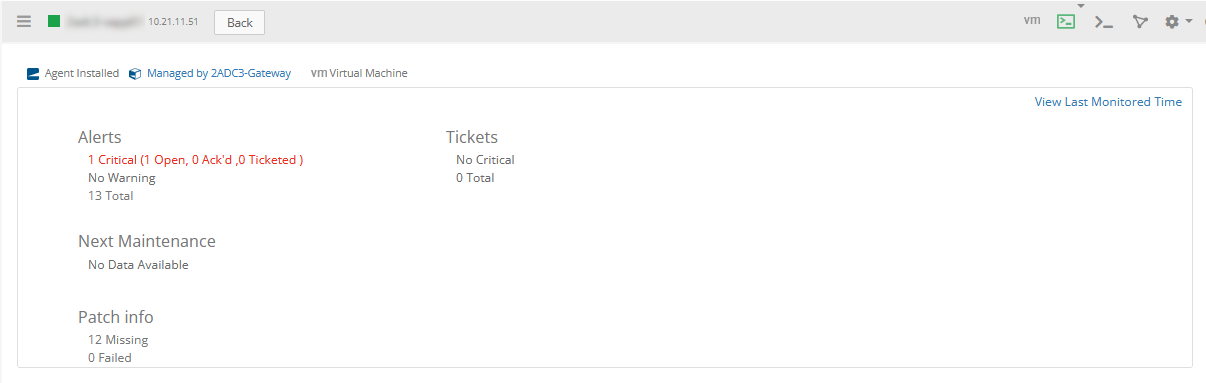
Included resources link in the gateway offline alert
It has been identified that if any resource goes to an unknown state, users are not notified. So now, we made improvements to identify which resources are affected when a gateway goes offline.
As part of the existing gateway offline alert, a link will be provided to the user in the alert. When you click the link, it will show all the gateway-managed resources that will be impacted. This will help in identifying the resources with UNKNOWN state managed by a gateway.
UI enhancements
Infrastructure Search
The Infrastructure Search for public cloud resources will show a higher count compared to the classic UI, and this is expected by definition.
Examples:
Classic UI does not show the nodes of a cluster in the top-level view. They are only shown under the cluster. In the Infrastructure Search, by definition, it is included in the total count.
EventBridge Bus -> EventBridge Rules
The Rules in the Infrastructure Search are shown under the category, whereas the Rules in the classic UI are shown under the respective Bus.
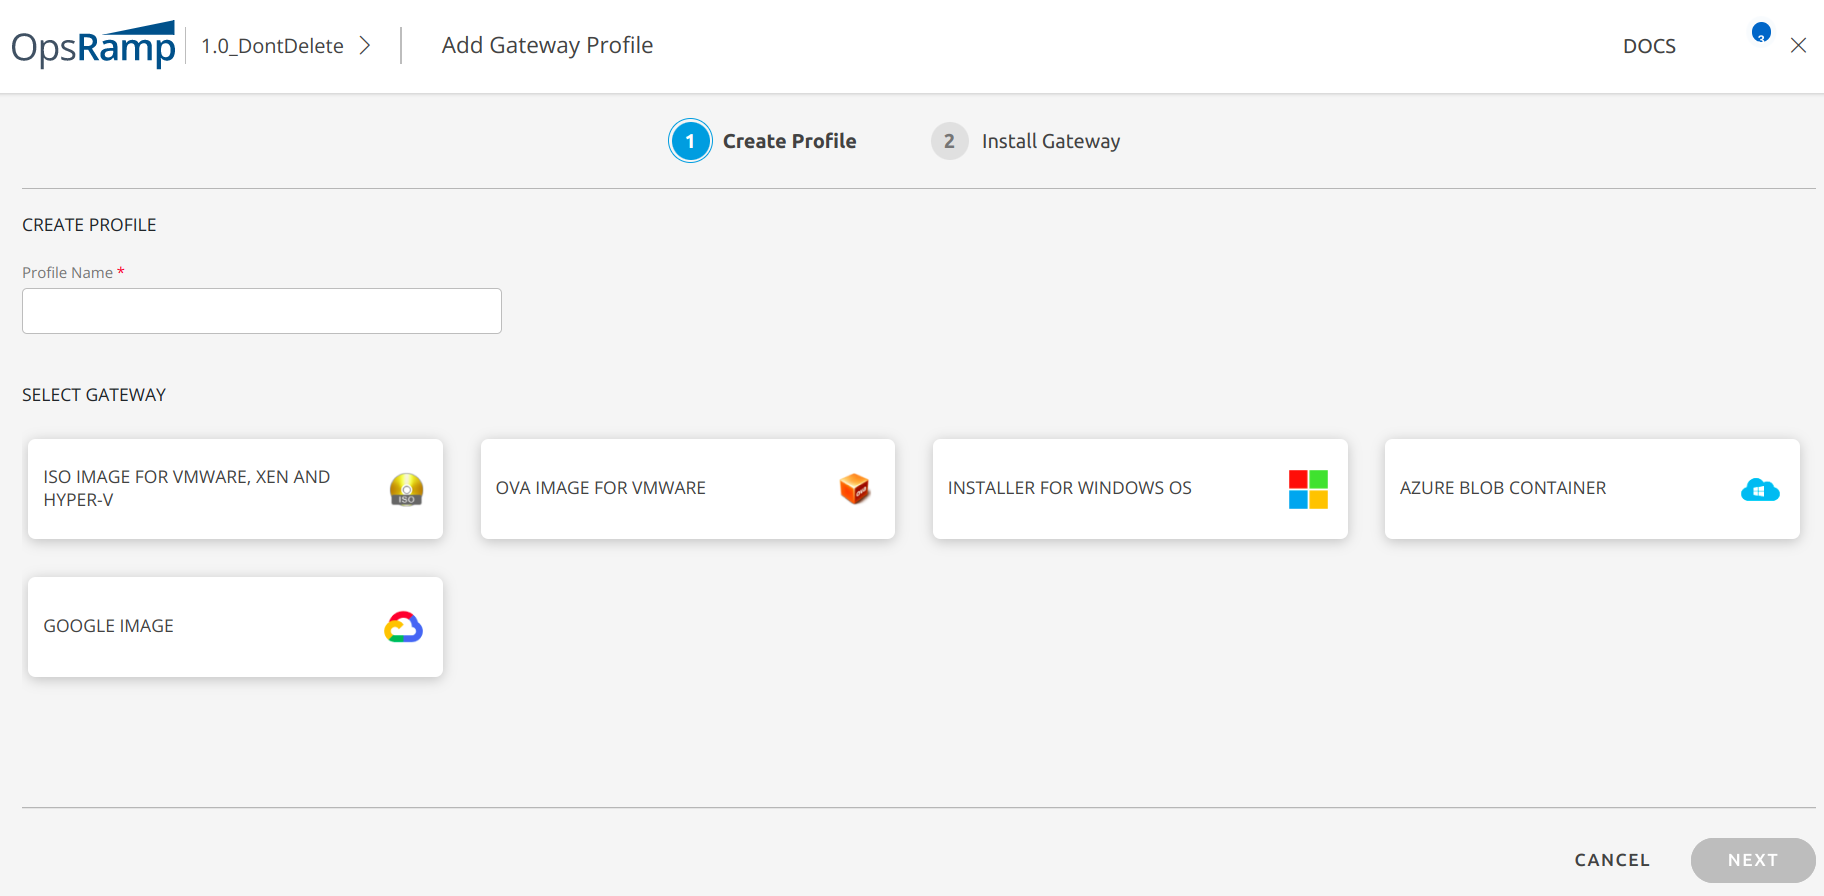
Single flow installation
The single flow is used to install OpsRamp Gateway applications in various IT environments, whether it is an independent installation or part of an SDK installation. Streamlined the user interface flow to install the OpsRamp Gateway application. The user will be able to install any flavor of the Gateway by following the installation instructions.
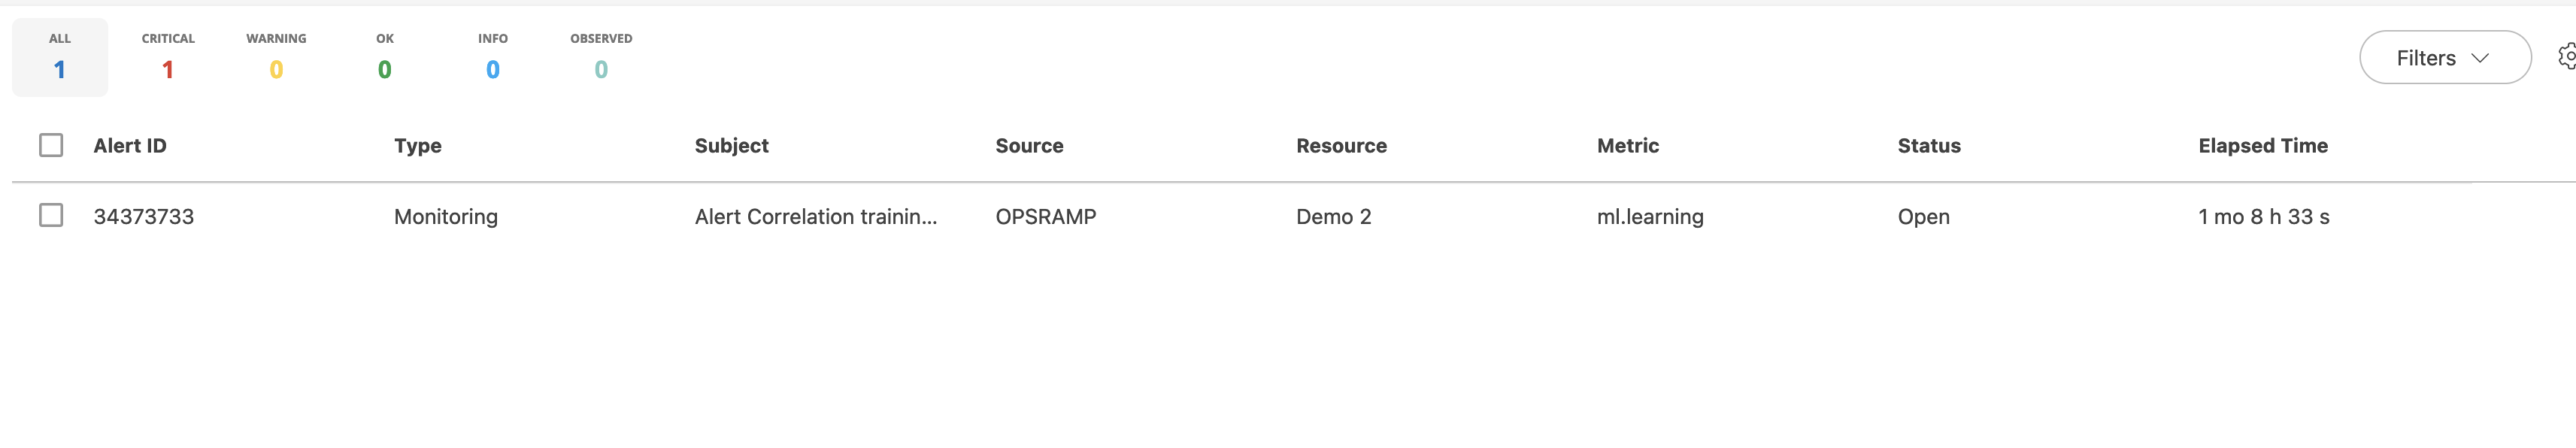
Alert browser
The new alert browser now includes a column to show Elapsed Time, it helps users to know from how long the alert has been active.
Inference and correlated alert indicator
Support for “De-Correlate” alerts is now available on the new Alerts browser. The indicators for inference and correlated alerts are available now.
New user interface for managing integrations
We have introduced a brand new user Interface for managing integrations and that is directly accessible from the Setup menu. This will be a common integration page for both auto-monitoring and template based clients.
See Managing Integrations for more details.
Tenancy and RBAC enhancements
Password reset after admin password change
When an administrator updates a user’s credentials, that particular user has to mandatorily reset their password in the next login attempt.
See Password Reset for more details.
Dashboard 2.0 enhancements
Support dashboard variable in OpsQL based tiles
We now support the ability to use dashboard variables in Resource and Alert tiles. Dashboard variables are created to assign specific attributes. These are used to filter the data with different attributes, without creating a new tile every time a change is required.
Metric widget creation - Basic Version
Users can now create metric widgets using a simple dropdown-based approach. Users are no longer required to learn a query language to graph their resources or alerts.
See Create a Metric Tile for more details.
OpsQL Resource/Alert Widget - Basic Version
Users can now create resource and alert widgets using a simple dropdown-based approach. Users no longer required to learn a query language to graph their resources or alerts.
See Create an Alert Tile for more details.
Legend icon placement changed
The legend now appears in a dropdown when selecting the “Legend” icon.
Time frame can be changed to see data in preview graph
You can now change the time frame of the preview graph, when editing a widget at the top right.
Cloud monitoring enhancements
Resource support for Google cloud interconnect
As per policy, OpsRamp now discovers the new resource type Google cloud interconnect in addition to the existing resource types during Google discovery.
See Google Interconnect for more details.
Monitoring support for LB’s TargetGroups
As per policy, Opsramp now discovers new resource type target groups in addition to the existing resource types during AWS discovery.
See AWS Target Group for more details.
Support for Azure PostgresQL flexible servers
As per policy, Opsramp now discovers a new resource type PostgreSQL flexible server in addition to the existing resource types during Azure discovery.
See Azure PostgreSQL Flexible Server for more details.
Monitoring management enhancements
Ability to update monitor frequency at the template level
With this enhancements, the frequency can be selected from the list of predefined values. The previous workaround of reading the same monitor with different frequencies is no longer required. You can now update the frequency without reading it.
Alert management enhancements
Filter alerts by selecting parent site
Users can now filter alerts with parent (top level) site names of the resource.
Alert correlation policies updated
In correlation policies, when the user selects the Observed mode, an additional checkbox Review for last 7 days results” is displayed.
See View Reviewed Inferences and its Correlated Alerts for more details.
First response and alert escalation policies
The users can edit the Input and Output column attributes of an uploaded CSV file in the UI itself. Also, using Configure option, a user can create new training file in the UI itself.
Correlate alerts from the maintenance windows
In the schedule maintenance window, an option provided to the user to correlate all open alerts that are in the critical and warning states into a single inference at the end of each schedule maintenance window.
See Create a Schedule Maintenance Window for more details.
First Response Policy
In the First Response policy, an additional Roster native attribute has been added (for both Partner level and Client level policies) to help users in executing actions that are mentioned in the policy definition (either suppress, snooze or run a process automation) only when Roster is Active or Inactive."
See Create a Client-level First Response Policy for more details.
“Notification Roster” field in the ticket
Users can select the roster in the Notification Roster field in the ticket, so that the ticket-related notifications will be sent based on the shift schedule in the Roster.so that the ticket-related notifications is sent to a group of users who are working in the selected shift.
Reports enhancements
Gateway profile details in the inventory report
The inventory report now includes support for displaying gateway details (proxy). The report will now include the gateway IP address and gateway management profile name for agents connecting via Gateway proxy. In the inventory report column selection, ‘Profile Name’ and ‘Gateway Profile IP Address’ need to be added to the selected attributes for this information to be populated in the report. This report can assist you in identifying how many agents are connecting through a specific gateway.
Previously, the inventory report only showed whether the agent was connected directly or via proxy, with no gateway information.
Agent enhancements
Application dashboards data will be disabled
Agent version 13.0.0 onwards, due to security reasons by default application dashboards data will be disabled and not sent. Option is provided to enable/disable application dashboards based on user choice.
Support for Rocky Linux and AlmaLinux
From v13.0 agent releases, Agent now supports Rocky Linux and AlmaLinux Distributions.
Patching alerts to carry patch configuration name
Patch configuration name and UUID are included in patch management alerts to track which job has been initiated.
API updates
API documentation site updates
- APIs that have been deprecated are exclusively identified by a Red color coded dot.
- API listing after selecting each feature.
- Dropdown allows for efficient
real-estate=spaceusage for request and response payloads.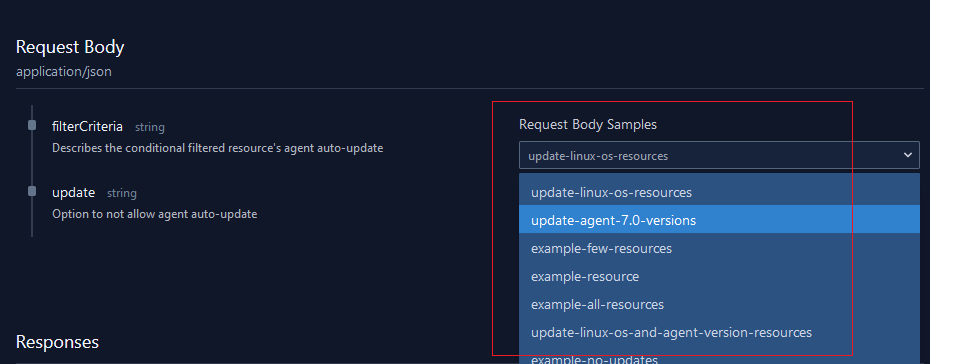
- Listing of HTTP response codes for each endpoint with color code.
- Nested schema with modified icon.
New APIs
- Syslog APIs to create and import/export Syslog profiles.
- Clone Template API endpoint to clone a given template with the new thresholds.
- Included resource level and component level threshold details in “Get assigned templates of resource” API.
- Added API support to get nodes mapped at the cluster level.
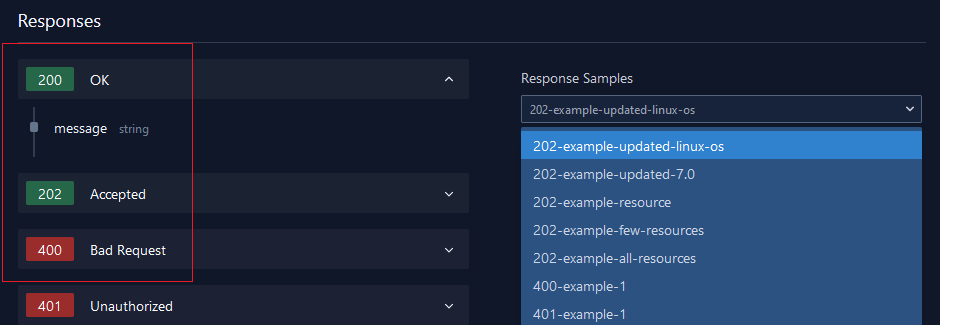
- New API endpoint to enable agent auto-updates on resources.
Updated APIs
- Tenant API has been updated to enable remote console during the client creation.
- Ticketing API with time-bound type will not support Console configurations.
- Schedule maintenance API has been updated to support Alert correlation during maintenance.
End of Life API Endpoints
- Duplicate VPCId attribute from resource schema has been removed from the resource management APIs.
Week of August 8, 2022 (2022_W32)
UI enhancements:
Infrastructure search
The following new operators are now supported as part of OpsQL to query data:
- Contains
- Not Contains
- Starts With
- Not Starts With
- Ends With
- Not Ends With
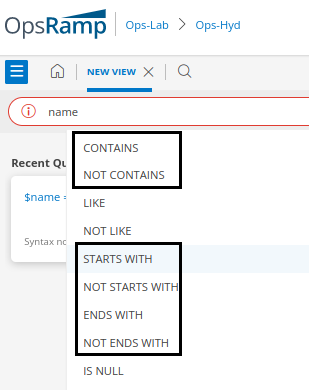
See Infrastructure Search for more details.
Home Tab
A new Home tab has been added to the Infrastructure > Search page.
The Home tab that contains the RESOURCE OVERVIEW categories and resources is displayed when you navigate to the search page.
Note
The resources that have been discovered through an app or integration are only displayed.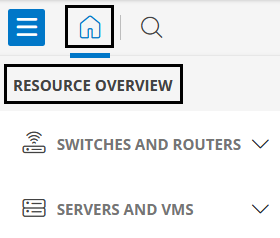
- The home tab is the default view that is displayed when you navigate to the search page at the client-level. It is not available at the partner-level.
- If the user has set a default view, it will be displayed on the search page.
See Resource Overview for more details.
Resources
The Resource overview page now displays the resources discovered by a specific app or integration. This option is only available at the client level.
See Resource Overview for more details.
Related Resources tab
A new RELATED RESOURCES tab has been added to display the list of related resources for a particular resource in the slide-out screen.
For the resources to be related to each other, they should meet one of the following conditions:
- runsOn: Indicates that a resource is running on another resource. For example, an application that is running on a server that is in the process of getting discovered.
- connectedTo: Indicates that a resource is connected to another resource. For example, a port that is connected to a switch.
- dependsOn: Indicates that one resource needs another resource to exist. For example, an ESXi host cannot exist without a vCenter.
- componentOf: Indicates that one resource is a component of a group of resources. For example, a number of VMs that belong to a cluster. Each VM is a component of the cluster.
For the resources to be displayed, the Native Type attribute should be defined and the resources should be related to a main resource.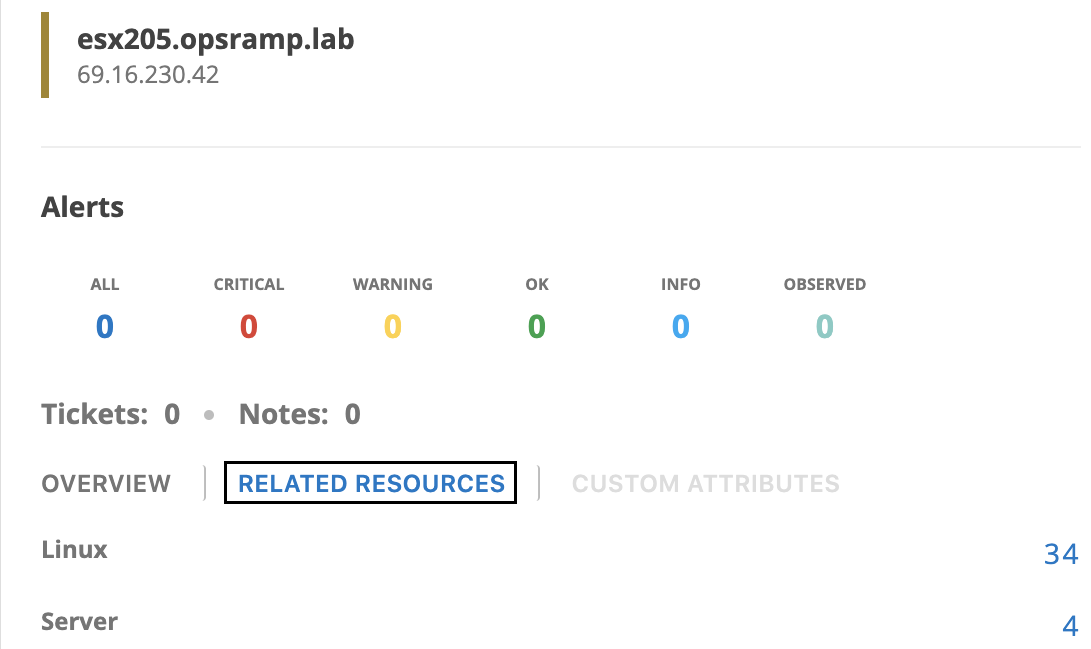
See Related Resources for more details.
Cloud Monitoring enhancements:
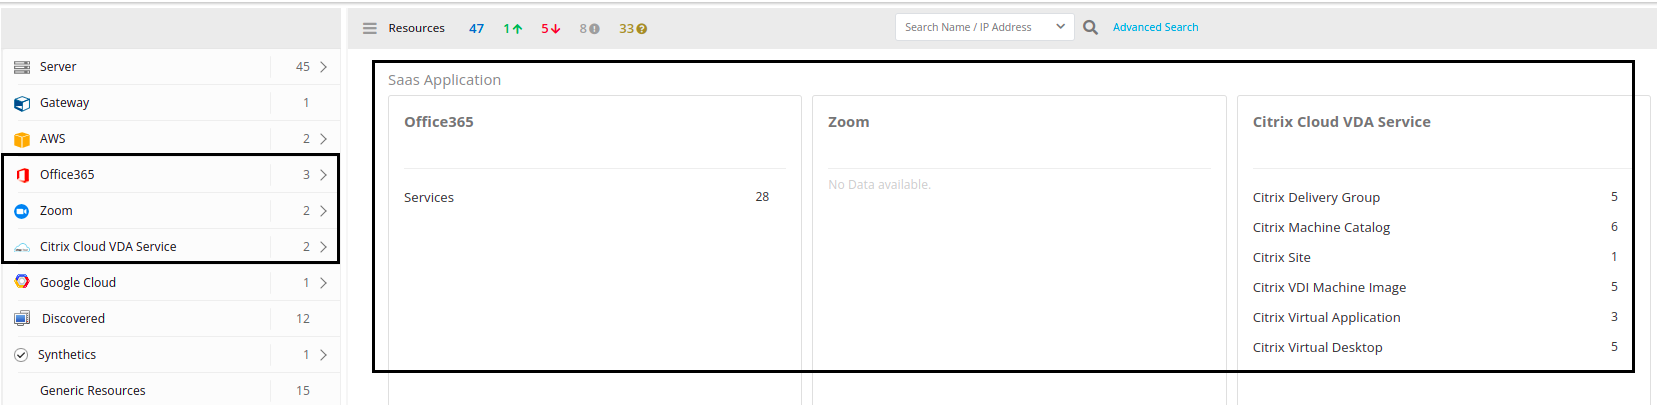
Saas Applications
The UI navigation for SaaS Applications in the Infrastructure tab has changed.
Previously, all SaaS applications were grouped under one category but from now, each application will have a separate category.
For example, zoom integrations is one category and AWS integrations is another category.
Cloud Integrations
OpsRamp now integrates with the latest versions of AWS, Azure, Google, and Alibaba cloud provider APIs.
Metric and Resource Health alerts ingestion
We are now supporting the ingestion of Metric and Resource Health alerts from Azure into OpsRamp using a common alert schema via EventHub.
See Azure Alert Rules for more details.
Cloud Native Monitoring enhancements:
We have updated the RBAC policies in the Agent Deployment YAML file for Kubernetes cluster. The minimum access given is required for cluster discovery and monitoring, and also for agent updates to the latest version.
Remote Consoles enhancements:
User Info
The remote consoles now display the information of the user that has launched a browser console.
If it is an RDP console, a user icon and the user name are displayed.
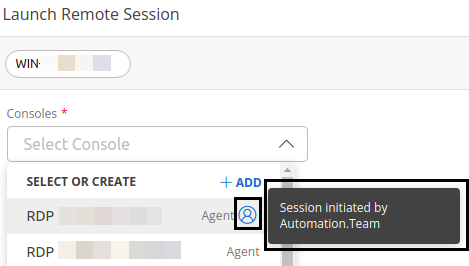
If it is an SSH console, a user icon and the number of user(s) are displayed.
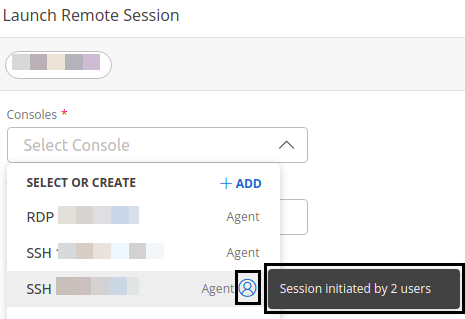
See Launch consoles from the Infrastructure page for more details.
Dashboard enhancements:
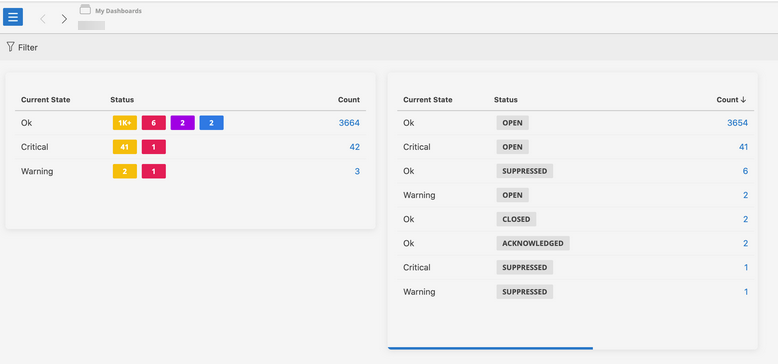
Dashboard 2.0
A new curated dashboard called Alert Statistics is now available as part of pre-defined dashboards in Dashboard 2.0 version. It displays the summary of alerts.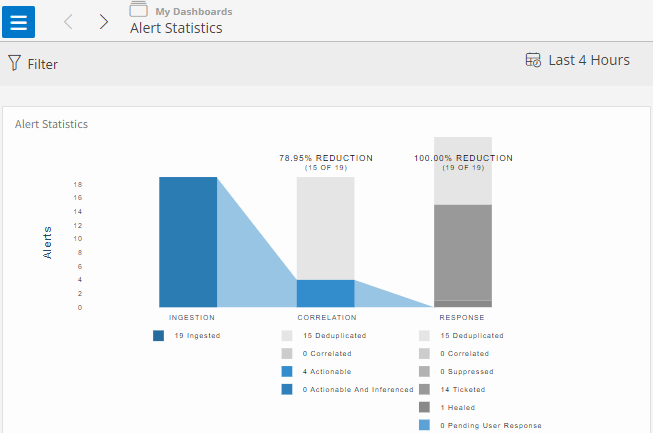
Topology
The topology map UI support has now been added for the SDK adapter resources. The Resource UUID option has also been added to the UI filter. The filter facilitates the topology map for the SDK adapter with the resource UUID that has been provided.
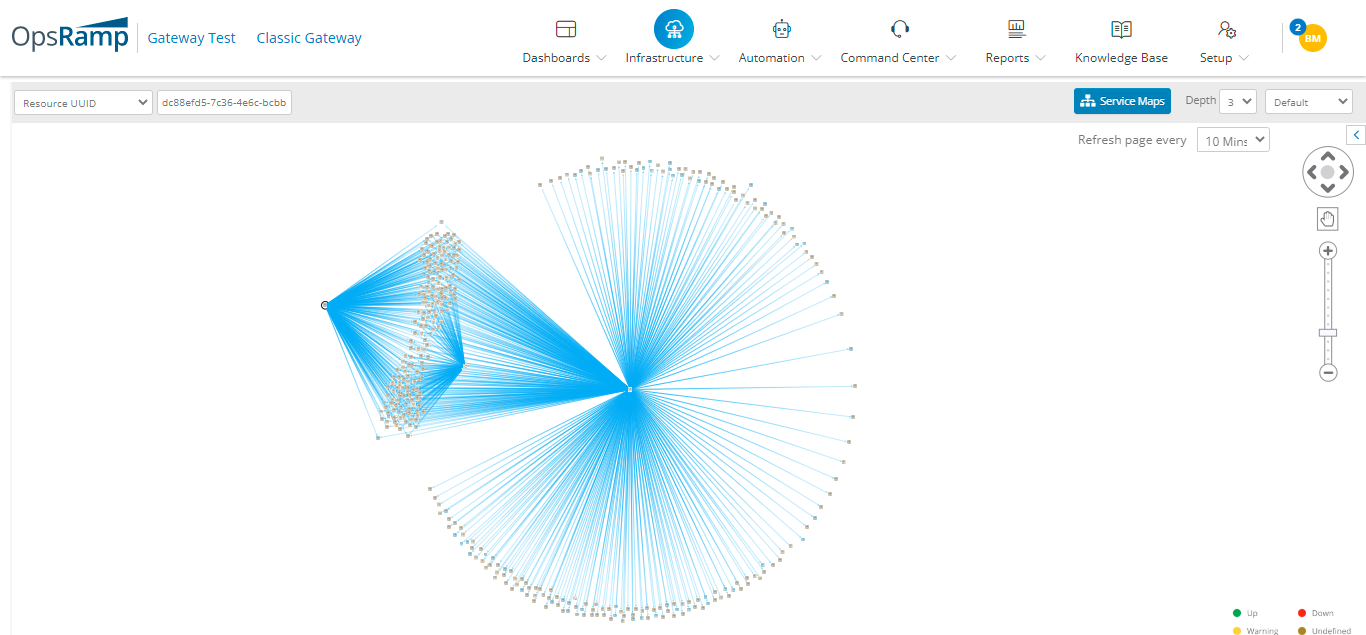
See Resource UUID for more details.
Process Automation enhancements:
Users can now receive notifications for a failed or suspended task on a process definition through an email.
The notifications will be sent to the subscribed emails at the process level, and support external email IDs also.
The users can configure the following parameters:
- When Stuck/When Failed - time when the task got stuck or failed, or time to wait before triggering an email
- Notify Frequency
- Notify Users
- CC Users
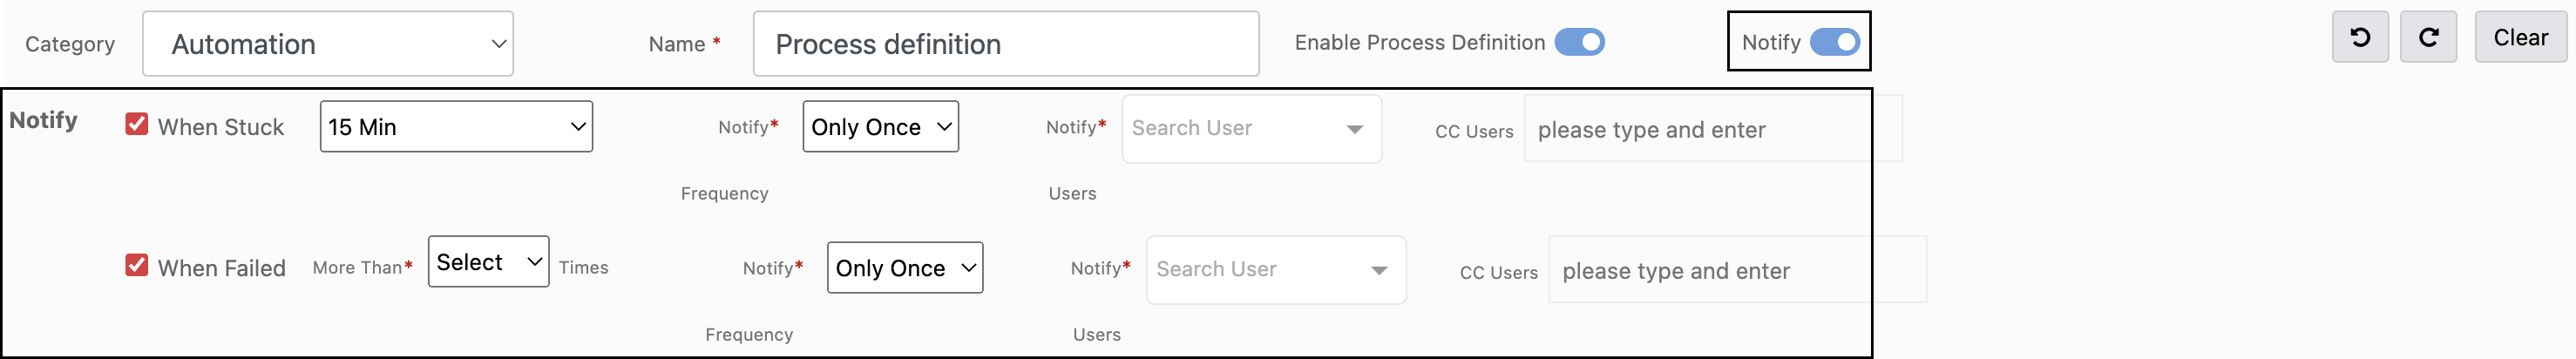
See Enable and Disable the Notify toggle for more details.
Reports enhancements:
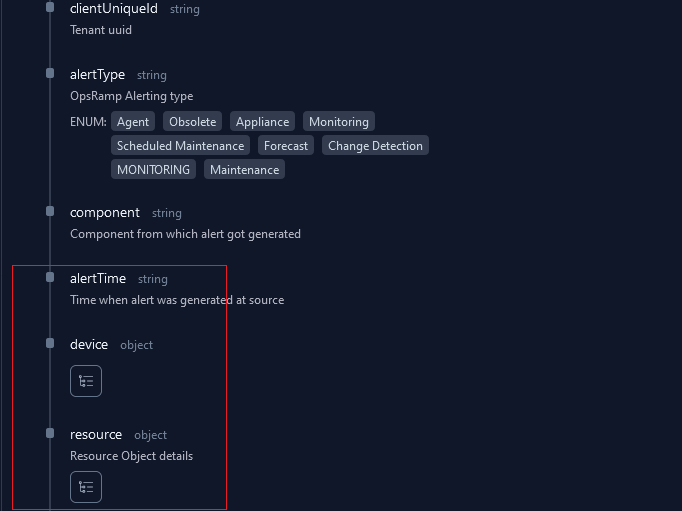
A new field called the Component has been added to the Alerts reports.
Alert Management enhancements:
The data in the Seasonal Groups field in the Alert Prediction tab is now sorted alphabetically.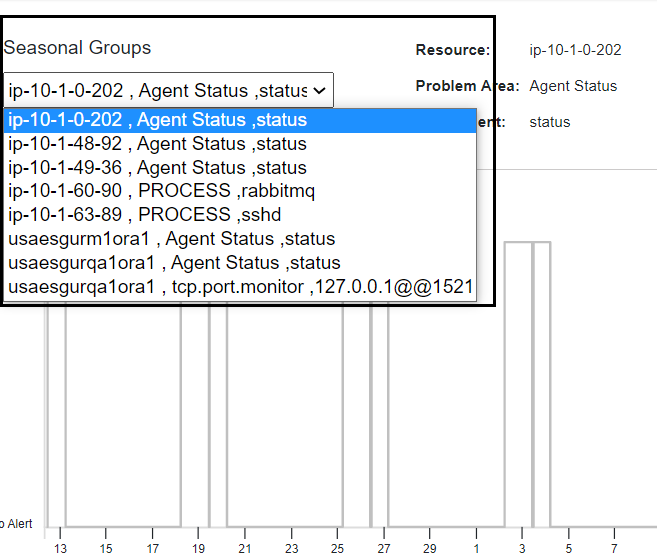
Password Management Integration enhancements:
OpsRamp now supports integration with the Hashicorp password vault. The users can launch remote consoles into a machine using their credentials from the Hashicorp vault.
This integration is currently limited to remote console launch.
Week of July 11, 2022 (2022_W27)
Infrastructure Search
Infrastructure advanced search is updated to use OpsQL syntax. The $ in the expression is no longer required.
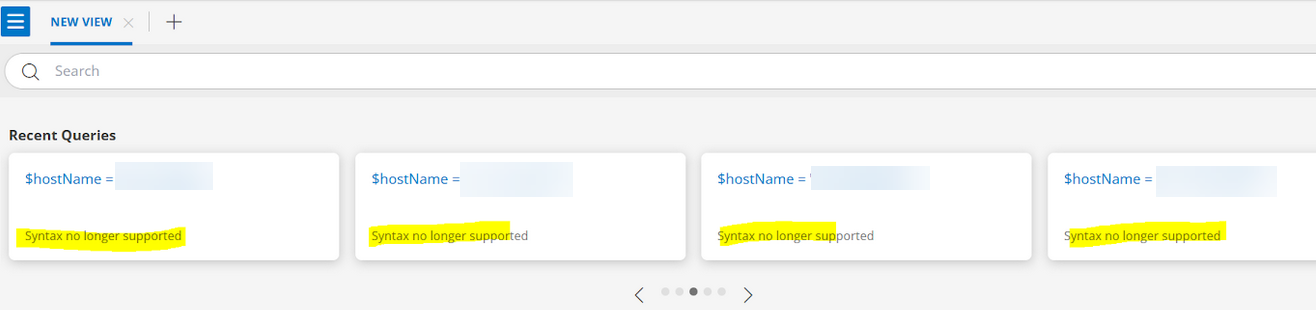
For more information on Infrastructure search, click here.
Dashboard 2.0 enhancements:
Drill down capabilities from OpsQL tiles
Metric tile - Click on any of the items in the legend or tile to be redirected to the resource details page related to the metric clicked on.
Resource tile - Click on any of the items in the legend or tile to see a list of the resources from that exact time frame and with the same set of tags as the widget clicked on.
Alert tile - Click on any of the items in the legend or tile to see a list of the alerts from that exact time frame and with the same set of tags as the widget clicked on.
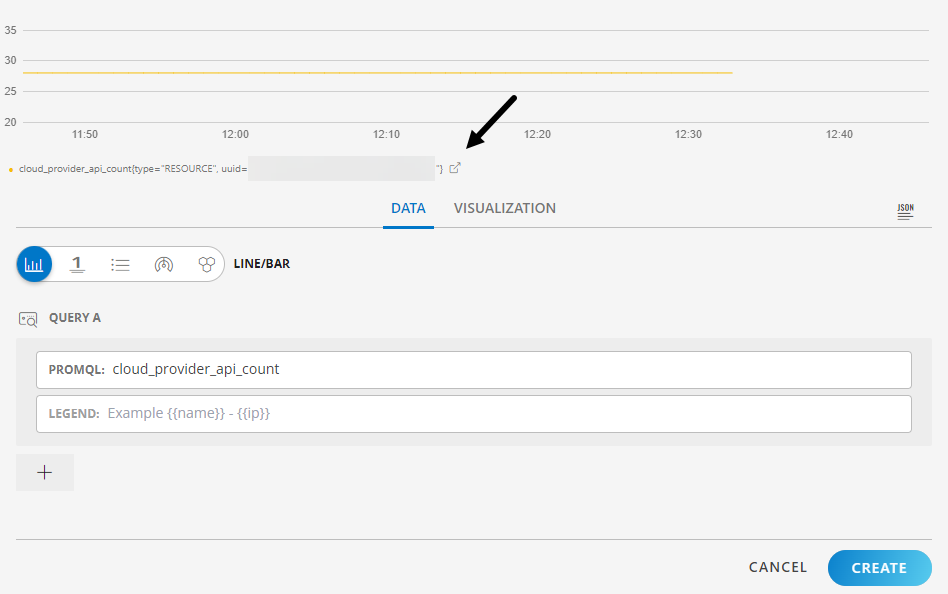
Metric tile:
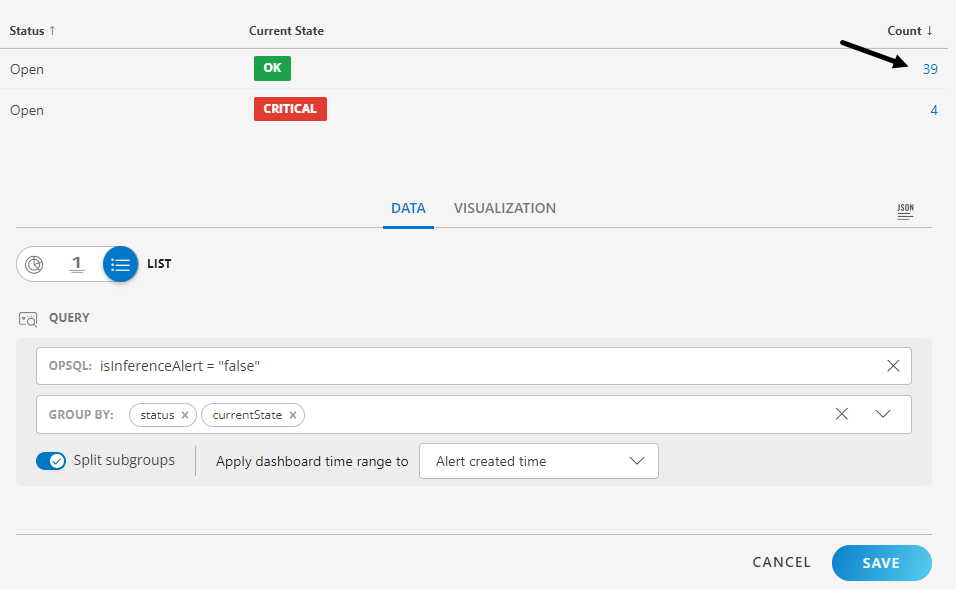
Alert tile:
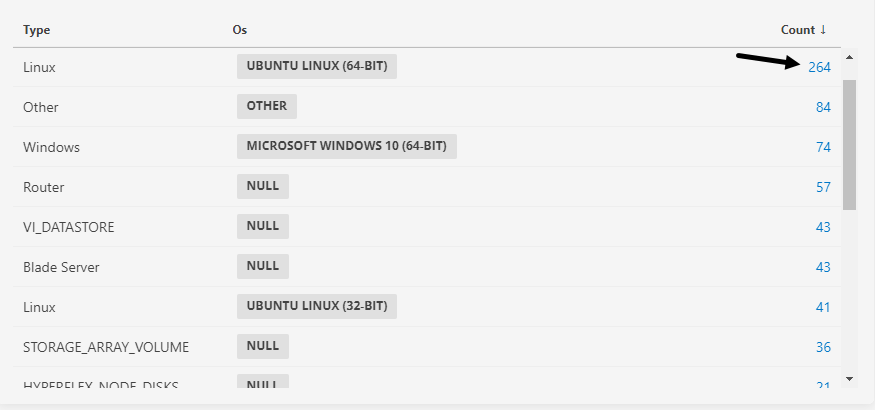
Resource tile:
Partner Level Support for Dashboard 2.0
Dashboard 2.0 is now available at the partner level context.
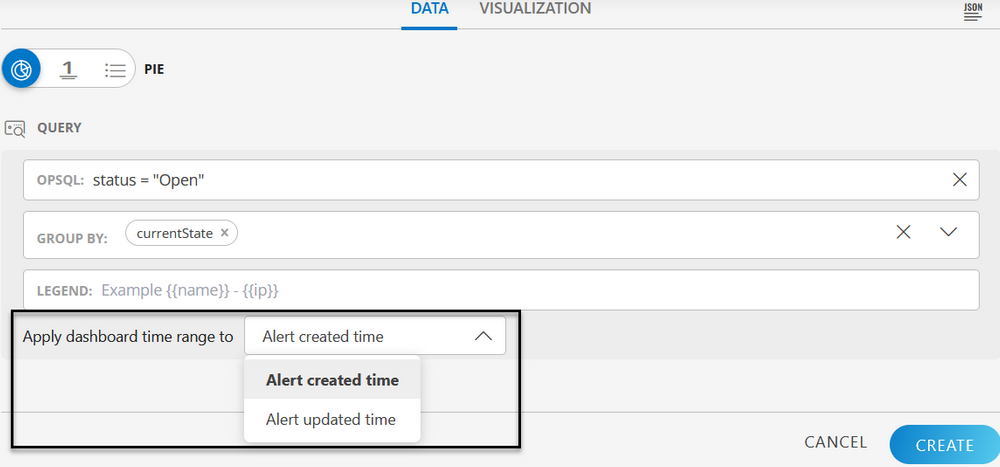
Alert Time Range Selection
Users are now given the choice to visualize alerts based on when they were created vs. updated.
Multi Column List
Users can now visualize resources/alerts as split out into sub-groups in the list visualization when choosing more than one Group By tag.
See Introduction to tiles for more details.
Enable Edit Shared dashboard for Client/Partner Administrator
Shared dashboards can now be edited by admin users.
The users can now edit, remove, and rename the Tiles and Dashboards.
Criteria:
- The user has created the dashboard
- The dashboard has been shared with the user and the user has administrator privileges
Integration enhancements:
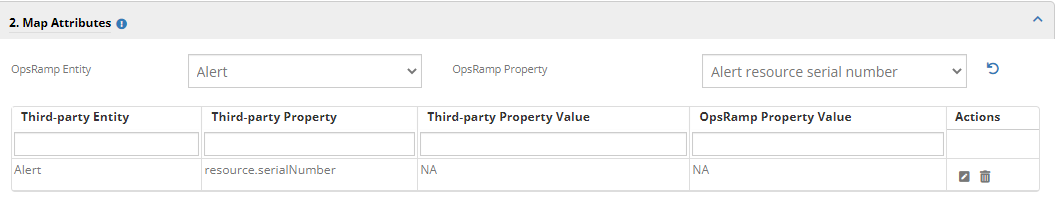
Alerts webhook integration supports taking device serial number
Support is provided to map resource serial number via integration mapping section. This will map only when the resource is new and did not exist in OpsRamp earlier.
Discovery enhancements:
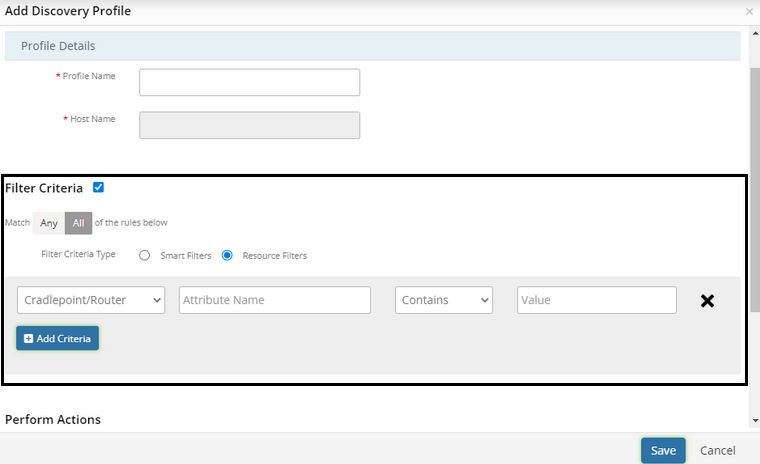
Discovery Policy support for Meraki and Cradlepoint
Today Meraki and Cradle Point integrations, once onboarded, will discover all supported resources.
Now extended options are available to user to filter the resources that have to be discovered.
Cloud/SaaS monitoring enhancements:
OAuth authentication for Zoom App monitoring
Zoom Integration is updated to support OAuth authentication for discovery and monitoring.
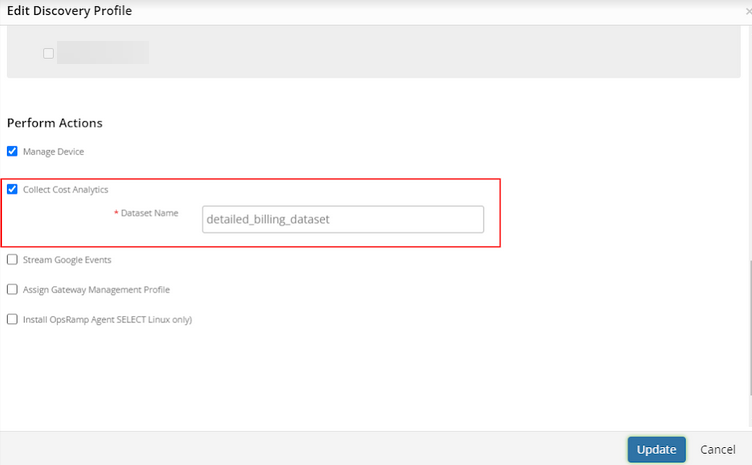
GCP Cloud Billing support
Added support for consuming google cloud billing data through big query data set instead of Storage Account which is being deprecated by Google.
Public cloud discovery enhancements
A new interface is now available for managing integrations.
Agent enhancements
Agent self monitoring improvement
Now you can configure the Agent’s self-monitoring frequency. You can select from 1, 2, 3, 6, and 12 hours options. Earlier, the default time was set to 6 hours.
To provide notification when there is a change in the availability of agent-monitored metrics, the agent self-monitoring feature generates alerts when agent-monitored metrics are interrupted and, again, when metric monitoring is restored.
See Enable Agent Self-Monitoring for more details.
Alert Management enhancements
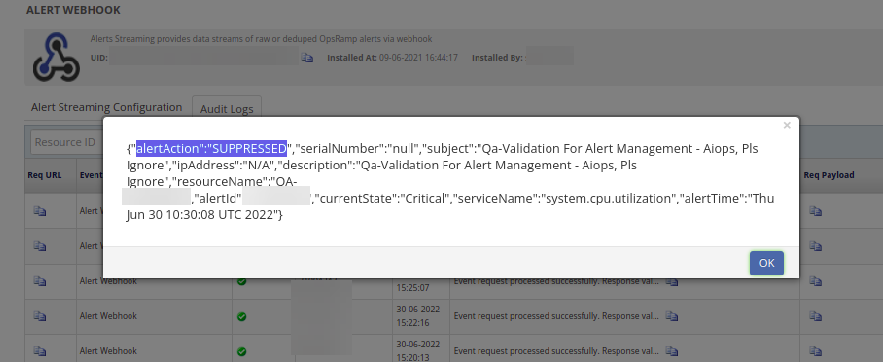
First Response policy – Alert status as suppressed for Alert Stream exports
Now First Response suppressed alerts will also participate in alert streaming with their status.
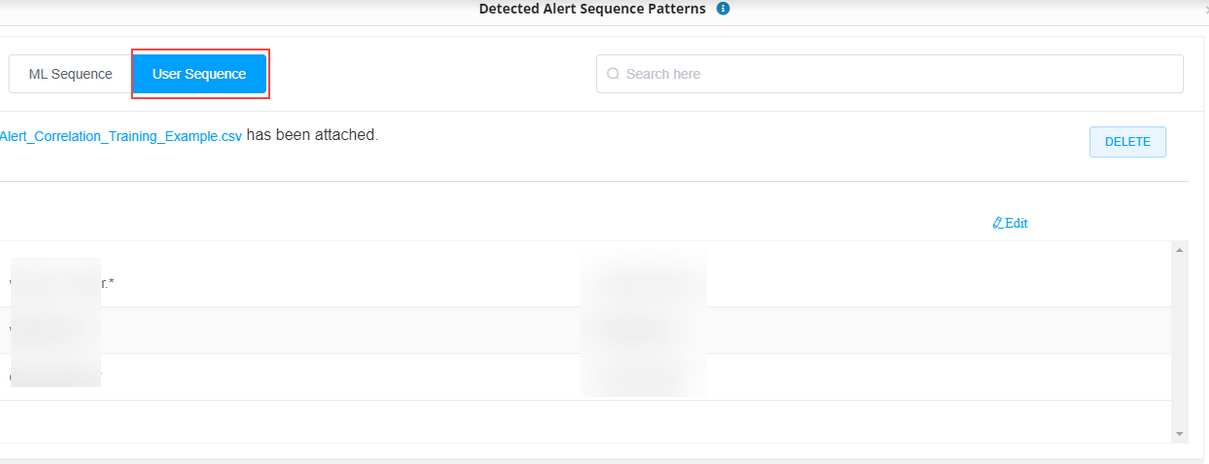
New UI and improvements on Alert Correlation ML views and CSV file
Now, detected sequence page will show the sequence of the metrics that will correlate. You can also provide input sequence from the UI itself instead of giving it in a CSV file and upload. Also, provided option to Learn/Unlearn. If you do not want to correlate particular sequence that is detected by Machine Learning, you can make that pattern as “Unlearn” from UI so that new alerts that match that pattern will not get correlated.
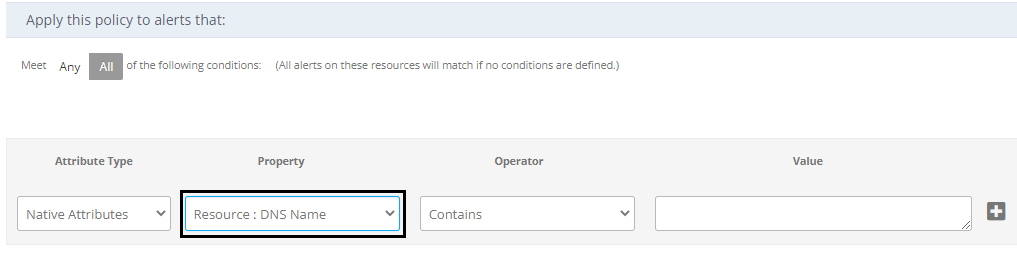
UI parity between “dns name” and “name”
Given DNS name filter support in all alert policies and also in the training file of Alert First Response and Alert Escalation.
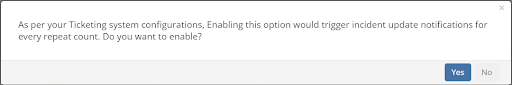
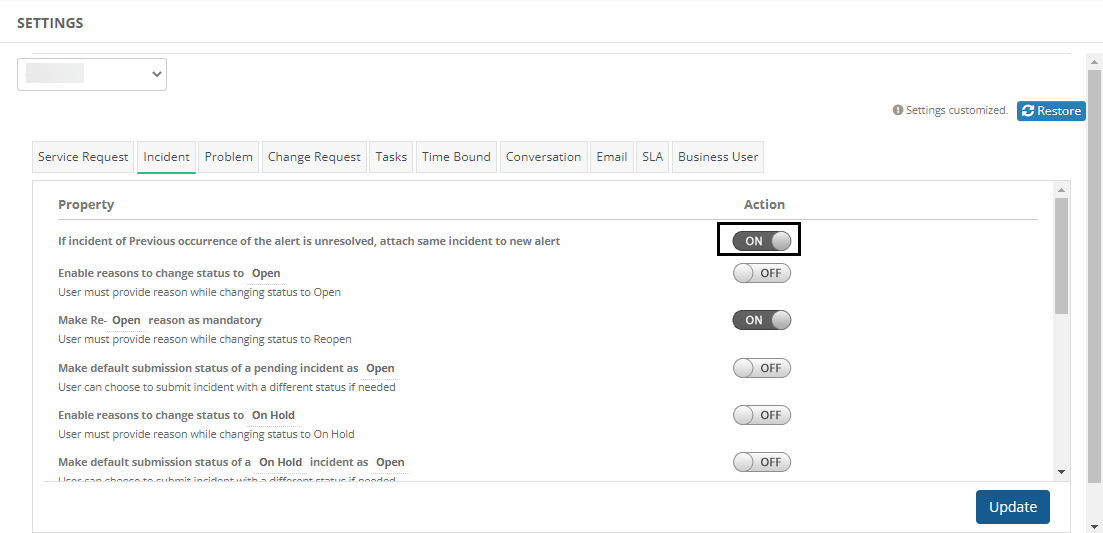
Append alerts to existing open incident
Additional option is given in incident settings, “Attach existing open incident to new alert”, if the previous alert has incident created and that incident is in open state. Enabling this option will append that incident to the new alert instead of creating new incident.
Week of June 14, 2022 (2022_W23)
APIs to manage streaming alert exports
New APIs are now available to manage streaming alert export configurations. See the API documentation page to learn more about the export configurations.
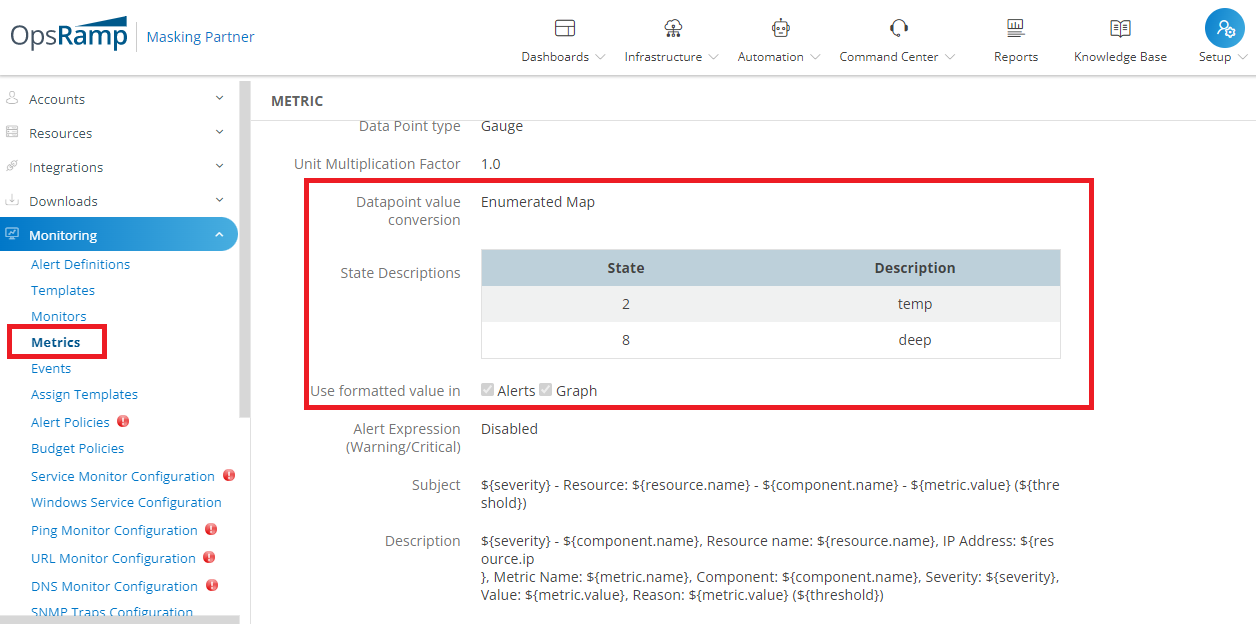
Metrics descriptions for custom monitors
Custom monitors with metrics with enumerated values and associated descriptions are now displayed in graphs.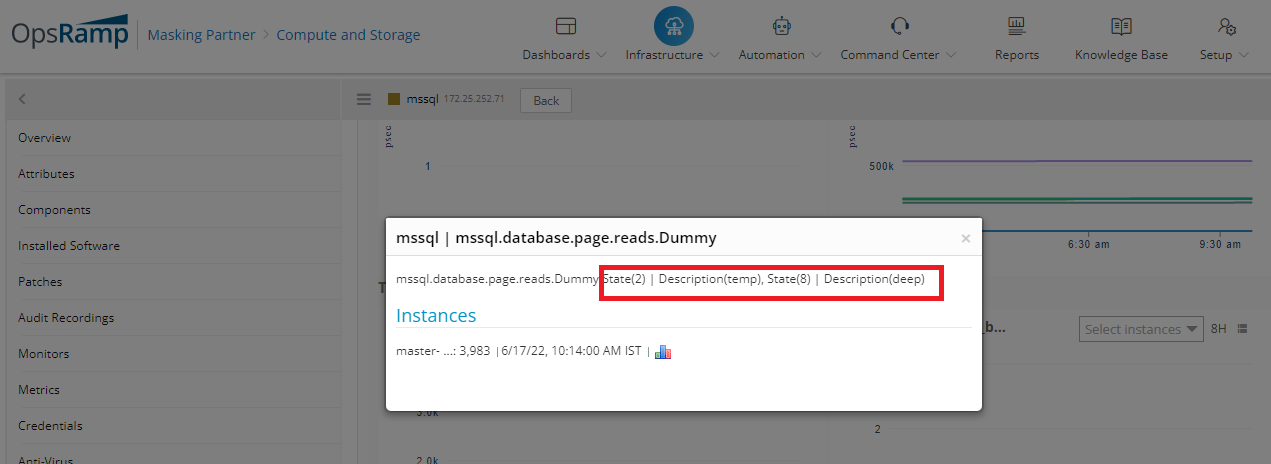
Escalation policies improvements
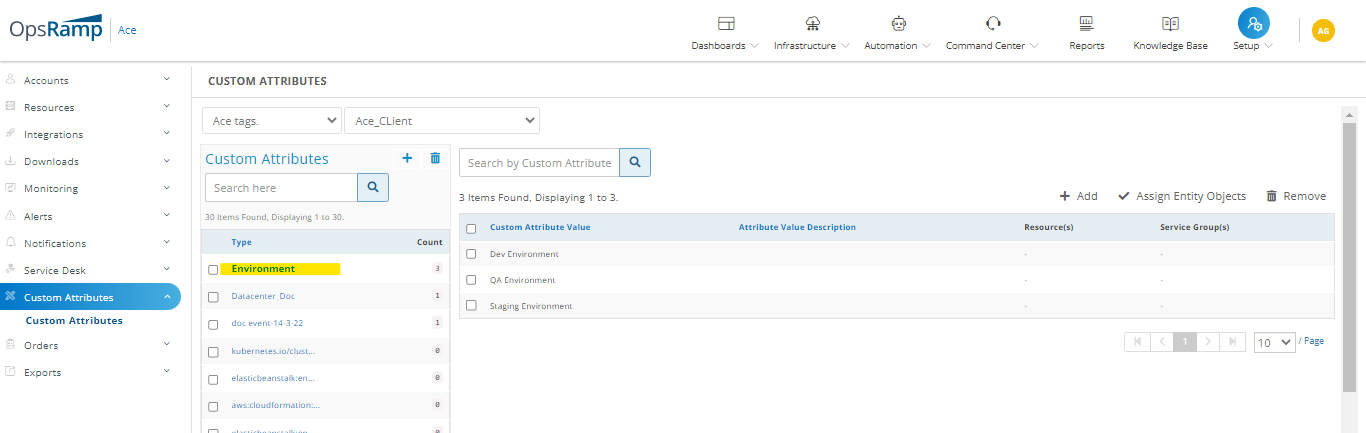
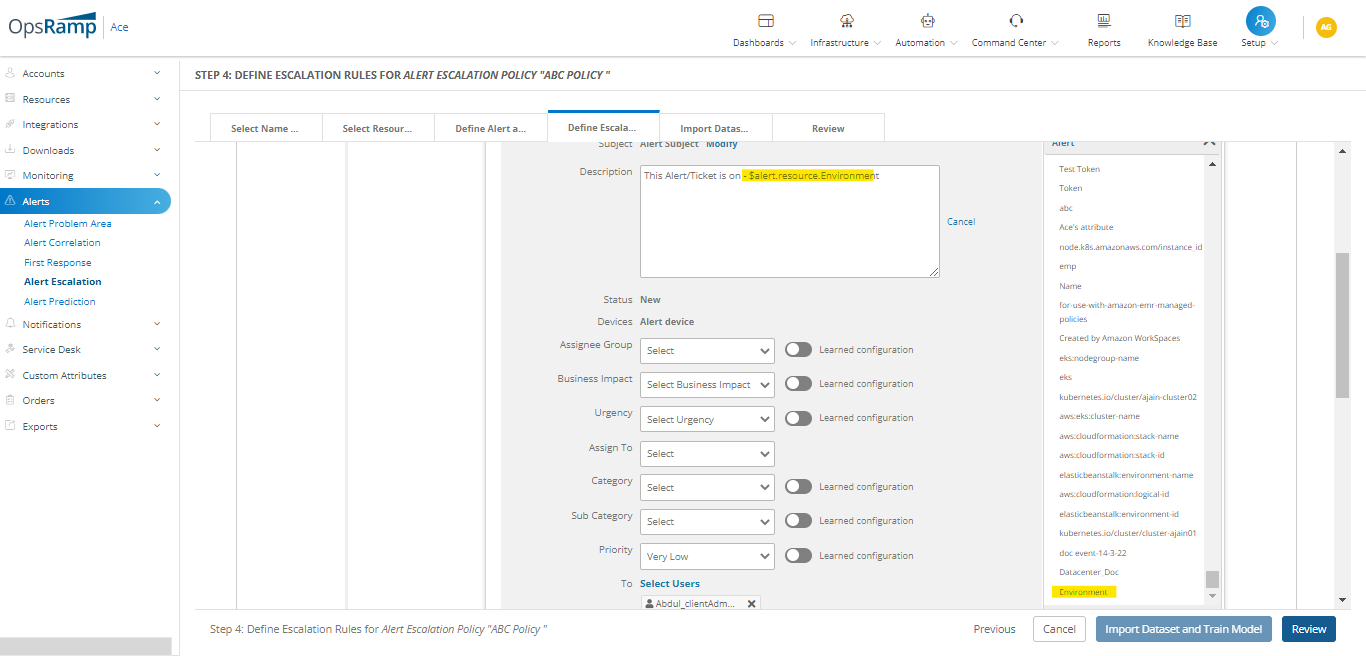
You can now define escalation policies for alerts on service maps based on custom attributes.
Create/Assign Custom attributes to Service Map
Selecting the Custom attribute Token in Escalation Policy
Created incident from escalation policy on service map with its custom attribute value
Template configuration usability improvements
Monitoring and metric template configuration table sizes can now be expanded to show more metric rows without requiring scrolling.
Permissions to create scheduled maintenance on resource groups and sites
Any user with Scheduled Maintenance Manage permission can now create scheduled maintenance windows at the site and the group level, even though the user does not have the Device Manage permission.
Availability on network interfaces based on operational status
You can now monitor the availability of a network interface based on the operational status of the interface. The topology map now also shows the availability status of the interface.
In-use visual indicator on remote console
You can now see if a remote console is in use in the console listing page. See the Launch Browser Consoles page to learn more about the browser console options.
Patch jobs comply with maintenance window
Patching jobs now enforce that all jobs are active only within the scheduled patching window. All patching jobs that have not yet started and have not initiated patch installation are suspended if the maintenance window has ended.
Improvements to Service Desk
You can now attach tasks to service requests.
Upcoming changes for week 27, 2022 (2022_W27)
The following changes will be available, starting from week 27, 2022:
Accessing Meraki and CradlePoint resources from Infrastructure
There will be a change in accessing Meraki and CradlePoint resources. They will be accessed from the Infrastructure > Resources tab.
Select the Meraki and CradlePoint integrations from the left navigation on the Resources page and expand to view the attributes.
GCP Cloud Billing support
The GCP cloud billing support will be added to support Google cloud billing data through a big query data set.
The big query data set will replace the Storage Account, which is being deprecated by Google.
Putting billing information into storage accounts is already in action for all the latest accounts.
So, Opsramp updated the Cost information collection support through the big query data set, as recommended by Google, and hence, deprecating from storage account.
See https://cloud.google.com/billing/docs/how-to/export-data-bigquery for more information.
Oauth authentication for Zoom App monitoring
Zoom Integration is updated to support oauth authentication for discovery and monitoring, which is a standard followed. The JWT token authentication is going to be deprecated in week 27, and only oauth based Zoom apps will be supported.
Week of May 2, 2022 (12.0_2022_W17)
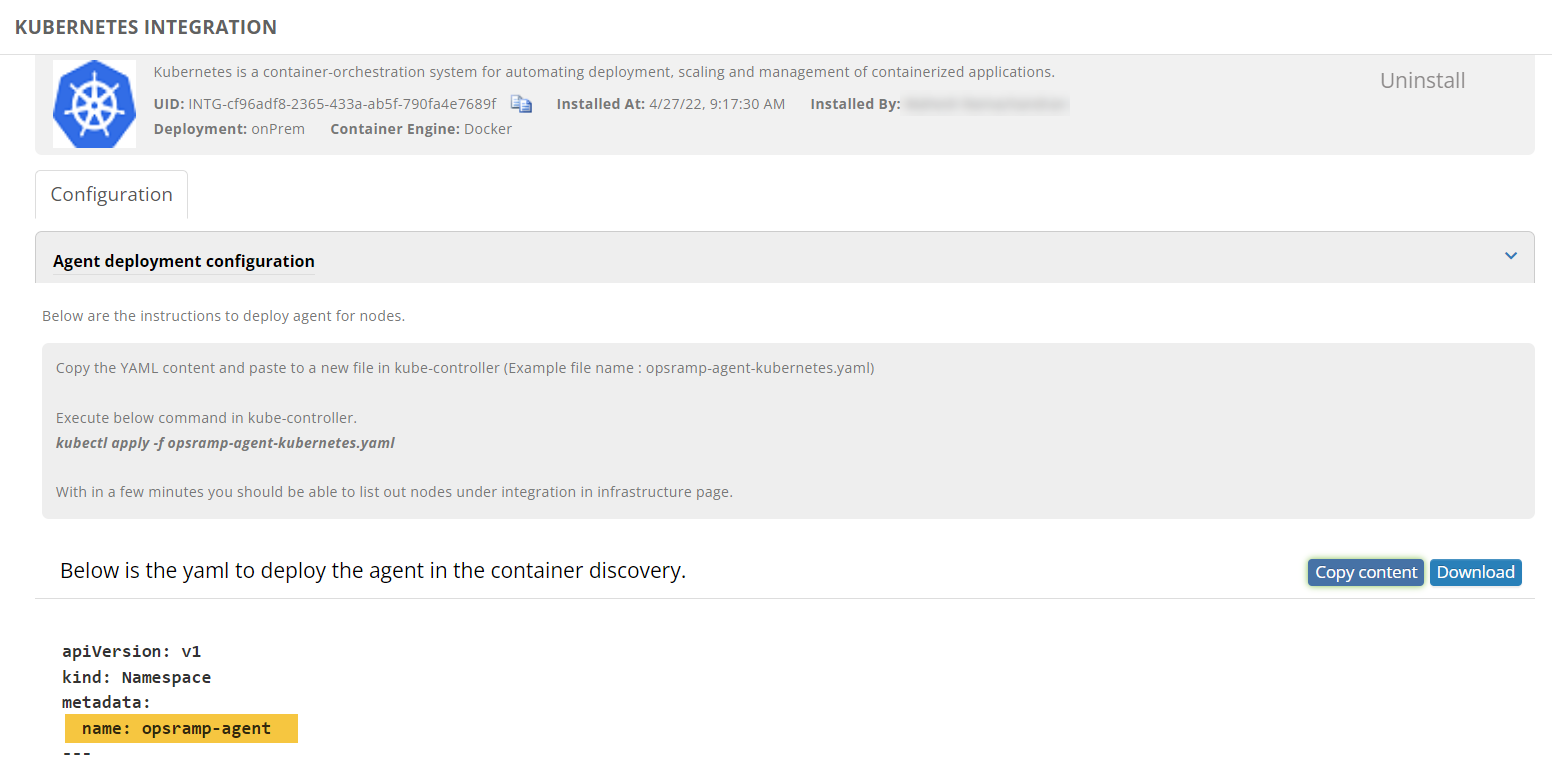
Monitor Kubernetes namespaces
You can now customize the Kubernetes namespace on which the OpsRamp agent is deployed, in a Kubernetes cluster. You can specify a custom namespace in the agent deployment configuration file for Kubernetes. Prior to this release, the OpsRamp agent could only be deployed in an OpsRamp defined namespace.
End-of-Life OS versions no longer supported by OpsRamp agent
As announced earlier (see deprecation notice), starting agent version 12.0.0, the OpsRamp agent will not support on the following OS versions:
- Fedora Linux versions 30.X and prior versions.
- Oracle Linux versions 5.X and prior versions.
- Red Hat Linux versions 5.X and prior versions.
- Prior versions of SUSE Linux Enterprise Server (SLES) 11.x.
Agent-based monitors re-trigger alerts every 6 hours
Agent-based monitors now re-trigger alerts every 6 hours, even if the original alert’s state has not changed. This is to ensure that alertable conditions that persist on managed resources are brought to the user’s attention again.
Note
Gateway-based monitors already re-trigger alerts every 6 hours. With this enhancement, re-triggering of alerts works identically between gateway-based and agent-based monitors.
When you update the agents to v12.0.0, alerts manually suppressed before will be re-triggered every six hours if the alert condition meets.
File integrity checks on agent-based custom monitor scripts and runbook scripts
OpsRamp agents now perform file integrity checks on custom monitor scripts and runbook automation scripts prior to running them. This enhances security by ensuring that scripts that run on managed resources have not tampered with. If the agent detects a script that has been tampered with, the agent will trigger an alert to notify users.
Virus definitions in the gateway are out of date
If the virus definitions in the gateway are out of date, the gateway will generate a critical alert. This Critical alert will be generated only if the gateway’s antivirus service is enabled.
If the virus definitions in the gateway are up to date, the gateway will generate the a Heal alert.
See Gateway Security for more details.
Week of April 18, 2022 (2022_W14)
| Update Type | Category | Change Description |
|---|---|---|
| Enhancements | API Framework | The following updates are available in the APIs:
|
| Cloud Monitoring | Metric support for Azure Compute Disk (Disks/Managed Disks). Azure Cloud monitoring now supports metrics for Azure Compute Disk (Disks/Managed Disks). | |
| Dashboard | v2 Dashboards | Single Value for Resources and Alert tile Resource and Alert tiles are enhanced to add the Single Value type to specialize the query building for more accurate visualizations with different parameters. | |
| Dashboard | Dashboard 2.0 | Alert Tile support in Dashboard The Alert tile provides the users with the ability to view the breakdown of the current alert count. The users can:
| |
| Reports | Ticket Report: Additional Fields Ticketing reports now include user-related attributes, which indicate the user that made the updates and when. The attributes are:
| |
| UI | Hide profile update functionality on UI through feature flag Profile update capability can be disabled for all users belonging to a specific client. Users will not be able to update their own profile settings or change the password. |
Week of March 28, 2022 (2022_W12)
| Update Type | Category | Change Description |
|---|---|---|
| Enhancements | — | Topology auto refresh changes Auto refresh with 5min, 10min, 15min, 30min and 60min duration options enabled in topology view UI screens. |
| API Framework | Provide ability for explicit actions for incidents via API User driven actions by API endpoint on tickets have been enhanced to not only close tickets but also to reset the values of ticket's attributes, which can be changed so that users can automate reset operations as required for the business operations. | |
| API Framework | Graph API V3 Version update Users can now use the enhanced new version of the topology API endpoint, which is optimized in performance. Details can be found in the following topology endpoint: | |
| Cloud Monitoring | Activity Tracking for SaaS Apps SaaS apps discovery has been enhanced to support audit logging to know the current status of discovery to avoid any on demand discovery during active discovery in progress. | |
| Cloud Monitoring | VMware SD-WAN (VeloCloud) Discovery and Monitoring OpsRamp now supports discovering and monitoring of VMware SD-WAN (VeloCloud) resources. Discovery features are:
Monitoring includes:
See the VMware SD-WAN - VeloCloud page to learn more. This app is of beta quality as it is built and verified with expected API responses in the absence of lab availability. | |
| Resource Management | Auto Refresh for Topology Explorer view Auto refresh with 5min, 10min, 15min, 30min and 60min duration options enabled in topology view UI screens. | |
| UI | Display incident and notes count on resource slide-out Open incidents, notes count available in resource quick view details shown in New infrastructure UI navigation > search results > resource details side panel section. | |
| API Endpoint Changes | OpenAPI Specification | OpsRamp Public API Updates The following are the API updates:
New APIs
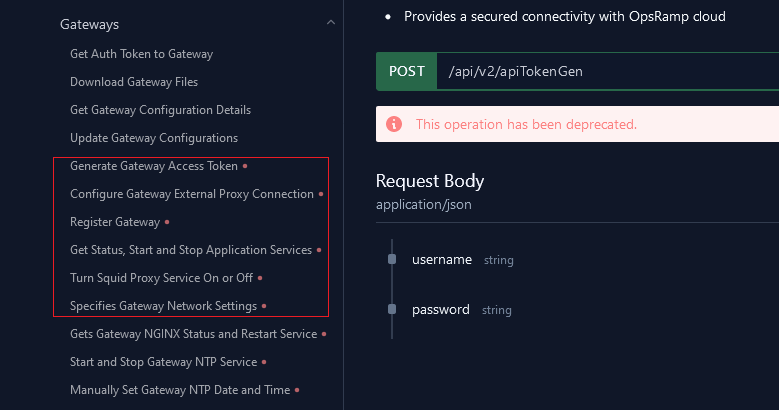
APIs to be Deprecated All the legacy Gateway endpoints are getting deprecated and being replaced with the following new endpoints: https://develop.opsramp.com/docs/v2/gateways/apitokengen https://develop.opsramp.com/docs/v2/gateways/externalproxy https://develop.opsramp.com/docs/v2/gateways/registration https://develop.opsramp.com/docs/v2/gateways/applicationservice https://develop.opsramp.com/docs/v2/gateways/proxy-action https://develop.opsramp.com/docs/v2/gateways/networksettings https://develop.opsramp.com/docs/v2/gateways/nginx https://develop.opsramp.com/docs/v2/gateways/ntpservice https://develop.opsramp.com/docs/v2/gateways/ntpmanualconfig https://develop.opsramp.com/docs/v2/gateways/ntpupdateips https://develop.opsramp.com/docs/v2/gateways/ntpsyncips https://develop.opsramp.com/docs/v2/gateways/restartnetwork https://develop.opsramp.com/docs/v2/gateways/staticroute https://develop.opsramp.com/docs/v2/gateways/settimezone https://develop.opsramp.com/docs/v2/gateways/generalinfo https://develop.opsramp.com/docs/v2/gateways/getntpdetails https://develop.opsramp.com/docs/v2/gateways/gettimezoneinfo The following is the list of new endpoints with equivalent functionality: https://develop.opsramp.com/docs/v2/gateways/v2-auth-token https://develop.opsramp.com/docs/v2/gateways/v2-gateway https://develop.opsramp.com/docs/v2/gateways/v2-gateway-actions-actionname See the announcement here: https://docs.opsramp.com/support/deprecations/2022-spring-dep/#legacy-gateway-apis |
Week of March 7, 2022 (2022_W10)
| Update Type | Category | Change Description |
|---|---|---|
| Enhancements | API Framework | Ability to configure SSO integration by APIs SCIM users can now be synchronized in the OpsRamp platform by means of SCIM webhook endpoints, which need to be configured at the SSO tools that own SCIM user management lifecycle. Details of the endpoints are available in the API overview. |
| API Framework | Agent online/offline status details in API response Agent online/offline status, and agent last active time is available as part of GET resource API response: /api/v2/tenants/{tenantId}/resources/{resourceId} | |
| Alert Management | AIOps Enhancements: Trust Enablement We have enhanced trust enablement for our AIOps capabilities. You now have the option to fire alerts when training fails. In the case that training does fail, we will use the model obtained from the previous training. | |
| Core Platform | Partner level URLs as a destination to those alerts that are incoming from 3rd party application via Logstash Tenants can now onboard customers with their configured monitoring type custom integrations without the need to configure at each customer level. | |
| Dashboard | Resource Tile: List Visualization We have added the list visualization type to the Resource tile in Dashboard 2.0. The list visualization allows you to view the count of resources that meet the defined filter criteria in a tabular format. | |
| Process Automation | Parser task in Service Task Parser task provides parsing functionality in the process flow based on the keys defined by the user. It provides a map of key and value parsed from given text. | |
| Reports | Inventory Report: Software Revision We have added the software revision attribute to the standard Inventory Report. This attribute can be used to report the current software revision of your devices. | |
| Resource Management | Topology map should show link and node status Users can now be able to see the link and node status while monitoring a topology to know about the availability. | |
| UI | Improved UI Hygiene We have improved various UI hygiene elements including spelling and grammar issues around the product. | |
| UI | Integrations Link Added to Navigation Bar We have moved the Integrations link to the top-level navigation bar. To access integrations, hover on Setup and select Integrations. | |
| API Endpoint Changes | OpenAPI Specification | OpsRamp Weekly Public API Updates Users will find a deprecated mark to the below endpoints.
|
Week of February 14, 2022 (2022_W7)
| Update Type | Category | Change Description |
|---|---|---|
| Enhancements | Alert Management | Alert Escalation during Scheduled Maintenance Enhancement We have fine-tuned alert escalation policies to trigger a healed alert notification when an alert in the "Ok" state is fired during a scheduled maintenance window. |
| Cloud Monitoring | Public Clouds Version Upgrade Version upgrades have been applied to all public clouds including Alibaba, AWS, Azure, and GCP. The version upgrade is applicable for all public cloud microservices as well. | |
| Design | UI Refresh for Resource Commands We have enhanced the UI for resource commands. Commands can now be ran directly from the resource summary slide-out. | |
| Resource Management | Advanced Search for Resource Groups We have extended advanced search capabilities to the resource group rule engine. Advanced queries can now be written to add all current and future resources that match the query criteria to resource groups. | |
| Synthetics | Regex Handling with Payload Monitoring in HTTP/s Synthetic Monitoring We have added support for regex handling in the payload monitoring we have in place with HTTP/HTTPS. This allows you to create flexible patterns to check the number of occurrences and multiple text searches in the existing payload monitoring. | |
| Synthetics | Synthetic Monitoring Enhancements We have enhanced our synthetic monitoring to support more than three on-premise collectors and have clarified the graphs for Response Time and SSL Certificate Expiry. | |
| Synthetics | Synthetic Resource Auto Monitoring Synthetic monitoring provides SREs and Ops teams with the ability to simulate core transactions such as user flows, URL uptime checks, and SSL certs so they can stay ahead of service-impacting issues. SREs and Ops teams can now seamlessly configure and monitor their synthetic tests in OpsRamp. Users can leverage the onboarding wizard to quickly configure and monitor synthetic tests, spending less time on platform configuration and more time on maintaining application availability. Limitations: Synthetic auto monitoring is limited to clients enabled with auto monitoring. | |
| API Endpoint Changes | OpenAPI Specification | OpenAPI spec for MetricsQL Users can query the monitoring metrics data of new metrics engine from OpsRamp Metric Query APIs. Details of the endpoints are available in the API documentation section. |
Week of January 31, 2022 (2022_W5)
| Update Type | Category | Change Description |
|---|---|---|
| Enhancements | Dashboards | Honeycomb widget: Add Metric Scale We have enhanced the honeycomb visualization for the metric tile on Dashboard 2.0 with the ability to define custom metric scales. You can now set your own floor and ceiling metric values which allows you to have better control of the gradient of the honeycomb. |
| Alert Management | Topology-based Alert Correlation Enhancement We have enhanced topology-based alert correlation to perform whether or not the parent alert has been detected first. | |
| Cloud Monitoring | On-Demand Rescan for SaaS Applications You now have the ability to trigger an on-demand discovery scan for both Zoom and Office 365 through the UI and API. This helps ensure that data from your Zoom and Office 365 applications are up to date. | |
| Process Automation | Enhancement to allow a Process Definition StartEvent to launch on specific days of the week The process definition trigger now supports selecting specific days of the week in the weekly recurrence pattern. | |
| Reports | Patch Report: Filter by Patch Rating We have added the ability to filter by Patch Rating in the Patch Details Report. Applicable attribute values include 'Whitelisted' and 'Blacklisted'. Limitation: This filter can only be used with AND operators. | |
| Reports | Ticket Report: Include Linked Knowledge Base Articles We have added an attribute to the Tickets Report called 'KB ID' that allows you to report on the Knowledge Base articles that are linked to Incidents. | |
| Service Management | Approval Function for Time-Bound Requests We have added the ability for users to submit an approval request for a time-bound entity. When the request is sent, the administrator will receive a notification and can choose to accept or decline the request. If the request is approved, the user can access the target device. | |
| Synthetics | HTTP Synthetic Transaction Monitoring against Microsoft Edge As a part of HTTP Synthetic Transactions, we have extended the simulation performed at the Synthetic Collector to extend to Microsoft Edge. | |
| Synthetics | HTTP Synthetic Transaction Monitoring against Firefox As a part of HTTP Synthetic Transactions, we have extended the simulation performed at the Synthetic Collector to extend to Mozilla Firefox. | |
| UI | Improved UI Hygiene We have improved various UI hygiene elements including spelling and grammar issues around the product. | |
| UI | Resource Summary Slide-out Enhancements We have included additional resource attributes in the summary slide-out including Traits, Custom Attributes, and Ticket Count. | |
| API Endpoint Changes | OpenAPI Specification | OpsRamp Public API Update OpsRamp API documentation has been enhanced for a better developer experience
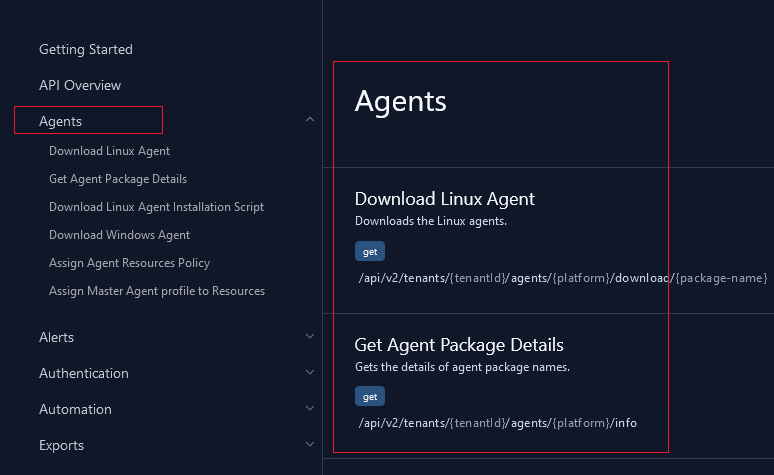
API updates “extResourceId” attribute in the Alert Create API endpoint for Azure cloud resources. Download Linux Agent scripts API endpoint support Ansible script type. Patch Status as new attribute in patch installed status. |
Week of January 6, 2022 (2022_W1)
| Update Type | Category | Change Description |
|---|---|---|
| Enhancements | Alert Management | Regex Support in Alert Escalation Policy ML Training Files for Subject and Description Training files for Alert Escalation Policies now support wildcarding through regular expressions for the Description and Subject fields. |
| Alert Management | Serial Number in Alert Notification Emails We have added the Serial Number attribute as an applicable token to alert email notifications. | |
| Integration Framework | OID File Import for SNMP Trap Monitor Configuration OID files can now be directly imported while configuring SNMP Trap Monitors. You can also select which OIDs to exclude and export a new CSV file that consists of only the desired OIDs. | |
| Patch Management | Include/Exclude Patches by Name in Patch Baselines Patch baseline creation now supports filtering by patch name. You can choose to either include or exclude specific patches. | |
| Resource Management | Resource UUID Attribute Available for Non-Monitorable Resources Non-monitorable resources now have an attribute called 'Resource UUID' that will display the unique identifier generated by OpsRamp. This attribute can be used in the Get Resource API to fetch more details about the resource. |