Week of December 07, 2023 (2023.11-U1)
UI Enhancements
Alert Details for different type of alerts
The Alert Details page has been enhanced to include the following additional information on the different alert types:
- Alert definition details
- Template name
- Metric details
- Logs chart
See Alerts 2.0 for more details.
View alert failure logs from Alert Definitions page
Users can now access the list of failure logs by clicking the View Failure Logs link from either the Alert Definitions listing page or the Definition Details page.


See Alert Definitions for more details.
Update to some integration configuration pages
The following integrations have undergone minor updates. These changes involve a logical organization of fields to enhance the overall readability of the forms.
- All public clouds
- SNMP
- WMI
- Linux
- Prometheus metrics
- Kubernetes
Core Platform Enhancements
Resource Groups support at the Partner level
On the Infrastructure Search page, partner users can now see the list of resource groups.
The Resource Groups link under Setup is planned for deprecation in the upcoming release.

Monitoring Management Enhancements
Metrics and Events export and import improvements
Import
Users have the capability to import metrics or events for a designated partner or client. It is now possible to adjust imported metrics or events, and these modifications will be visible to all users within the chosen scope.
Previously, metrics or events were imported globally, without the ability to update them.
Export
Users now have the ability to export all metrics or events to a single file, depending on the selected scope. When exporting metrics at the partner scope, only partner-specific metrics are included.
Previously, all metrics or events were exported to a single file, regardless of the Global, Service Provider, Partner, or Client scope.
See Import and Export Metrics and Import and Export Events for more details.
Metrics Engine Enhancements
Alert Definition – Action on open alerts
When a user modifies or deletes an alert definition, they will receive notifications regarding any active alerts associated with that definition. Depending on the confirmation received, all open alerts will be marked as obsolete.
See Alert Definitions for more details.
Event Management Enhancements
Alert custom attribute support in training file
The training file of Alert Escalation and First Response policies now supports custom attributes of resources and alerts as inputs.
See Custom Attributes for more details.
Incident Count on the Alert Escalation Policy page
The alert escalation policy page now displays the total count of alerts for which notifications were sent and incidents were created, removing the previous 24-hour restriction. Users can click on the count to view the details of the alerts.
Note
- The alerts count in this feature will take effect from the current release.
- Furthermore, deleting alerts will result in a corresponding reduction in the alert count.
See View Alert Escalation Policies for more details.
Customizable alert time zone token
Introduced tokens for Alert Created Time and Alert Updated Time in the Service Desk Integration Outbound Event.
These tokens allow users to customize the time zones as needed. The provided time zone and time format will ensure that a timestamp is provided in the same format to third-party tools.
See Integration Utility Tokens for more details.
SaaS Monitoring Enhancements
G2 Templates support for VeloCloud Integration
VeloCloud integration now supports G2 templates where users can use the templates and modify as per the supported operators for alerting and component filters.
See G2 Templates Support for more details.
Cloud-Native Monitoring Enhancements
Improvements on Prometheus Remote Write Integration
Prometheus Remote Write Integration page is now enhanced with instructions to make the configuration changes with provision to copy the YAML snippets.
See Prometheus Remote Write Integration for more details.
Cloud Monitoring Enhancements
AWS UI Onboarding Flow Improvements
The AWS configuration page now has improved access type terminology.

Added availability metrics to PostgreSQL Flexible Server
OpsRamp now supports additional metrics for the Azure PostgreSQL Flexible Server.
See Azure PostgreSQL Flexible Server for more details.
Tracing Enhancements
Overall Services Insights
Users can now access the Services/App insights through Quick Links in Tracing. The Application and Services pages provide insights into the performance of an application or service such as average latency, throughput, or any errors that occurred during the process.
Additionally, a new service insights overview page has been added that shows the insights grouped by transaction type. The page also displays the top 20 operations list based on latency, error rate, and throughput.


See Services and Applications for more details.
Traces Categorization
The Trace Insights feature is enhanced at the trace operation level to include more insights like trace count, latency (avg., median, p95, and p99) error count specific to trace operation. Additionally, it has the ability to compare the values with past data.


See Services for more details.
Traces Aggregation/Grouping
Enhanced the existing Trace Explorer page to include trace ingestion latency graph with root span’s view and added additional Service count, Spans count, and Error count information.

See View Traces for more details.
Tracing proxy instrumentation enhancements
Tracing-Proxy (above V17.0), the trace collector, can now distinguish and identify the traces category – whether it is a Web / Non-Web transaction, HTTP Call, Database call, Message Queue, or a Programming language.

See Trace Collection for more details.
Process Automation Enhancements
Rest Web Service functionality to be inline with firewall support
Previously, an attempt to execute any internal API blocked by the firewall was restricted.
Now, by enabling the Internal option during the integration event configuration you can execute internal APIs even if they are blocked by the firewall.

Added new token in start event filter criteria
Added new token in Start Event filter criteria for both alert and resource to filter the entity based on location value.
If the user selects a signal start event on an alert, they can filter the alert with resource location using token
$resource.location.name.If the user selects a signal start event on a resource, they can filter the resource with location using token
$location.name.Similarly, users can filter the alerts and resources based on location in “find alerts” and “find resources” tasks as well.
See Process Automation Variables for more details.
NTM Enhancements
Availability State for Non-Monitored Interfaces
Below are the various supported interface/link availability states:
UNDEFINED: If the interface resource does not have any monitor with metric “network.interface.status” applied on it.
DOWN: If the interface resource has a monitor with metric “network.interface.status” applied on it and has open critical alert against it.
DEGRADED: If the interface resource has a monitor with metric “network.interface.status” applied on it and has an open warning alert against it.
UP: If the interface resource has a monitor with metric “network.interface.status” applied on it and has no open critical/warning alert against it.
See Network Health Monitoring for more details.
Reporting Apps Enhancements
Role-based access control (RBAC) support
RBAC support has been integrated into the following Reporting Apps. Moving forward, report data generation will align with user roles and permissions.
- Alert listing
- Executive summary
- Ops 360 patching
- Patch details
- Ticket Insights
- Ticket Details
See Reporting Apps for more details.
Email Notification Improvements
Notifications have now been enabled for user group DL. Users can choose the required user groups from the drilldown menu when saving analysis or adding/editing the schedule to notify to the user group DL. User Group DL will receive notifications when the analysis has successfully completed or failed.
See Save the Analysis for more details.
Deprecation Tags to Classic Reports
The following classic reports will be moved to the reporting apps. Deprecation tags have been added to the below classic reports:
- Console Audit Recordings Report
- Alert Report
- Metric Report
- New Metric Report
- Network Statistics Report
See Deprecation Notices for more details.
Exports Enhancements
Alert Batch Export / Alert Streaming Export Improvements
NOC ID and NOC Name details have been included in the alert batch export and alert streaming export responses.
Week of November 06, 2023 (2023.10-U1)
UI Enhancements
Added Helm Based Deployment Option
OpsRamp has introduced new integrated installation guidelines within the collector UI page for deploying a Helm-based gateway.
This enhancement enables users to access instructions directly from the UI, simplifying the deployment process to save time.

New User Management Experience
As part of this release, Integration and Apps have been relocated to the Setup > Account section. The Account page allow users to managing the integrations, permissions, roles, users, user groups, and rosters.
Please note that the permissions, roles, users, user groups, and rosters links on the current classic setup page will be phased out in an upcoming release. The export functionality will not be supported on the User Listing page.

NTM UI Enhancements
This release includes a number of quality improvements for the new network topology UI such as adding a progress bar when loading a topology map, node style changes for better visibility, providing an option to turn off the synchronized tooltip for better usability, and other improvements to the new network topology for better usability.
See Network Health Monitoring for more details.
Dashboard 2.0 Enhancements
Dashboard Tile specific time-period
Users have the flexibility to define a specific time-period for Tiles that is independent from the dashboard’s overall time-period.

See Introduction to Tiles for more details.
Provided “External ticket ID” in Alert Tile
Users now have the option to incorporate an extra attribute into their alerts, allowing them to check whether the alert has triggered an incident in the external tool.
This feature enhances the ability to track and manage incident generation as a result of alerting actions visualization in Dashboards.
Navigation to the Log Explorer
Users can now seamlessly navigate from any metric tile, with the specific time frame and relevant tags, to the log explorer.
This simplifies the task of correlating metric data with log data, ensuring a streamlined and contextually relevant experience.

See Introduction to Tiles for more details.
Metrics Engine Enhancements
Metric Name length limit increased
The metric name size has been increased to 255 characters, and you can now utilize up to 10 underscores within this limit. Previously, only 100 characters were permitted with a maximum of 5 underscores.
With this extended limit, you can now create more descriptive metric names that accommodate various makes, models, and version details.
See Metric Name format for more details.
Tracing Enhancements
Configure Trace Ingestion Limit Governors
Users now have the option to set up a trace ingestion limit governor to receive alerts when the limit approaches its maximum capacity.
- A Warning alert will be triggered when the ingestion limit reaches 70% of its capacity.
- A Critical alert will be triggered when the ingestion limit reaches 90% of its capacity.
Event Management Enhancements
Enhancements in Alert Correlation Policy
In the Alert Correlation policy, a new Trigger condition feature has been introduced under the within time window setting. When you select this option, you will receive alerts that satisfy the filter condition and similarity conditions. However, the policy will not correlate the alerts until an alert that satisfies the selected trigger conditions is received. This will help customize the policy to correlate the alerts only when you get alerts on a particular metric or device.
See Correlation Policy for more details.
PromQL based Alert Definitions
Users now have the capability to create alerts for metrics by specifying a PromQL-based alert definition. It is possible to fine-tune warning and critical thresholds, and tailor the title and description of the resulting alert to suit specific needs.
See Alert Definitions for more details.
Cloud Monitoring Enhancements
Added AWS Account label name on Agent-based Metrics
OpsRamp has introduced a new set of account level labels for AWS, Azure, GCP, and Alibaba in both Cloud and Agent metrics. This new set of labels will allow users to filter metrics by account name or account id.
This inclusion of account-level labels in all existing metrics will result in a new set of metrics. The existing metric data stream will be phased out, and a new stream (account-level) labels will be added.
Log Management Enhancements
AWS Lambda Log Ingestion Support for AWS
To support Lambda log collection across all AWS regions, the Lambda layer code has been deployed to S3 buckets in all regions. Users can now send Lambda logs irrespective of the region.
Monitoring Management Enhancements
Windows Event Log Monitor - Template Scope
As part of G1-based Windows event log monitors, you now have a provision to add custom event logs at the template scope. This provides increased flexibility for creating, editing, and removing event log monitors to suit your specific needs.
Previously, all event log monitors were established at the global scope, and modifying or removing existing event logs was not possible, leading to the accumulation of multiple event logs.
With this recent update, all existing event logs will remain at the global scope, while any newly created event logs will be stored within the template scope.
See Set up Windows Event Logging for more details.
Introduced new data types and formulas, and modified a couple of formulas in SNMP monitor creation page
In the SNMP Monitor > Metrics section, the existing Delta and Rate options within the Formula segment will be substituted with CounterDelta and CounterRate. This adjustment is made to ensure consistency with other G2 gateway monitors. It is important to note that these alterations in display names will not impact the functionality of existing monitors within the gateway.
Moreover, two new formulas, Delta and Rate, are introduced in the Formula section. This introduction facilitates the handling of negative values in SNMP Delta and Rate calculations.
In addition to the above changes, three new Data Types – HexToDecimal, HexToString, and HexToIPAddress are added to handle and convert OID values from Hexadecimal to IP, String, and Decimal format.
See Snmp Configuration for more details.
Reports/Reporting Apps Enhancements
Provided Export Option in Infrastructure 2.0 Global Search Page
The export feature has been introduced within the infrastructure 2.0 global search page and resource category section. When a user selects this option, it automatically transfers the filter criteria to the asset inventory app, populating the configuration properties, and initiates the report.
Role-based access control (RBAC) Support
RBAC support has been integrated into the following Reporting apps. Moving forward, report data generation will align with user roles and permissions.
- Asset Insights
- Asset Inventory
- Availability Details
- Monitor Details
- Software Inventory
- Remote Control Usage
- Process Definition Insights
- Asset Insights
See Reporting Apps for more details.
Customize the Attribute Selection
In Reporting Apps, users can now use the drag-and-drop feature to reorganize columns in their preferred order, even after the default column selection has been applied. This feature is available in the apps where you have an option to configure the attribute selection.
Inventory Export Improvements
OpsRamp has Included ‘State’ and ‘Country’ attributes under location entity in the inventory export response.
See Inventory Batch Export for more details.
Alert Listing App Improvements
In the Alert Listing App, OpsQL now allows filtering alerts based on attributes such as resource groups, sites, service groups, NOC ID, or NOC name.
Added a new Batch Export “Tenants”
A new “Tenants” type has been introduced in the batch export. Users can now set up this export at the partner level, which provides partner details, client details within the partner.
See Tenants Batch Export for more details.
Alert 2.0 Enhancements
Enabled “Export” functionality in Alerts 2.0
Alert 2.0 has now incorporated an export functionality. Upon selecting this feature, it seamlessly transfers the filter criteria to the alert listing app, pre-populates the configuration properties, and initiates the report.
See Alerts 2.0 for more details.
Service Provider (SP) User Support
The new Alert Listing page now provides support for the service provider context. This means that service provider users can search for alerts across all clients within all partners.
See Alerts 2.0 for more details.
Integration Framework
Changes in Application Categories
The application category names have been revamped under Setup > Integrations and App and new category names added to reflect the recategorized apps.
This change ensures that the applications and integrations are appropriately placed in their respective categories and relocated certain applications to more suitable categories.Y
Deprecation Notices
Deprecated actionable menus from Infrastructure Page
Starting January, 2024, the following actionable menus in the classic infrastructure listing page will be removed from the UI:
- Add Pod
- WAN Link
- Sites
- SKU
- Templates
See Deprecation Notices for more details.
Deprecated Legacy widgets from Classic Dashboards
Starting January 2024, the following widgets will be deprecated in Classic Dashboards:
- Active live console stats
- Antivirus stats
- App integrations failures logs
- Cloud cost trend
- Cloud cost insight
- Inference stats
See Deprecation Notices for more details.
Removed Alert Priority Attributes from G1 Templates
The following Alert priority attributes are now deprecated from the following OpsRamp-supported monitors:
- Application Monitors
- Custom Monitors
- Event log monitors
- Log monitors
- Performance monitors
- Process Monitors
- SNMP monitors
See Deprecation Notices for more details.
Deprecated Legacy Discovery and Deployment Feature
The Legacy Discovery and Deployment feature under Setup > Resources > Discovery and Deployment is now deprecated. All associated actions from the user interface (UI) have been eliminated as part of the depreciation process.
See Deprecation Notices for more details.
Planned Changes
These feature changes are planned over the upcoming releases, so that you have advance information and continue to have a great product experience.
Resource Groups and Site Details
The Resource Groups and Site Details links will be moved from
Setup > Resources and will be available under Infrastructure > Search from December 2023.
Audit Logs
The Audit Logs links will be moved from Setup > Integrations > Audit Logs and will be available under Setup > Account > Integrations and Apps, against each integration, from January 2024.
Week of September 29, 2023 (2023.09-U1)
HPE GreenLake Platform
OpsRamp ITOM is now integrated into HPE GreenLake Platform (GLP) and all GLP users can now centrally access global OpsRamp ITOM SaaS from HPE GreenLake Platform.
See OpsRamp GLP documentation on how to become a GLP user and access OpsRamp via GLP.
Note: This GLP integration does not change how you access OpsRamp if you already have a user account in OpsRamp today. All existing OpsRamp users can continue to access OpsRamp directly as before.
Dashboard 2.0 Enhancements
Alert Tile Sites support in OpsQL
Users now have the ability to query sites in the resource and alert tiles using the ‘location’ and ‘resource.location’ attributes, respectively.
See Introduction to Tiles for more details.
Query-based Variable Values in Dashboard 2.0
Users can now define the list of values to be displayed for a variable using the “Filter” option from the variable manager. Configure a query and only values matching that query will be displayed in the dropdown when using a variable.

See Variable Filters for more details.
UI Enhancements
Enhancements to Resource Overview Page Categories
On the Resource Overview page:
- Categories are now sorted in alphabetical order.
- ‘Synthetics’ has been relocated to the ‘Web Services’ category.
- ‘OpsRamp Gateway’ is now listed within the ‘Collectors’ category, no longer appearing in the ‘Others’ section.

See Infrastructure Search for more details.
Search option for Resource Groups & Sites
The new Infrastructure UI now includes a total of three different perspectives for viewing resources:
- Resource Categories
- Resource Groups
- Sites
Navigate to Infrastructure > Search, and click ‘Resource Categories’ dropdown from the left pane. Click ‘Groups or Sites’ and use the search icon to search across Groups and Sites.

See Resource Overview for more details.
New rosters screen for managing rosters
Within the Setup section, you will find a link on the existing roster screen that seamlessly directs users to the new roster screen, simplifying roster management.
In the new roster UI, the following options are no longer supported:
- Yearly recurring schedules. Use monthly recurring schedules instead.
- Recurring schedules that end after x number of occurrences. Specify exact end dates instead.
- Scheduling time that include seconds.
- Bulk remove.
- Business users.
All existing schedules will continue to work unless they are updated in the new UI.
Note: The old roster UI will be removed in an upcoming release.

See New Rosters Page for more details.
Reporting Apps
Ticket Insights Application
OpsRamp has introduced a new application named “Ticket Insights”, designed to offer trends and breakdown of your ITSM tickets in a graphical representation.
See Ticket Insight for more details.
Ticket Details Application
OpsRamp has introduced a new application named “Ticket Details” which provides detailed information about the progression of your ITSM tickets over the specified time period.
See Ticket Details for more details.
Service Maps
Save the node type in the Service Map
In the Service Map, when creating a service group and adding resources, the Node Type drop-down list now displays the supported nodes. The selected Node Type will now be saved along with the Resource Type.
Prior to this update, the Node Type was not preserved, leading to mapping problems for resource types associated with multiple node types. This enhancement ensures that both Node Type and Resource Type selections are accurately saved.

Service Management
Set the default priority defined by the user
Users can customize the default priority displayed in the ticket form through the Service Desk settings. The selected priority will now be automatically pre-filled when a user creates a new ticket.
Note: You can access this feature via the Setup Menu > Service Desk > Settings.

See Service Desk for more details.
Cloud Monitoring
DBload metric support for AWS RDS
OpsRamp now supports the following DBLoad metrics for AWS RDS:
- aws_rds_DBLoad
- aws_rds_DBLoadCPU
- aws_rds_DBLoadNonCPU
See AWS RDS for more details.
Log Management Enhancement
Configure default app and log definitions from UI
Users can now configure app definitions from the UI to discover custom apps from their environment or change the configuration for any existing applications. For example: changing the port number for detecting Apache so that the agent can pick up Apache on that new port number.
Additionally, users can configure log definitions from the UI and push them to the agent for out-of-the-box applications as well as for any custom apps they’ve defined with an app definition.
Both of these sections are in new tabs in the Log Management configuration UI as seen below.

See App Definitions for more details.
Metrics Engine
Metric and Alert Processing Graphic Representation
The Health Portal has been enhanced to provide in-depth insights into Metrics 2.0 Processing latency. Additionally, in the Health Monitor section for Pod availability, you can now visualize web response times graphically, improving the visibility of the platform’s overall health status.

See Platform Health Monitor for more details.
Week of August 29, 2023 (2023.08-U1)
Dashboard 2.0 Enhancements
Deprecation Notice - Classic Dashboards Widgets
Effective Date: October 2023Announcement Date: August 2023
As of the effective date:
The following widgets will be deprecated in Classic Dashboards:
- Forward Schedule Change Widget
- Project Widget
- Task Widget
- Activity Log Widget
- Custom Attribute Widget
You can still use the widgets that have already been created. After the deprecation date, you will not be able to create new instances of the above widgets.
Additionally, the capability to choose all resources in the Metric List widget will no longer be supported. Instead, only the top 20 resources will be visible in any current widgets. In new instances of the Metric List widget, the option to select All Resources will be completely removed after the deprecation date.
Dashboards that currently use these widgets might encounter reduced support and potential compatibility problems in upcoming times. Should you have any inquiries or require aid, feel free to get in touch with the OpsRamp support team.
Launch NPM Dashboards from Network Topology Management (NTM)
The release of ITOM enables two new network-specific topology and performance management features. Both these are controlled access features available only to select customers who wish to gain early access to OpsRamp’s latest advances in Network Observability.
Please contact OpsRamp Support if you wish to access either of these two new features. Both these features are accessible from the resource slide-out for network-type devices in the Topology view.
- The View Topology option will direct you to the newly introduced topology screen.
- The View network performance option will direct you to the NPM dashboard for that specific resource.

Service widget available at client level
The support to create a Service widget is now available at the client level. You will also be able to view the Up Time and Sub-services checkbox when you select the dropdown during the configuration of the tile.

See Create a Metric Tile for more details.
Mapping values to strings - Custom Labels
Users can create multiple thresholds and can leverage different graph colors and metrics labels in the Metric widget to visually distinguish different thresholds. This feature applies to all visualizations (except for line/bar chart visualization) and can be used to map numeric values to specific status labels for status metrics.

See Create a Metric Tile for more details.
Metric widget in Dashboards with servicegroup tag
The metric widget in Dashboards now has the servicegroup tag. This servicegroup tag is listed when selecting metric filters while creating a query.
The metric widget shows the metric details based on the service map.

See Create a Metric Tile for more details.
UI enhancements
Updated tenant selector
The tenant selector in the navigation bar has been updated to provide easier navigation. Users can now choose the Client from the selection dropdown displayed under the Partner section.

Cloud Monitoring Enhancements
Azure Billing collection via CostManagement API
The Azure billing information is now being collected through Cost Management for Azure APIs and is more focused on providing the users with insights into actual usage and costs within the Azure subscriptions.
The users will be able to view the monthly billing data and can also filter the data by service, region, and resource groups in the dashboard widgets.
Network Topology Management (NTM)
Introduced Network Health Monitoring feature
OpsRamp introduced an enhanced UI for our Network Topology feature, now available in beta. This revamped UI not only comes with a sleeker design but also incorporates significant improvements in the backend engine. You’ll find advanced features that enhance your experience as you explore this new interface.
One notable enhancement is the dynamic information that appears as you hover over any link or edge in the topology. This feature provides instant insights into network components' relationships and connections.
Additionally, we have introduced a comprehensive health monitoring feature. By leveraging the templates assigned to each node, this functionality delivers real-time statistics about the health and performance of edges and nodes. This empowers you to proactively identify and address potential issues before they impact your network.
A particularly valuable aspect of this update is the glimpse it offers into node alert statistics. Each node now provides a snapshot of its alert status, allowing you to quickly assess any critical alerts that might require your attention.
Network Performance Management (NPM)
NPM utilizes flow technologies (sFlow, NetFlow v5/9, and IPFIX) to gain insight into network performance providing end-to-end visibility. With the ability to drill down to network hotspots, NPM enables Network Administrators to proactively handle network-based performance issues and plan for capacity updates. NPM is available as a Beta feature.
NPM depends on a Flow Collector Integration to be installed and provides out-of-the-box dashboards for Top Talkers with respect to the Conversations, Protocols, etc.
See Network Performance Management - Beta for more details.
Event Management Enhancements
Provided Detected Alert Sequence Patterns link
The Detected Alert Sequence Patterns link has been moved from the Alert Correlation Policy details page to the policy listing page.
This link is visible only if there are one or more correlation policies enabled for the ML correlation. The users can choose the client from the list of clients on the Alert Correlation Policy page to view the respective ML-detected alert sequence patterns.

Export the alert sequence patterns
Users can download the alert sequence patterns from the Alert Correlation Policy page using the Export option.

Reporting Apps Enhancements
Asset Inventory App improvements
- Added configurable columns in the Asset Inventory App for the hardware properties for CPU, Disk, and Memory resources. The users can now access this data from reports.
- The agent installation time attribute has been added to the Asset Inventory app so that users can retrieve the report based on the time of agent installation. If the agent is reinstalled, the first report of the agent installation will be used for comparison with the updated one.
- The new External Client ID column has been added in the Asset Inventory app. The users can search with External Client ID and can view the attribute value in the report by selecting it as a column.
- The management profile attributes contain columns for management profiles in the Asset Inventory app. The users can use the app to view their management profile information and access it as a report.
Resource attributes support in Monitor details application
The Monitor details app now supports resource attributes in OpsQL search. The user can search for monitor information and obtain the details by choosing these attributes as columns in the application.
Monitoring Management enhancements
Deprecate auto monitoring synthetics templates
OpsRamp is planning to deprecate the legacy Synthetics templates from all production PODs and replace them with new templates.
See Deprecation Notices for more details.
Alert priority attributes removed from G1 templates
As announced in the Deprecation Notices, OpsRamp decided to deprecate the alert priority options from UI in October 2023.
As an alternate, you can set priority to alert notifications and incidents from the Alert Escalation policy.
Service Management enhancements
Configure Status Flows at client level
At the Client level, users have the option to configure status flows in the service desk for different ticket types that are available at the partner level as well.
The Conversation option provided in the ticket search
A Conversation field is now available for business users as part of the search criteria to search for the information under the Service Desk.
Resource Management enhancements
Group resources by type in the Overview page
On the Resource Overview page, resources are grouped based on their native type, by default. On the resource search page, resources are grouped by their availability.
See Resource Overview for more details.
App Framework enhancements
Retain the agent-installed resources while uninstalling the Apps
When attempting to uninstall the SDK application, you now have the choice to retain the agent-installed resources. Earlier, this option was accessible only during the uninstallation of VMware integration, it has now been expanded to include other applications in this release. This feature enables you to uninstall the application while preserving the agent-installed resources in the inventory.

Monitoring Management enhancements
Generate alert for the resources with unknown availability state
A client-level critical alert will be generated every 30 minutes if a resource availability state changes to the UNKNOWN state.
The critical alert contains the link to the list of resources that have no monitoring data for the last 30 minutes. When you click the link, the Infrastructure > Resources page is displayed with the list of affected resources.
The alert is auto healed when all the resources in the alert move out of the UNKNOWN state.
See Resource Availability for more details.
Incorrect configuration parameters reflected on the existing templates
The following are the resolved configuration parameter-related issues that arise when making modifications to the templates:
Add a new monitor with configuration parameters to the existing template:
When you add a new monitor with configuration parameters to the existing template, the new parameters are pushed to all the resources associated with the template. Prior to this, the newly added parameters were not pushed to the resources.
Removing an existing monitor and adding a new monitor with configuration parameters to the template:
When you remove an existing monitor from the template and add a new monitor with configuration parameters, the old configurations are removed from all the resources associated with that template and the new configuration parameters will be pushed. Prior to this, the newly added parameters were not pushed to the resources.
Device management policy view template configuration parameters:
When you remove the existing monitor from the template, the configuration parameters for that monitor will be removed from the device management policy view page. Prior to this, the device management view page still showed the configuration parameter from the removed monitor.
API Framework Enhancements
API updates
- APIs to search and assign templates have been updated to support additional SaaS Application collector type. See API documentation for more information.
- APIs to manage templates have been updated to support the additional ChangeDetection and Forecast threshold types. See API documentation for more information.
Week of July 28, 2023 (2023.07-U1)
Dashboard 2.0 Enhancements
Y-Axis Scaling for Different Metric Ranges
In metric graphs on Dashboard 2.0, the Y-axis will dynamically adjust when multiple queries are added, enabling effective comparison between queries with different ranges of values.
See Create a Metric Tile for more information.
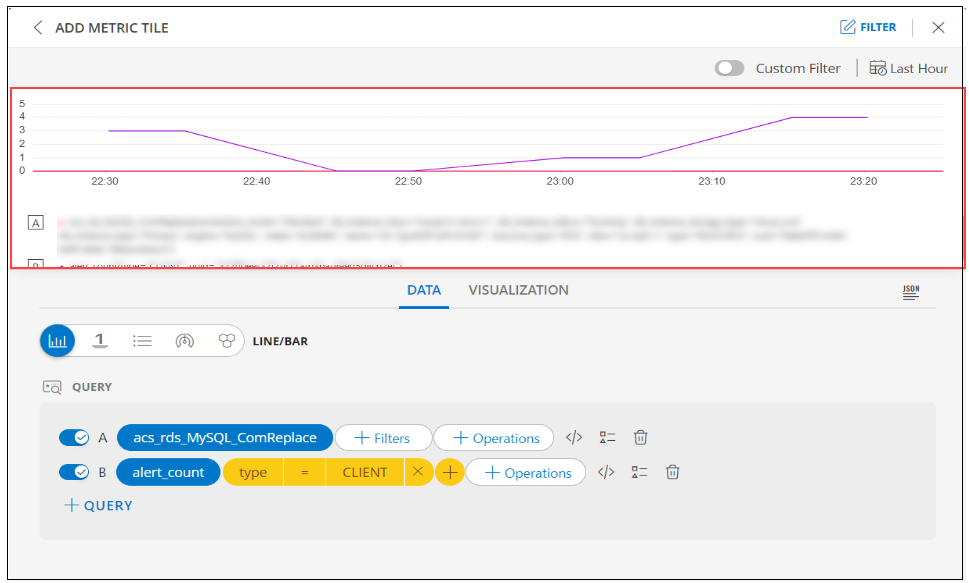
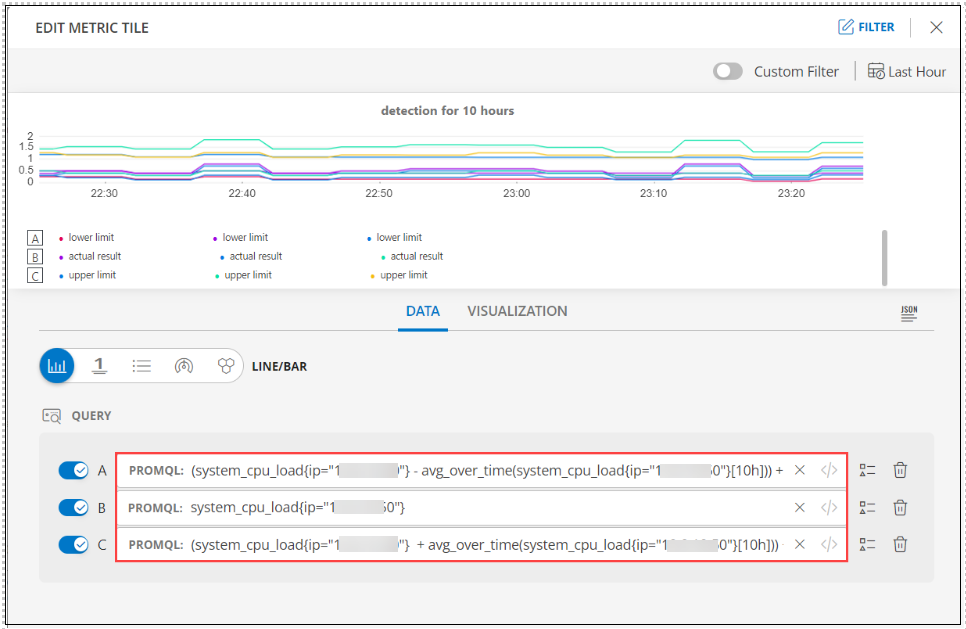
Enhanced metric tile widget for Change Detection
The existing metric tile widget has been enhanced to visualize change detection patterns. Users can now add more than two PromQL queries to customize and visualize the change detection time series.
See Create a Metric Tile for more information.
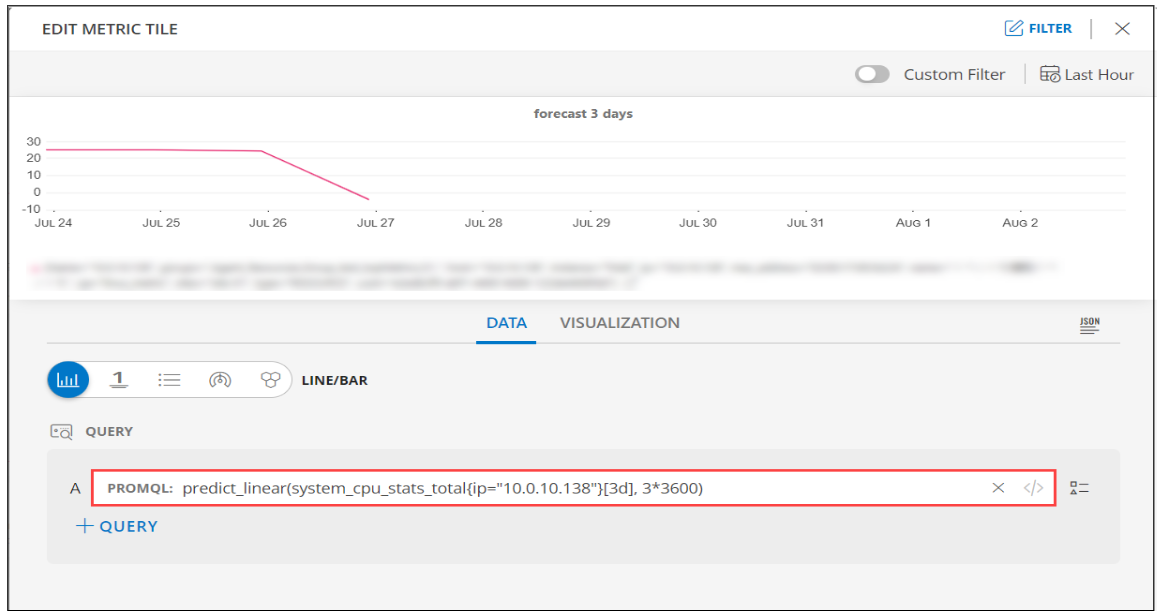
Enhanced metric tile widget for Forecasting
The existing metric tile widget has been enhanced to visualize forecasted metric series. The enhanced metric tile widget now provides flexibility for the users to specify a Prometheus prediction query expression, enabling them to visualize the forecasted value of time series data for the given metric.
See Create a Metric Tile for more information.
Core Platform Enhancements
Auto unlock support is provided for locked SSO users
When a user has been authenticated by an IdP and is logging into OpsRamp via SSO and their local user account in OpsRamp is locked for any reason, the system automatically unlocks the local shadow account, allowing the user to successfully access OpsRamp.
Network Topology Management (NTM)
Gateway enhancements and Network Topology rendering updates
- Network Topology Maps are now enhanced to show more streamlined icons and views. All Icons are updated.
- The Maps show Layer1 and Layer3 views of the network. Layer3 subnets are explicitly highlighted.
- The Maps show port-channel details (for Cisco and Arista devices), with the ability to expand and collapse component links.
- Network devices can now be searched for and found on the Network Topology Map page.
- Actions (for example, schedule a backup job) on the network devices can now be initiated from Topology View.
- Network Topology maps provide different styles to accommodate viewing specific network layouts.
See Network Topology Management - Beta for more information.
Log Management Enhancements
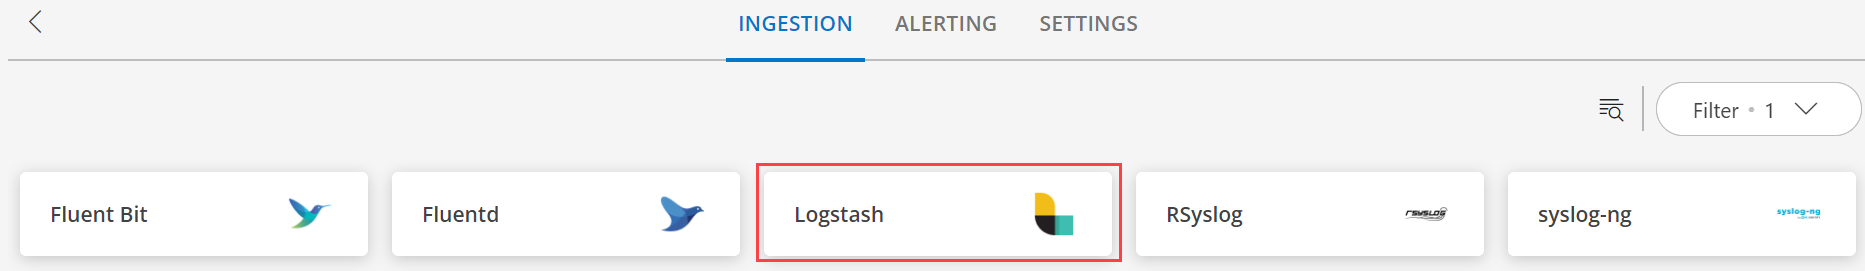
Logstash Log Forwarder Support
OpsRamp Observability solution has been enhanced to ingest from Logstash logs aggregator. This will allow users to forward logs directly from Logstash to OpsRamp.
See Available Integrations for more information.
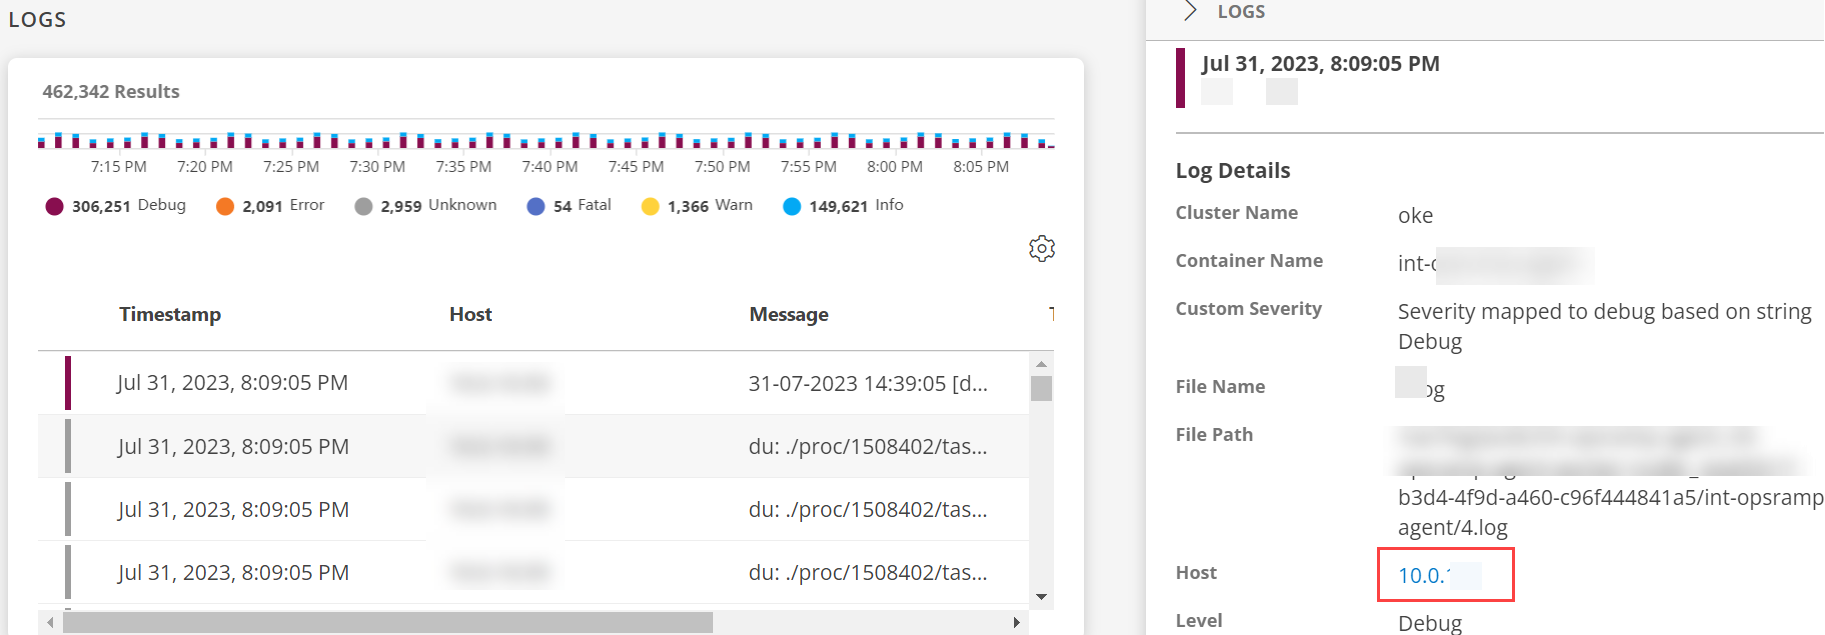
Resource drill down from Logs Viewer
The resource details page can be accessed by clicking the host field in the Logs slide-out.
Note: The host field is clickable only when the resource is available and has an agent installed.
See View Logs for more information.
Reporting Apps Enhancements
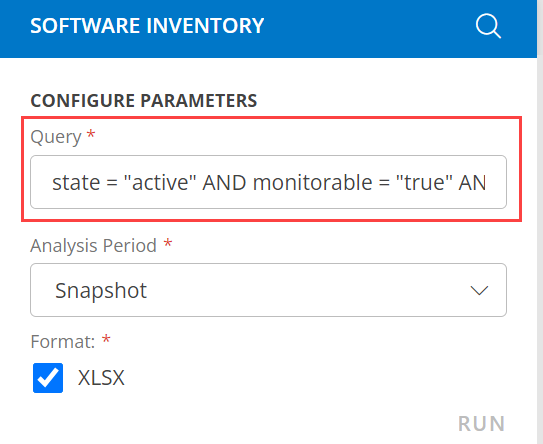
Software Inventory App Improvements
The Software Inventory App now includes OpsQL query filter support. Using this query filter, the user can filter the desired resources and view a detailed list of installed applications and services on those resources.
See Software Inventory App for more information.
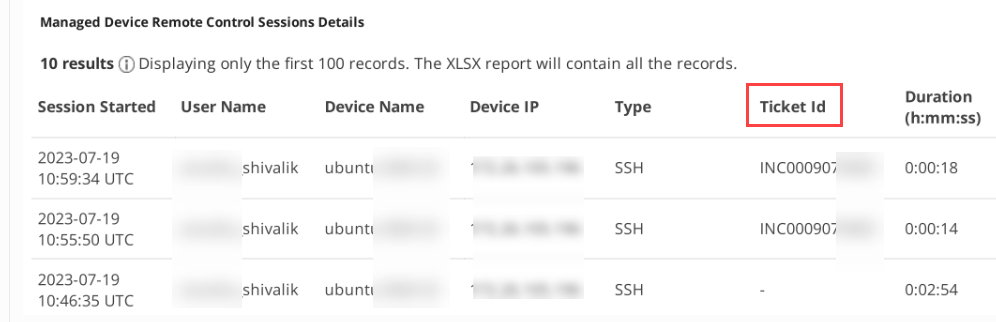
Remote Console Usage App Improvements
A new Ticket Id column is added in the ‘Managed Device Remote Control Sessions Details’ section of the results page. This enhancement allows users to easily identify the specific request for which the remote console session was utilized.
See Remote Console Usage App for more information.
Exports Enhancements
Metric Batch Export Improvements
The Metric Batch Export now supports a new JSON data format (v2) for configuration. This format significantly enhances the capabilities of Metric Batch Export functionality, providing users with greater flexibility in configuring the export settings.
Note: Users can still use the older JSON format (v1) for configuring the Metric Batch Export, but it will be deprecated in future releases.
See JSON Schema Reference for more information.
Patch Management Enhancements
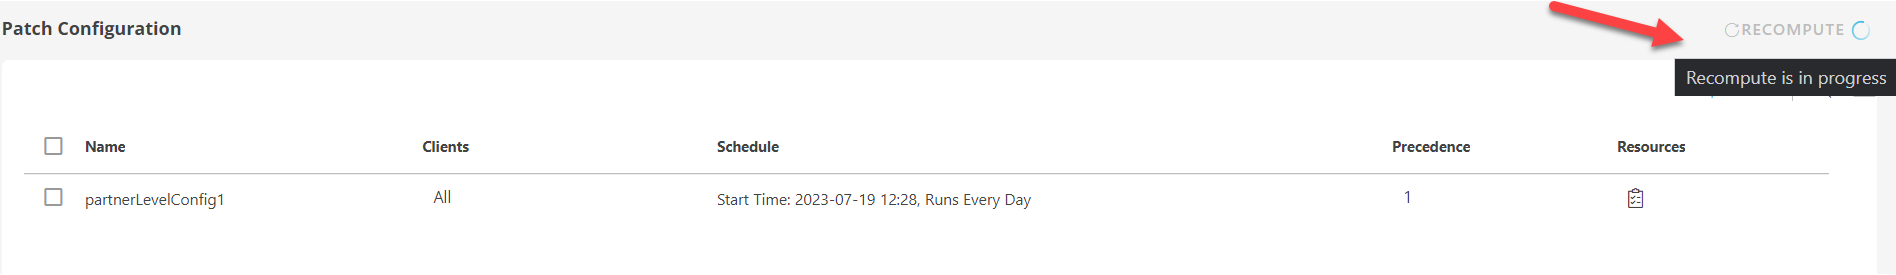
Recompute functionality improvements
The recompute icon now displays a loader, visually indicating the ongoing status of the recompute process.
See Patch Configuration for more information.
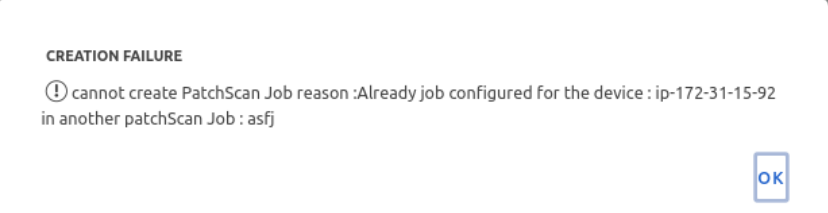
An enhanced error message for patch scan job
Previously, the patch scan job error message only provided the device UUID, causing difficulty for the user to identify the device. However, the error message now has been improved to include the device name and the corresponding job name, making it easier for user to recognize the device and its associated configurations.
API Framework Enhancements
API to manage users has been updated to support user termination.
See API documentation for more information.
API to get resource details has been updated to support native type as an attribute.
See API documentation for more information.
Alert Policies APIs (alert correlation policy, first response policy, alert escalation policy, alert prediction policy) have been updated to support tag (custom attributes) based filters.
See API documentation for more information
Week of June 30, 2023 (2023.06-U1)
Network Configuration Management (NCM)
Modern enterprise networks are Hybrid and multi-vendor spanning across geographic locations. The network configuration compliance is vital to ensure operational and performance goals as well as security goals. Compliance may also involve adhering to latest industry standards like HIPAA and other standards.
OpsRamp’s NCM offers a policy-based solution that monitors network configuration of all the network devices in a centralized location. It provides a Governance model to enable network admin to remediate configuration drift and remain compliant.
The following are the key functionalities of NCM:
- Automated and Scheduled Network Configuration backup.
- Notification on variances between configurations on a resource.
- Manual and policy-based restoration to Baseline Configuration.
- Policy-based Network Configuration Compliance.
- Policy-based Remediation with Governance Model.
- Dashboards for Compliance and Remediation Tasks.
- Configurable Compliance and Remediation workflows with process automation.
NCM Feature is now available for Arista products as an Early Access Beta.
See Network Configuration Management for more details.
Traces
We are thrilled to announce the release of our Tracing Product!
This solution enables developers and operations teams to gain deeper insight into their distributed systems and identify performance bottlenecks with ease.
The following are the key functionalities of Traces:
Distributed Tracing:
- Our Tracing Product now offers comprehensive distributed tracing capabilities, allowing you to trace requests as they flow through various components of your system.
- Gain end-to-end visibility into the entire request lifecycle, spanning across microservices, APIs, and external dependencies.
- Identify latency issues, track request flows, and pinpoint bottlenecks to optimize performance and improve user experience.
- Out-of-the-box trace metrics allow you to reduce time-to-value with tracing data. Quickly graph them on Dashboards and slide and dice your metrics based on predefined tags.
Tracing Visualization:
- We have introduced a powerful and intuitive tracing visualization interface, providing a holistic view of your system’s behavior and performance.
- Easily navigate and explore individual trace requests, flame graphs, and service insight pages with golden signal metric visualizations.
OpenTelemetry Integration:
- Our Tracing Product is built to use OpenTelemetry, an open-source observability framework, to provide a standardized, vendor-agnostic, and industry-standard solution for distributed tracing.
- Leverage the power of OpenTelemetry’s rich instrumentation libraries and SDKs to effortlessly instrument your applications and capture trace data.
- By using OpenTelemetry with our Tracing Product, you can ensure compatibility with a wide range of programming languages, frameworks, and cloud environments.
- Benefit from the flexibility and extensibility of OpenTelemetry, allowing you to customize and extend the tracing capabilities according to your specific requirements.
Enhanced Search and Filtering:
- We have introduced advanced search and filtering capabilities within the Tracing Product to help you efficiently navigate and analyze large volumes of trace data.
- Quickly search for specific traces based on custom criteria such as service names, resource names, or applications.
- Apply filters to focus on specific time ranges, error types, or other relevant attributes, making troubleshooting and analysis faster and more effective.
See Trace Management for more details.
UI enhancements
Enhanced classic DNM integrations in new integration UI page
The integration UI page has been updated to include all the classic discovery and monitoring integrations. Users can perform all the integration related tasks such as installation, uninstallation, and discovery from this comprehensive page. This update streamlines the management of integration tasks from a single location.
The global navbar has a new design
The global navbar has been redesigned with a narrower layout, allowing for more space for page content. This change improves readability and user experience by reducing the need for excessive scrolling and line breaks.
Core Platform Enhancements
Introduced Data Retention Period for Network Configuration Backup Files
OpsRamp has implemented a data retention period of 12 months for the network configuration backup files. As a result, all network configuration backups will now be stored for a maximum of 12 months and any data exceeding this period will be automatically deleted from our systems.
This will allow users to effectively manage network configuration backup files and prioritize the data security by reducing the storage of unnecessary files.
Log Management Enhancements
Provided Manage Logs Permission
Log Management now offers two levels of permissions: Log View and Log Manage.
This allows users to effectively control and modify Log Management settings.
- By default, the Log View is assigned to all administrators and users.
- The Log Manage permission is assigned to Service Provider, Partner and Client Adminstrators by default. Only users with the Log Manage permission can edit log configuration settings like retention policy, ingestion limit, enable/disable agent logs.

See Log Management for more details.
Added new property to enable logs ingestion on all agents
Administrators now have an additional level of control when enabling Log Management for the first time. During the initial setup, they can either enable or disable all agents (The Disable all agents option is selected by default).
This feature empowers administrators to effectively manage and regulate the potential influx of a significant volume of logs, ensuring smoother control over the log ingestion process.
See Enable Log Management for more details.
Provided multiple retention periods for logs
This enhancement offers users increased flexibility in log retention management. When configuring log retention settings, users now have the option to choose from three different retention periods: 7 days, 15 days, and 30 days (15 days is the default retention period).
This update allows users to align their log retention strategy with their specific needs and compliance requirements.

See Logs Retention for more details.
Patch Management Enhancements
Patching support for Gateway devices
The patch configuration now allows you to select Gateway resources (Windows and NextGen Linux). This means when configuring patches, you can choose to include Windows Gateways and NextGen Linux Gateways resources which have the Agent installed. However, this functionality does not apply to Classic Gateways.
This enhancement allows users to apply patches and updates to their Gateway resources, ensuring they are secure and up to date.

See Patch Configuration for more details.
Resource Management Enhancements
Bypass resource reconciliation between multiple apps
A new option called Bypass Resource Reconciliation has been added while configuring an integration. Users can select this option, if they wish to bypass resource reconciliation when encountering the same resources discovered by multiple apps. It implies that even if two different apps provide identical discovery attributes, two separate resources will be generated with those respective attributes from the individual discoveries.
Event Management Enhancements
Included additional Alert Filter in the Alert Custom Attributes
OpsRamp has enhanced the capabilities of Alert Custom Attributes by supporting additional alert filters. This update provides users with the ability to save custom attribute values for each alert and search using multiple custom attributes.
Provided Alert Precedence in the Alert Escalation policy
This enhancement allows users to set alert precedence for the alert escalation policies. Users can now edit the existing policies that do not have a precedence and assign precedence to them.
When an alert matches more than one policy, the policies that have precedence will be executed first. This allows users to streamline alert management and ensure critical actions or notifications are prioritized.

Service Maps Enhancements
Service map listing page with updated user and time details
The service map listing page now displays accurate “Last Modified By” and “Last Modified Time” details for any changes made to the service map, including modifications to both the root node and its child nodes.
Previously, changes to the child node were not considered as modifications, but now all modifications are appropriately recorded with the corresponding user and timestamp information.
Update the existing service map using the import feature
This new feature allows you to replace an existing service map with a newly imported one. Previously, importing a service map with the same name as an existing one was not permitted. As a result, users had to delete the existing service map before importing the updated version.
Users can now work on service maps in their pre-production client and import the same service map multiple times into the production client, even if they have the same name, without the need to delete the existing service map. This functionality is available both through the UI and the API.
Service map nodes tagged with the highest parent (top level node)
Service map nodes are now tagged with the parent/root node of the service map. This enhancement provides users with a unique identification mechanism for services in the Service Availability widget found in Dashboard 2.0.
Additionally, it resolves the issue of duplicates in the widget that may arise when there are multiple service nodes sharing the same name across different service maps.
Cloud Monitoring Enhancements
Support for Monitoring Azure Cosmos DB for PostgreSQL Cluster
OpsRamp now supports the discovery and monitoring of Azure Cosmos DB for PostgreSQL Cluster. This new capability allows users to seamlessly integrate and manage their Azure Cosmos DB deployments that utilize the PostgreSQL API.
See Azure Cosmos DB for PostgreSQL Clusters for more details.
Support for Azure Database for MySQL flexible server
OpsRamp now supports the discovery and monitoring of Azure Database for MySQL flexible servers. This new capability allows users to seamlessly integrate and manage their Azure Database for MySQL flexible server instances within the platform.
See Azure DB for MySQL Flexible Server for more details.
Dashboard 2.0 Enhancements
Dashboard 2.0 widget updated for device group count
The following dashboard list visualizations enhancement provides users with greater flexibility and control over the displayed columns:
Enable or Disable “Resource Count” column in List View:
This feature allows users to enable or disable the “Resource Count” column in the list view when utilizing multiple groups by options.
Introducing “Group Count” Column:
In addition, added a new column called “Group Count” to the list visualization. This column displays the total count of the secondary “group by” attribute (in the screenshot above, it shows the count of devicGroups.name).
See Create a Service Tile for more details.
Drill down to the service map from the Service widget
The Service Widget now includes a new feature called “View Service”. Users can simply click on the “View Service” option in the hover tooltip to see the alerts for a particular service.
This feature conveniently redirects users to the service map, enabling them to quickly explore and stay updated on the status of the service.

See Create a Ticket Tile for more details.
Reporting Apps Enhancements
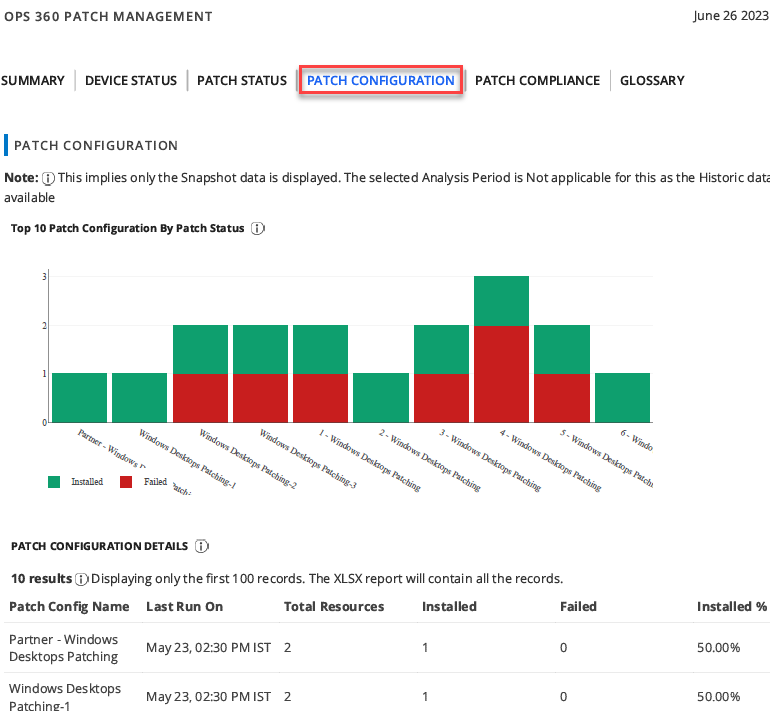
Ops 360 for patching app
The Ops 360 for Patching app now has been updated with the following changes:
- The app now includes “Patch Configuration” information and displays the percentage of patches installed. This addition provides users with valuable insights into the patching process and allows them to track the progress of installed patches.
- The Blacklisted Patches related information has been removed from the Ops 360 app, and users can now access it directly through the Patch Details app.

See OPS 360 for Patching for more details.
API Framework Enhancements
API response included the SSO tenant prefix
The “getInstalledIntegration'' API response now includes the SSO tenant prefix. You can access the information using the following sample endpoint format:https://{{base-url}}/api/v2/tenants/{{tenant}}/integrations/installed/{{installedIntgId}}
This endpoint structure allows users to retrieve information about installed integrations specific to their SSO tenant.
Week of May 28, 2023 (2023.05-U1)
Dashboard 2.0 Enhancements
Introduced All Alerts Option in Alert Tile
Users can now view alerts independent of the dashboard time frame by selecting the ‘All Alerts’ option in the Alert tile.
Note: This option will display alerts that are outside the set dashboard time frame.

See Introduction to Tiles for more details.
Hide/Unhide count column in list visualization
Users now have the ability to selectively hide or unhide the count column in the list visualization on Dashboard 2.0 widgets. This enhancement allows for more visually engaging dashboards, giving users greater control over the displayed information.


See Introduction to Tiles for more details.
Display tags relevant to metrics and values relevant to tags
When constructing the query for a metric tile, users will now only see tags that are relevant to the selected metric, instead of displaying all tags across all metrics.
Monitoring Integration
Prometheus Remote Write Integration
Introducing a new integration that enables you to push Prometheus metrics to OpsRamp Cloud. You can now effortlessly configure the OpsRamp endpoint on your servers, enabling seamless data transfer and enhancing your monitoring capabilities.

Cloud Monitoring Enhancements
Updated Azure Virtual Machine metrics
OpsRamp Azure Virtual Machine metrics has been enhanced to include the latest metrics in accordance with Azure’s documentation.
Note: This also includes the deprecation of metrics that are no longer supported.
See Azure Virtual Machine for more details.
Upgraded Azure API version
We have updated the API versions for Azure REST APIs.
Updated GCP SDK to latest version
We have updated the Google Java SDK.
Monitoring Management Enhancements
Health check template for private synthetic collector
OpsRamp has introduced a new monitoring template called “OpsRamp Synthetic Service Status”. This template enables the monitoring of the health of private synthetic collectors.
From gateway version 15.0.0 onwards, this monitoring template will be automatically applied to the gateway, so the users will be notified if there are any health issues with the private collectors.
Metric names standardization
As part of the metric name standardization, the metric definition process has been enhanced for strict adherence to naming conventions. Moving forward, when defining a new metric, you will only be allowed to use the underscore character (_) and not the dot (.).
See Create a Metric for more details.
Patch Management
Remove patch limit from approval
The Patch Approve workflow process in the service task can now approve all matched patches in a single instance, streamlining the approval process.
Provided next run details for Patch Configuration and Scan jobs
Enhanced the display of patch trigger details for Patch Configuration and Patch Scan jobs by introducing a new tab called “Next Run”. This tab now includes the following information:
- Time Zone
- Next Fire Time
- Last Fire Time
- List of Devices This improvement allows users to easily check the next scheduled run time for a particular scheduled job.

Reports Enhancements
Patch Details application enhancement
In the Patch Details application, the query filter will now pre-populate with the default query. This allows you to either use the provided query or modify it according to your specific requirements and generate a customized report.

See Patch Details for more details.
Restyle reporting apps to conform to OpsRamp Design Standards
The latest updated CSS styles to the Reporting Apps significantly enhance the user interface, offering a more visually appealing and modern experience.
Metric insight reporting app improvements
Users now have the ability to select the data format of the Metric Insights reporting app. The app now supports three different data formats:
- Consolidated List
- Metric Wise
- Consolidated List and Metric Wise.

See Metric Insight App for more details.
Notification for failed scheduled report runs
Users can now opt to receive notifications for any failed schedule runs. This feature will enable you to take immediate action on failed reporting runs, improving your ability to troubleshoot and resolve issues.

See Reporting Apps for more details.
New Email template for successful schedule report run
The format of the successful schedule-run notification template for reporting apps has been modified. You will now receive notifications in a new template format.
Security Enhancements
View simultaneous sessions of logged-in user
Users will now have the ability to view their active sessions and, if necessary, log out of these sessions directly by navigating to My Profile page -> Login Activity.

See My Profile for more details.
Core Platform Enhancements
Synthetics resources listing page enhancements
We have implemented optimizations to improve the performance of the synthetic listing and details page that enhances the overall performance of the synthetic feature.
Additionally, we made a minor UI update to the “Last Updated” label. When monitoring is stopped on a synthetics resources for more than 7 days, the label will display “More than a week ago” instead of the previous location-specific timestamp (e.g., “Atlanta, GA, USA | 2 years 11 months”).
Network Topology View Enhancements
Network Topology is now treated as a new category of Topologies paving the way for additional functionality in the future. Network Topology view provides the ability to select a seed node and retrieve topologies to a selected depth.
Network Topologies provide the following enhancements:
- Device discovery and default view rendering.
- Ability to rearrange the view manually (for example, Leaf-Spine, Clos).
- Save the rearranged view.
- Retrieve a saved view with an ability to refresh the view for real time updates.
- Share such views with other users in the same Client Scope.
See Network Topology Management for more details.
Inclusion of non-monitoring interfaces in SNMP Traps
The ‘Process all Interface traps’ checkbox, introduced in SNMP configurations, allows you to disable non-monitoring SNMP trap interfaces. By default, it is set to false, ensuring a smooth transition for existing configurations.

See SNMP Traps for more details.
Log Management Enhancements
Configure Alerts from the Log Explorer
You can now configure alert definitions directly from the log explorer page on the data you have already filtered. There is a button to create an alert next to the filters.
Log Alert Healing Capability for Selected Conditions
This feature enables the healing of log alerts under the following conditions:
- No logs found.
- A defined message is found after a critical or warning alert.

Resource Management Enhancements
Added support for update of user access type
Users now have the flexibility to switch between access types, either from the portal to the API or vice versa.
Note: At least one access type, either through the portal or API, must be enabled for each user
See Users for more details.
Expanded Permissions to Manage Schedule Maintenance
The option ‘Escalate Maintenance alerts when window ends’ will now be visible to all users who have ‘Manage schedule maintenance’ permission.
Earlier, the users who had OpsQ Manage permissions could view the ‘Escalate Maintenance alerts when window ends’ option in the scheduled maintenance window.

Unmonitored resource category
You can now find the new category UNMONITORED on the Infrastructure -> Search page. This category displays all the resources that are not monitored by OpsRamp. Previously, these resources were listed under the NULL category.

See Resource Availability for more details.
Event Management Enhancements
Improved Alert Correlation and Inference Handling
OpsRamp will no longer correlate any additional alerts to the incident associated with an inference marked as Resolved or Closed. This update ensures that new alerts received after resolution or closure will generate fresh inferences, allowing you to take appropriate actions based on the latest information.
Service Maps Enhancements
Enhanced Error Messaging for Service Map Actions
OpsRamp now offers detailed information about the reason for failure when uploading a service map. This feature helps you to understand the specific cause of the upload failure. Here are some common reasons for failure:
- Invalid file format: The uploaded file does not adhere to the required format for service map configuration.

- Empty alert: The service map configuration lacks essential alert information, resulting in a failed upload.

- Empty availability threshold: The availability threshold for the service map is not specified, leading to an unsuccessful upload.

Having this information enables you to take appropriate actions to resolve the issue effectively.
API Framework Enhancements
Modified/created timestamps
APIs to manage tags (custom attributes) have been updated to support tag names and tag values of up to 255 characters.
See API documentation for more information.
Tags(custom attributes) APIs supports createdTime and updatedTime
See get and search API documentation for more information
Week of April 28, 2023 (2023.04-U1)
Resource Management enhancements
Login notification alerts
You can now choose to receive an instant notification to your email address for every successful and failed login, logout attempts. This would help you to enhance your account security.

See Set notification options for more details.
Improved VMware discovery
OpsRamp’s Gateway based VMware discovery used to halt vCenter discovery if any host was in a maintenance or disconnected state. However, we have now improved the process so that vCenter discovery can proceed even if a host is in a maintenance or disconnected state. The child resources (for example, VMs, DataStores, and OOBInterfaceDetails) of a host that is in maintenance or disconnected state will not be updated. The rest of the vCenter components will be updated without any impact.
This is implemented for VMware Integration only from Gateway version 14.2.0.
Cloud Monitoring enhancements
Oracle Cloud Discovery & Monitoring Support
Oracle Cloud (OCI) Discovery and Monitoring has been enhanced to include these additional OCI services in this release - API Gateway, Domain Name System (DNS), Load Balancer, MySQL Database, NoSQL Database Cloud, and Web Application Firewall (WAF).
See Supported Services for more details.
AWS CloudWatch event ingestion
OpsRamp now supports AWS CloudWatch alarms ingestion for CWAgent alerts against the EC2 instance.
UI enhancements
Service map link icon
On the Service Maps listing page, you can now see a link icon with the service map name. The link icon indicates that the service map is dependent on another service map and helps you to identify the impact on dependent service map(s) before you make any changes to the main service map.


See Service Maps for more details.
New Embed Tile - Dashboard 2.0
The new Embed Tile type can be used to embed any embeddable URL/webpage directly into the Dashboard as a resizable and dynamic widget.

See Create an Embed Tile for more details.
Core Platform enhancements
Delete, Manage, and Unmanage resources
Monitorable resources that have only agent installed and gateway discovered devices can be managed, deleted or unmanaged. Remaining resources can only be deleted.Note: A maximum of 40 resources/devices can be selected to perform the above actions.
See Delete, Manage and Unmanage resources for more details.
Dashboard 2.0 enhancements
Navigate from service widget to alerts page
Users can now access the alerts specific to a service from the service widget in Dashboard 2.0. Hover on the service to view critical and warning alerts and on click, the new alerts browser will open to show these alerts in context.

See Create a Service Tile for more details.
New Tickets tile - Dashboard 2.0
Users can now view their tickets through a new Ticket tile based on standard ticket attributes in Dashboard 2.0.

See Create a Ticket Tile for more details.
Added resource attributes in Alert tile
The Resource attributes have been added to the query filter for the Alert tile in Dashboard 2.0.

Monitoring Management enhancements
Secured visibility for template parameters
Template configuration parameters such as key/secrets of the certificates and other sensitive data used in monitor’s parameters are now masked for improved security.
Support for multiple custom script arguments - Agent and Gateway RSE Frameworks
Multiple custom script arguments support is provided in Agent and Gateway Remote Script Executor frameworks.
Users can now give multiple script arguments separately rather than a single large argument with delimiters.
See Multiple Custom Script Arguments in Macro for more details.
Default G2 template precedence
The G2 Template Monitoring system has been enhanced to enforce a priority order for template processing when multiple templates, containing the same metric definitions, with different tenancy scopes and frequencies are applied to the same resource. This will ensure that the correct template configuration is applied to the resource.
Please take note of the following priority order, which determines the final template configuration:
- Templates in lower tenancy scopes will have higher precedence than those at higher levels in the hierarchy. For example, client level templates will have higher precedence than partner-level templates, and so on.
- If the templates are within the same tenancy scope, then the template with the latest updated time will take precedence over templates modified earlier.

Please note that client scopes are considered to be lower in the tenancy hierarchy tree, with parent partner at one level above and the service provider scopes at the topmost level in the tenancy hierarchy.
Note: Users will now see consistency in metric graph data and alerting based on the template that takes precedence.
See Template Precedence for more details.
New Reporting Apps added
With this release, we have published two new apps. Both the Reporting Apps are available at Partner and Client level user accounts.
Patch Details
This app supports reporting on patches by resource and patch attributes, and provides detailed patch information.
See Patch Details for more details.
Monitor Details
This app provides an inventory of monitoring templates and monitors assigned to managed resources.
See Monitor Details for more details.
Scripts enhancements
Added “Device Group” selection to apply script
The support for Device Group filter has been added to select devices to apply scripts.
By default, the dropdown option in the groups filter is set to DeviceTypes. We have now added the Device Group option to the filters, allowing users to select any of the device groups of respective devices.
See Apply Scripts for more details.
Process Automation enhancements
Added option to Export and Import the existing process definition across clients
You can now copy one process definition from one tenant to another. You need to download the JSON file from one tenant and upload it to any one of the tenants as required.


See Export and Import the Process Definitions for more details.
Integration Framework enhancements
Login with same SSO into multiple partners and clients
The Identify Provider’s Name Identifier with OpsRamp tenant-unique prefix option has been provided to create usernames with a unique 3-digit alphanumeric prefix and install the same SSO identity provider across multiple tenants.

Note: Once you enable the Identify Provider’s Name Identifier with OpsRamp tenant-unique prefix option, you cannot revert your changes.
See OpsRamp configuration for more details.
CA Flowdock, PMG, ECC and TigerPaw collaboration in the Available Integrations
Users can now view CA Flowdock, PMG, ECC and TigerPaw collaboration integrations in the Available Integrations section.

See CA Flowdock, PMG , ECC , and Tigerpaw for more details.
Tenancy and RBAC enhancements
RBAC Support for resources
To manage Schedule Maintenance windows at the site and client level for resources, users must have the All Resources permission in their permission set. Users with All Resources permission can create Schedule Maintenance for devices, device groups, sites, and clients in general. However, if a user’s permission set includes any resource level permission, they can only create Schedule Maintenance windows for those specific resources.
API updates
The GET and PUT operations on the custom branding APIs no longer support the following fields:
headerBackgroundColortabBackgroundColor
See API Documentation for more information.
Week of March 28, 2023 (2023.03-U1)
Dashboard enhancements
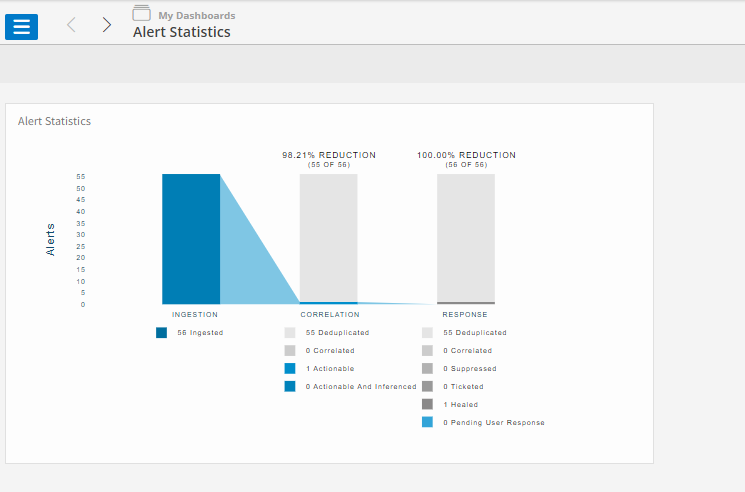
Alert statistics at partner level
The alert statistics widget can now be viewed at the partner level in addition to the client level. It will be available in the Alert Statistics curated dashboard.
UI enhancements
View resources option for Installed Integrations
Users can now view the resources discovered by using the View resources option next to each instance of the integration.
- Navigate to Setup > Integrations and Apps
- Click the integration.
- Click View resources from the three dots.
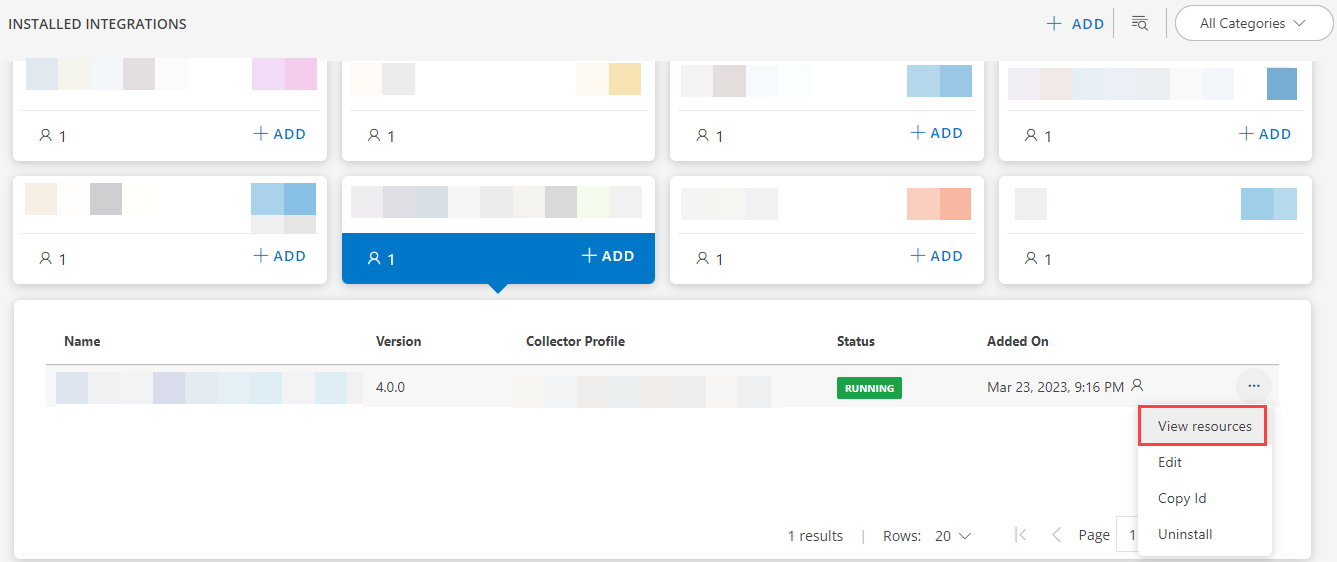
See Modify an Installed Integration or Application for more details.
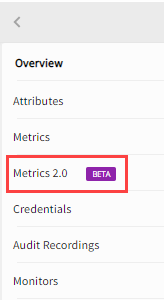
Metrics 2.0 Beta tab
When the user navigates to Infrastructure > Resources and selects a resource, two Metric tabs are visible on the left hand side. In the current release, the Beta version of Metrics has been changed to Metrics 2.0 BETA.
Core Platform enhancements
Identify the application associated with the resources
In the resource slide-out, users can now see which app/integration discovered the resource.
See Resource Overview for more details.
Reporting Apps
Reporting apps are a new capability that offer comprehensive reporting and analytics on the operational data. Here are the highlights of this new capability:
- Collection of supporting apps: With this first release, OpsRamp offers a collection of apps that cover everyday reporting needs:
- Alert Listing
- Asset Insights
- Asset Inventory
- Executive Summary
- Metered Usage Insights
- Network Utilization
- OPS 360 for Patching
- Process Definition Insights
- Remote Control Usage
- Software Inventory
- Metric Insights
In the future releases, the collection of apps is expected to grow.
Visualization and formats options: Reporting apps provide rich visualization of users data in both document and spreadsheet formats.
Analytics and insights: Reporting apps mine users data to generate analytics that provide insights into your environment.
Flexible options to run and share reports: Users can run the reporting apps on demand or on a schedule, and share them with other users.
See Reporting Apps for more details.
Tenancy and RBAC
RBAC support for OpsRamp APIs
OpsRamp APIs can now be accessed by generating user specific OAuth client credentials in addition to creating custom integration. This allows applying user assigned RBAC to APIs. Also, auditing for operations performed via APIs will be recorded against the user account for which the API credentials are created.
This feature is only available to new users.
See Create a User for more details.
Cloud Monitoring enhancements
Aws EFS - add storage utilization
OpsRamp now supports monitoring StorageBytes metric for EFS resources in AWS.
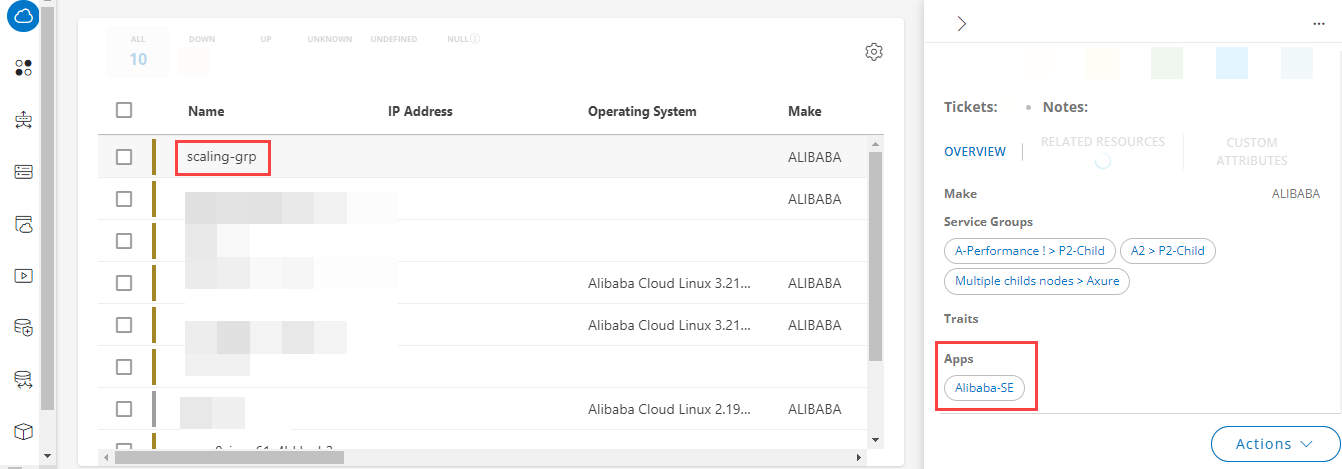
Azure Container Apps Support
OpsRamp now supports discovery and monitoring of Azure Container Apps
See Azure Container Apps for more details.
Metrics request for Azure Kubernetes Service
OpsRamp now supports monitoring for Kubernetes Service in Azure.
See Azure Kubernetes Service for more details.
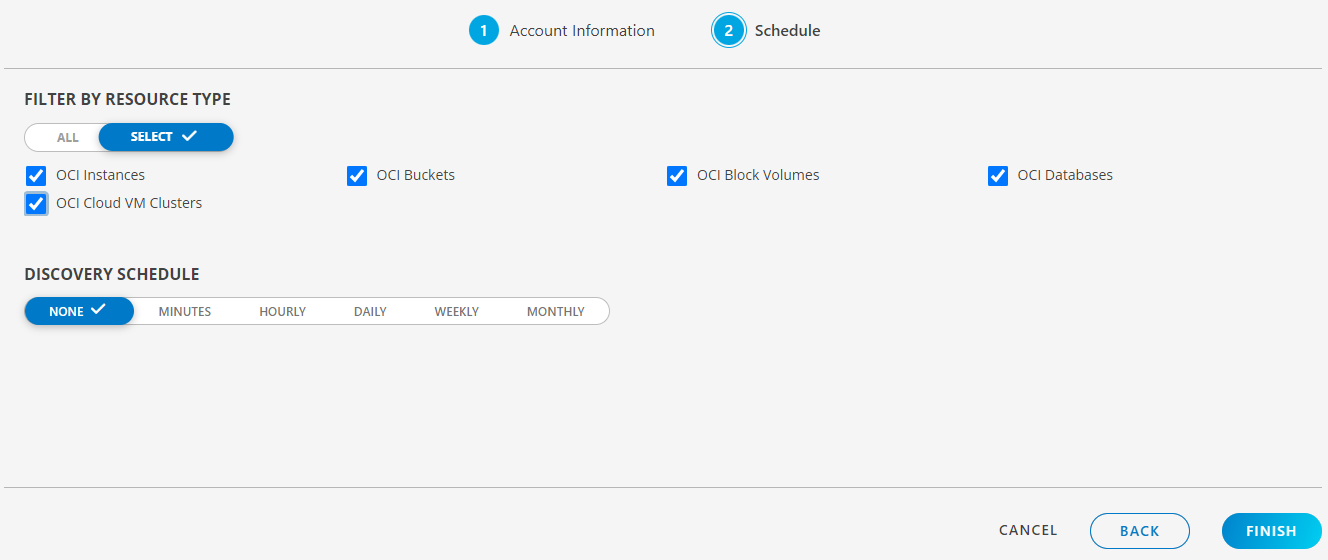
Oracle Cloud Discovery & Monitoring Support
OpsRamp now supports discovery and monitoring of Oracle Cloud resources.
See Oracle Cloud for more details.
Log Management enhancements
Provided “Disable Logs” option at the agent level
If the user enables the “Disable Logs” option at the Agent level, it will completely stop log ingestion from a specific agent. This improves the usability and makes it easier for the users to control the log ingestion.
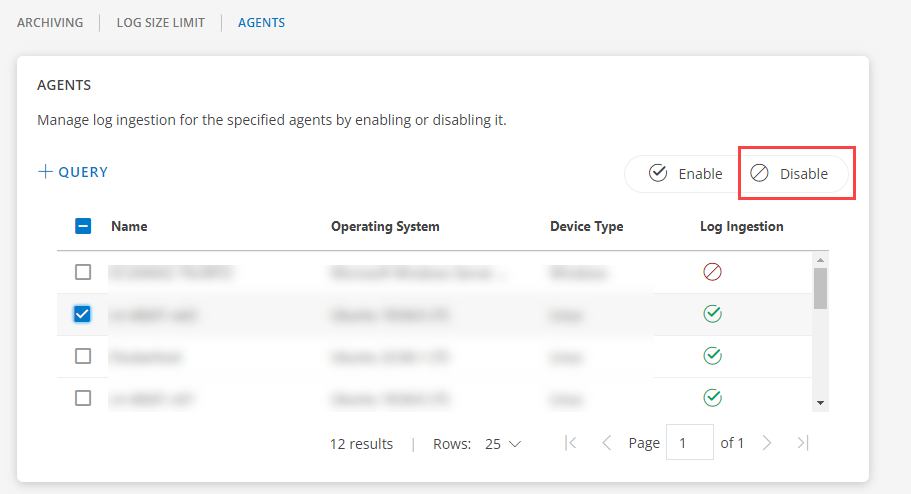
See Disable Logs - Agent Level for more details.
Patch Management enhancements
Reboot required for each server after patch installation
Provided an option to enable force reboot of the server, even if patch did not demand the reboot after installation. This option is provided in Classic and Patch Management 2.0 UI.
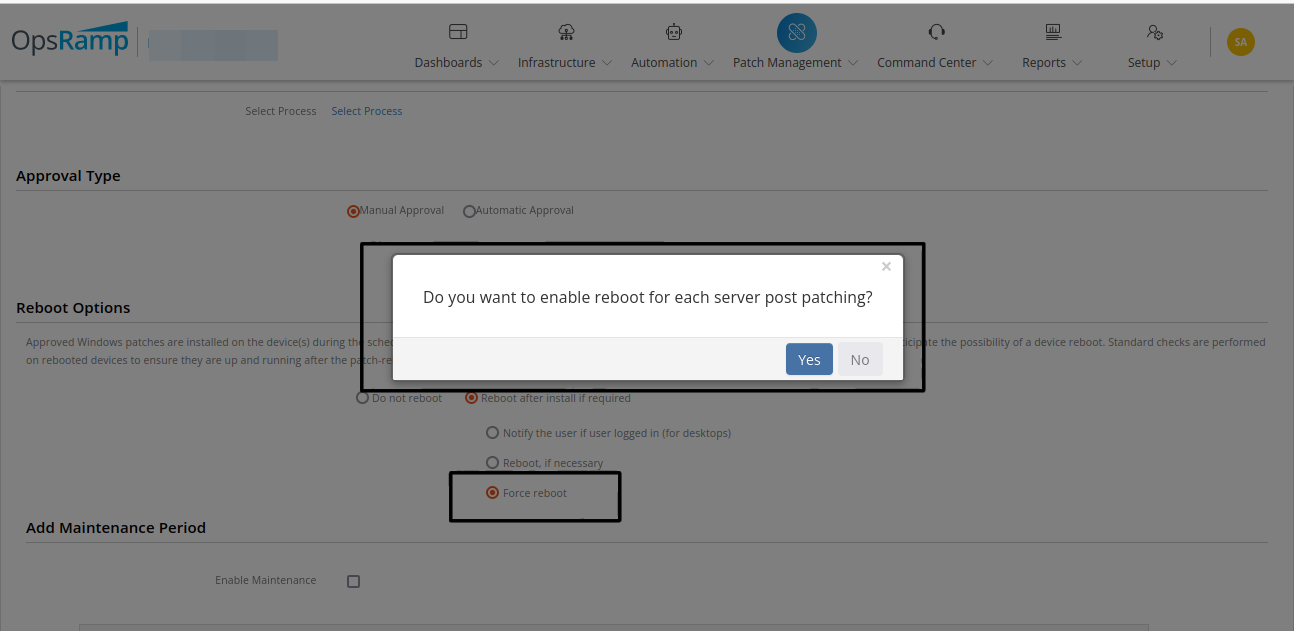
See Patch Configurations for more details.
Recompute option is provided under Patch Configuration
Recompute is assigned to resources when one of the following conditions is met:
- When a dynamic query patch configuration is removed.
- If the query is no longer valid.
- If the resources qualify for another patch configuration with a higher precedence order.
Note
Recompute is only applicable to dynamic patch configurations.See Recompute for more details.
Process Automation enhancements
Process Definitions - Error Boundary Event support to handle errors
Whenever an error occurs during process definition execution, the task with an error can be re-routed without any halt in the process.
See Component menu for more details.
Week of February 28, 2023 (2023.02-U1)
UI enhancements
Added Stacked Bar visualization in alert tile
A new stacked bar chart visualization is now available for resource and alert tiles. Additionally, this new chart also allows users to view an alert trend in the alert tile.
See Introduction to Tiles section for more details.
Assign custom attributes directly from the Service Maps page
Now users can view, assign, and delete the custom attributes on the Service Maps nodes directly from the Service Maps page. Prior to this, there was no direct way to do this from the Service Maps page and users could only do this from the Setup > Custom Attributes page to manage the attributes.
This will help users save time and an easy way to manage custom attributes within the Service Maps.
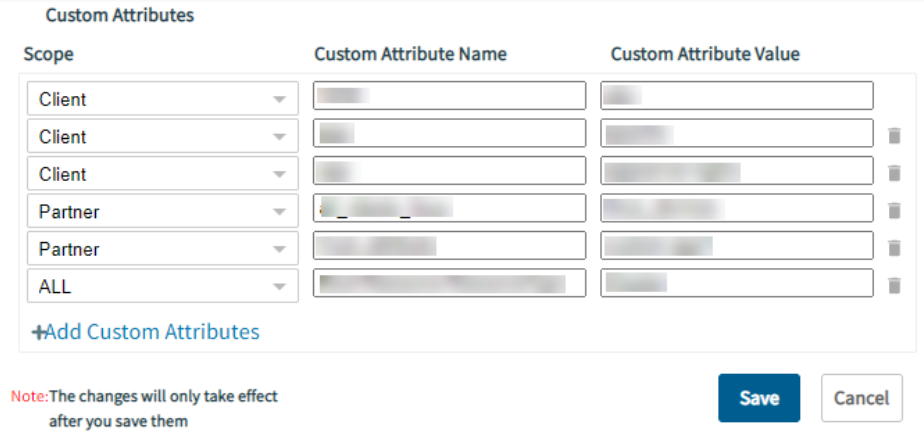
See Service Maps section for more details.
Back icon support in First Response and Alert Escalation policy page
A back icon has been provided in the First Response and Alert Escalation policy details page where users can return to the filtered results.
Patch Management enhancements
Activity Logs
We have added the necessary logs for Patch Configuration, Patch Scan, and Compliance, so users can now view all the activity logs.
See Activity Logs section for more details.
Provided drill down links in the patch overview page
We have provided drill down links in the patch overview page to help users in accessing individual widget data via these links.
See Patch Overview Page section for more details.
Cloud Monitoring enhancements
Google interconnect resource support
OpsRamp now supports the discovery and monitoring of Google interconnect attachments resources.
Azure container registries resource support
OpsRamp now supports Azure container registry resource discovery and monitoring.
Azure Maps Account resource support
OpsRamp now supports Azure Maps Account resource discovery and monitoring.
Zoom monitoring APIs optimization
OpsRamp now uses fewer API calls for Zoom monitoring. This means that users will experience faster and more efficient performance when using Zoom integration.
Alert Management escalation policy enhancements
Option to update comments under Incident Notes section
Users can view the OpsRamp Process and OpsQ Bot comments under the Incident Notes section. To view the comments under Incident Notes, users need to enable the “Enable alert comments to incident notes” property under Service Desk settings.
Correlation policy names available for escalation
Users can now escalate inference alerts by using a specific Alert Correlation policy name. In addition to the Native Alert Attribute - Inference (Yes or No), you can escalate the required Inference alerts using the “ON” or “Observed” mode correlation policy names.
See Alert Correlation Policy section for more details.
Process Automation enhancements
Added a Decision Gateway
Added a new field in the Gateway element to configure the Repeat Count value, which has a dropdown with values ranging from 2 to 10. It will help users in moving on from the current task, even if it tries multiple times.
See Define Gateways section for more details.
Monitoring Management enhancements
Displaying component level thresholds of Templates
The authorized users can now view the component thresholds in the Component Threshold section while fetching the details of an assigned template.
See Define a Threshold section for more details.
Integration Framework enhancements
Provide ability to lookup custom field
In outbound integration, a new function in tokens is added that accepts a custom field as input. When creating the integration via API, the users should now be able to include custom fields in the integration event payloads with their names instead of OpsRamp’s internal mapped value (which varies for each tenant).
MAC Address and Serial-Number Attribute mapping support
Enhanced the inbound Alert webhook integration to add MAC address to the list of mappings that are available to map against client-side request payload. This allows a resource to be created by providing MAC address in the request payload along with the standard alert mapping attributes:
- Subject
- Description
- DeviceName/resourceName
- ServiceName
- State
Uses should be able to view the resource or device with the respective MAC address value.
Core Platform enhancements
Added “Create/Update” feature to the OpsRamp Integration
This feature allows you to Add/Assign the custom attributes (Key and Value pairs) to the integration. The same custom attributes will be automatically assigned to all the resources created by the integration. So, users can now use these custom attributes in Device Management Policies (DMP), Alerts/Incident Policies, and other Policies.
Note
This feature is only applicable to SDK 2.0 Apps.API updates
The following are the updates from the API.
New APIs
Additional v2 endpoints:
- Search Metrics: Users can now search metrics within tenants with various query options. For more details, click here.
- Batch Exports: APIs to configure Batch Export Configurations are now available. For more details, click here.
New v3 endpoints:
- Tags APIs: Custom Attribute API’s are now optimized with new v3 Tag APIs. Users can perform all the existing operations using these APIs. For more details, click here .
Updated APIs
- Users can now download the Proxy-based Agents by passing a new query parameter “profileUUID” to the existing Download Agent endpoint.
- Monitoring Management V3 endpoints
:
The v3 Monitoring management endpoints listed here, it will allow you to customize templates at Resource and Component levels, which were previously only available through the UI. The following endpoints have been updated:S- Create Templates
- Update Templates
- Clone Templates
- Get Template Details
End of Life API endpoints
- The legacy Custom Attribute APIs are deprecated.
- The existing Create batch export config API is deprecated and replace with new APIs listed above.
See API Documentation for more details.
Week of January 30, 2023 (2023.01-U1)
UI enhancements
Enable existing tenants to install Nextgen gateway
You can now view a list of Management Profiles, and install OpsRamp’s Classic and NextGen Gateway Collectors from the Integrations page.
Canonical Service Maps and Topology Map
Provided canonical screens for Service Maps and topology with Overview. Users can create Service Maps or topology from these screens.
Report enhancements
Inventory Report
Inventory report supports Gateway Profile IP Address and Profile Name details for the newly deployed agents.
Whereas, agents installed prior to version 13.0.0 does not support either Gateway Profile IP Address or Profile Name in the Inventory Report even after updating agents to the latest version.
Now, when you update your lower version agents to version 13.0.0 or higher you will get the Gateway Profile IP Address in the Inventory Report. This will help you to identify the Gateway IP address for the agents connecting via proxy.
See Inventory Report section for more details.
Cloud Monitoring enhancements
MSSQL Monitoring - Google
OpsRamp now supports the MSSQL Advance database monitoring for Google using the Gateway Collector.
See Google Cloud SQL for more details.
MSSQL Monitoring - Azure
OpsRamp now supports the MSSQL Advance database monitoring for AZURE using the Gateway Collector.
See Azure SQL Server for more details.
Drill down from Topology to new Resources page
You can now drilldown from the Topology to the new resources page scoped to the specific resource.
Dashboard 2.0 enhancements
Save Dashboard time frame for each user
The dashboard time frame is now saved when navigating away from a dashboard or refreshing the page. When navigating back to the dashboard, the data is seen over the time frame which was viewed earlier instead of resetting to the default time frame.
See Dashboard Duration for more details.
Improve Dashboard filters UI
The dashboard variables manager now has separate sections for metric, resource, and alert tile variables. In addition, when viewing data in a preview graph, the variables are seen at the top of the preview graph so that the preview graph data can be changed based on the variables configured at the dashboard level.
See Create Dashboard Variables for more details.
Service Availability widget (Partner Level)
Availability of the services defined in the Service Maps is now available as a new dashboard widget. The widget:
- Can be edited at the partner level.
- Cannot be edited at the client level but can only be viewed.
See Create a ServiceTile for more details.
Alert Management enhancement
Notifications for OK alerts
When a notification is sent for a critical or a warning alert, a notification for an OK alert is also sent irrespective of whether an action is taken on the alert or not.
Process Automation enhancement
Add Alert Type and Alert Status fields
Added support for “Alert type” while creating the alert from process definition.
Patch Management enhancement
Patch Actions in Workflows
OpsRamp introduced following new:
- Search patches: Searches for the required patches based on the filter criteria that has been provided.
- Rate patches: Rates the patches based on the given criteria.
- Exclude/include patches: Performs exclusion and inclusion of patches at the resource level.
See Patch Management Process for more details.
Tenancy and RBAC enhancement
Auto GDPR Consented Clients
Partner users can now enable auto consent for GDPR for their managed Client users.
See Skip User Consent Form for more details.
Monitoring Management enhancement
Renamed SSH Integration
The SSH integration has been renamed to LINUX. The update is now reflected in the integrations UI as well as the new infrastructure UI.